Products
SentimenTrader Trading Tools
‍
Backtest Engine
My Trading Toolkit
Correlation Analysis
Seasonality
Indicators & Data API
‍
Proprietary Indicators & Charts
Market Data API
Strategies & Scanner
‍
50+ Trading Strategies
Smart Stock Scanner
Research Reports
‍
Research Solutions
Reports Library
Free Resources
Simple Backtest Calculator
Simple Seasonality Calculator
The Kelly Criterion Calculator
Sentiment Geo Map
Public Research Reports
Pricing
Company
About
In the News
Testimonials
Client Success Stories
Contact
Log inLoginSign up
< BACK TO ALL REPORTS

What I'm looking at - stocks in a correction, KBW Bank Index, sentiment indicators, DAX breadth, high yield

Troy Bombardia
2019-10-29
null

With the U.S. stock market at new all-time highs, here's what I'm looking at:


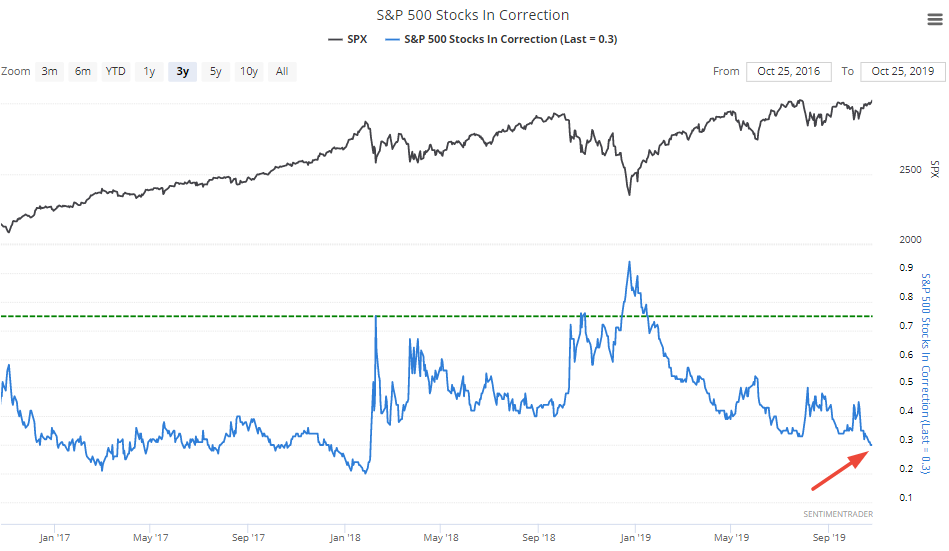
% of stocks in a correction

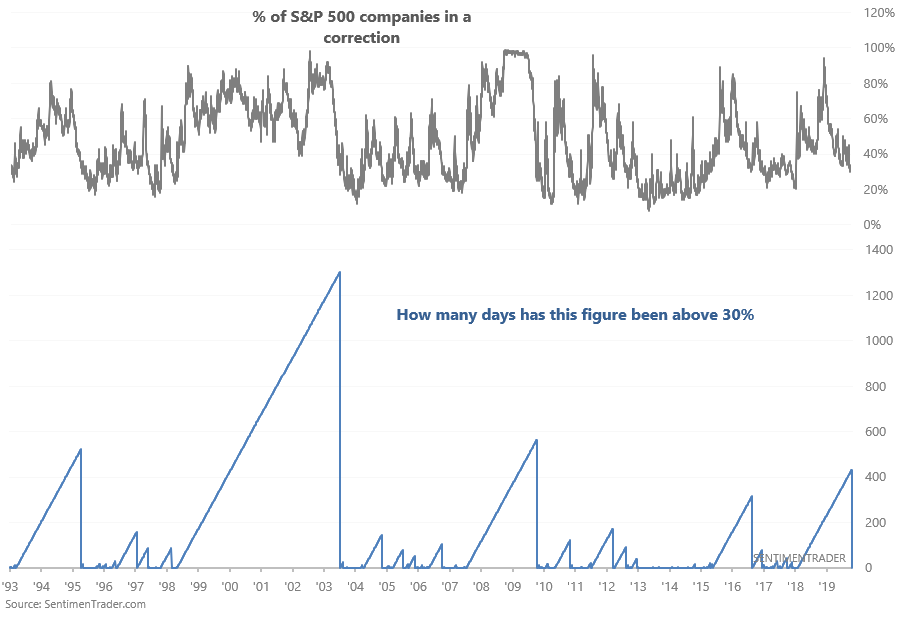
Last week I looked at the decrease in S&P 500 stocks that were in a bear market. Similarly, the % of S&P 500 stocks in a correction (at least 10% below a 52 week high) is also declining:

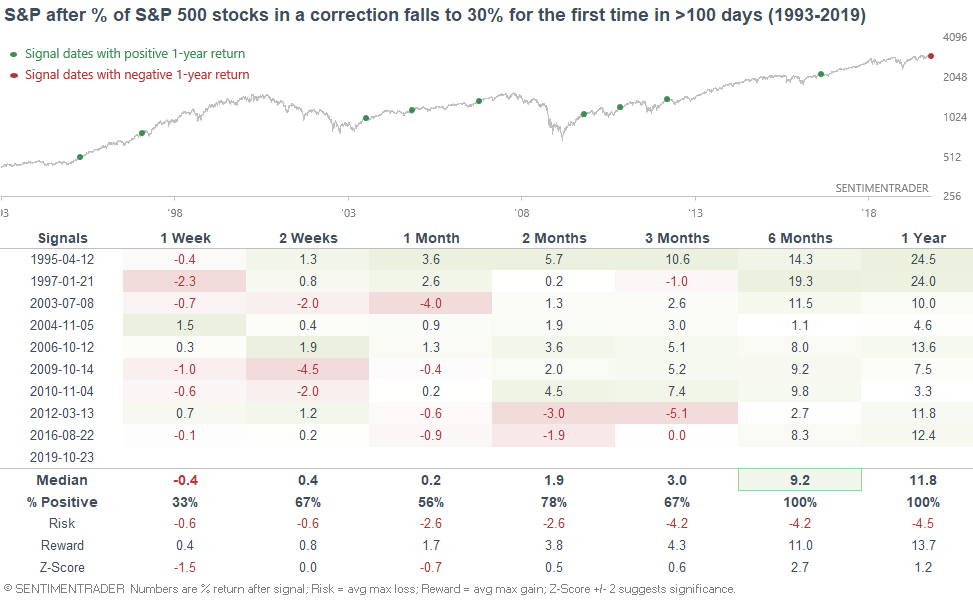
When this figure fell to 30% for the first time in more than 100 days...

...the S&P rallied over the next 6-12 months:
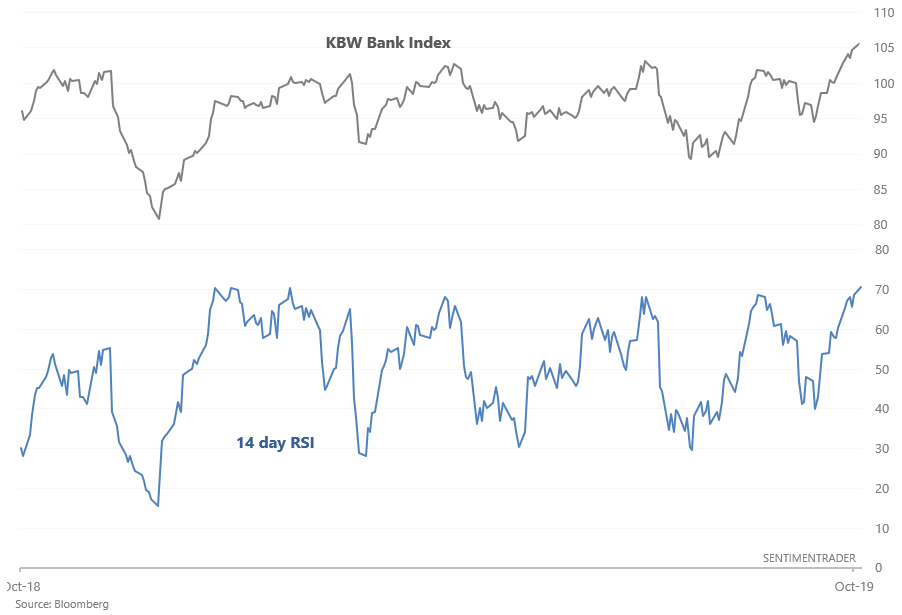

KBW Bank Index

As the S&P 500 breaks out, financial stocks led the way. The KBW Bank Index has surged since early-October, causing its 14 day RSI to exceed 70 (overbought) for the first time since February 2019:

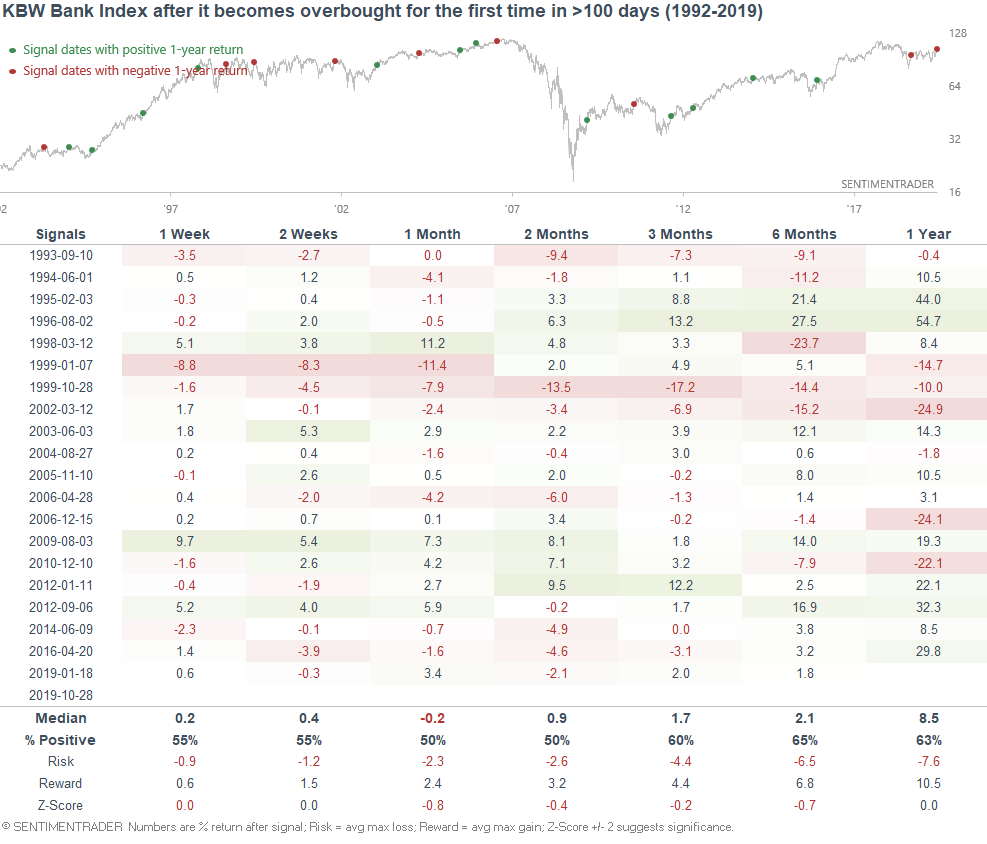
When the KBW Bank Index's 14 day RSI exceeded 70 for the first time in more than 100 days, its returns over the next 1-2 months were mixed, with an emphasis on downside bias:

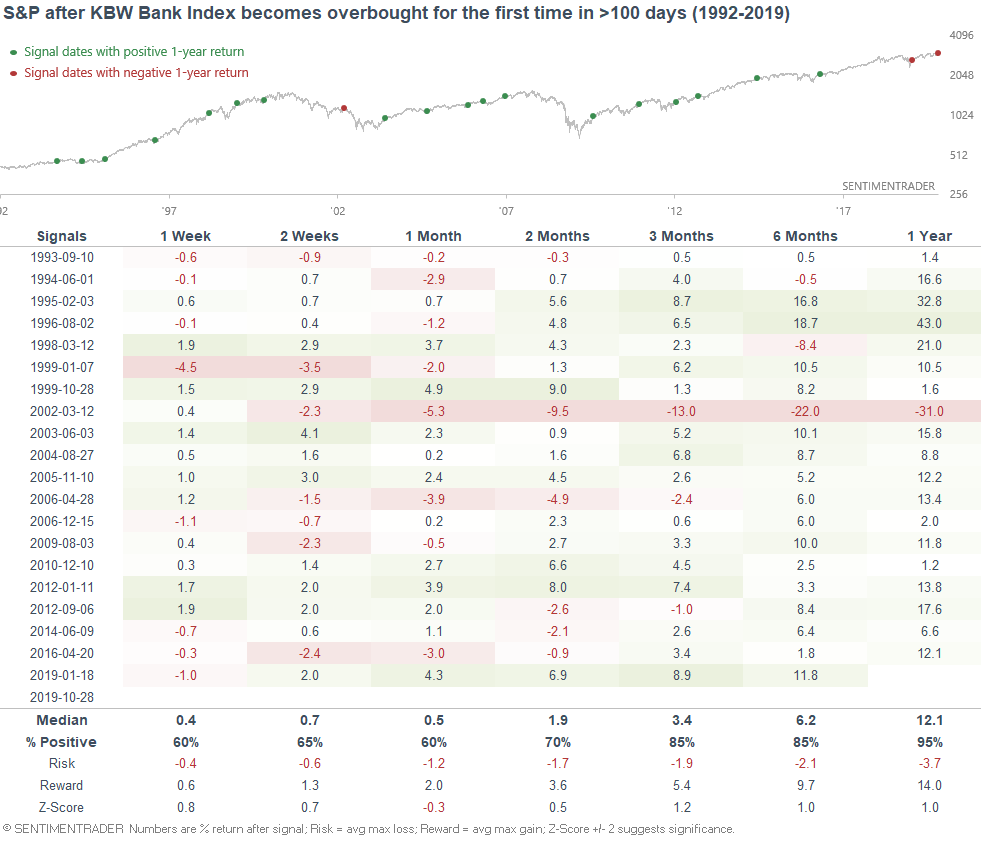
For what it's worth, here's what the S&P 500 did next. Mostly gains over the next 3-12 months, with the big exception being March 2002:


Various sentiment indicators

As the stock market rallies, various sentiment indicators are reaching levels of excessive optimism. For example, our Intermediate Term Optimism Index has risen to 70:

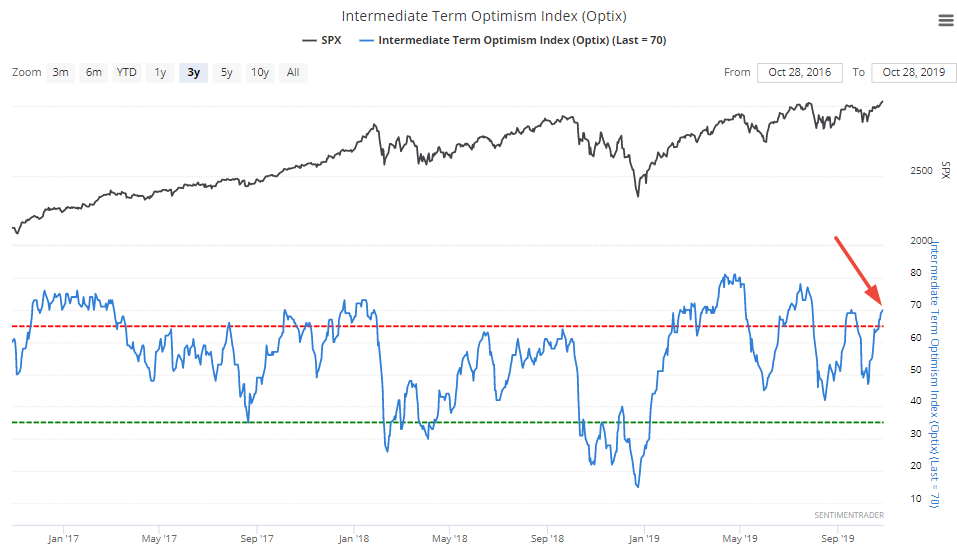
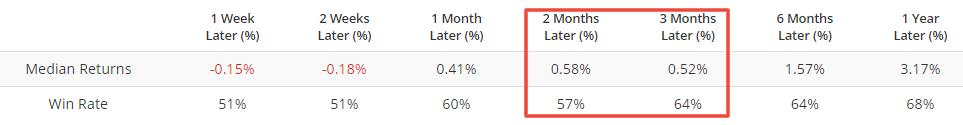
When it did so in the past (excluding overlapping signals over the past month), the S&P 500's forward returns weren't consistently bearish, but were worse than random:

For a more accurate sell signal, it's better to wait for the Intermediate Term Optimism Index to rise to 80.

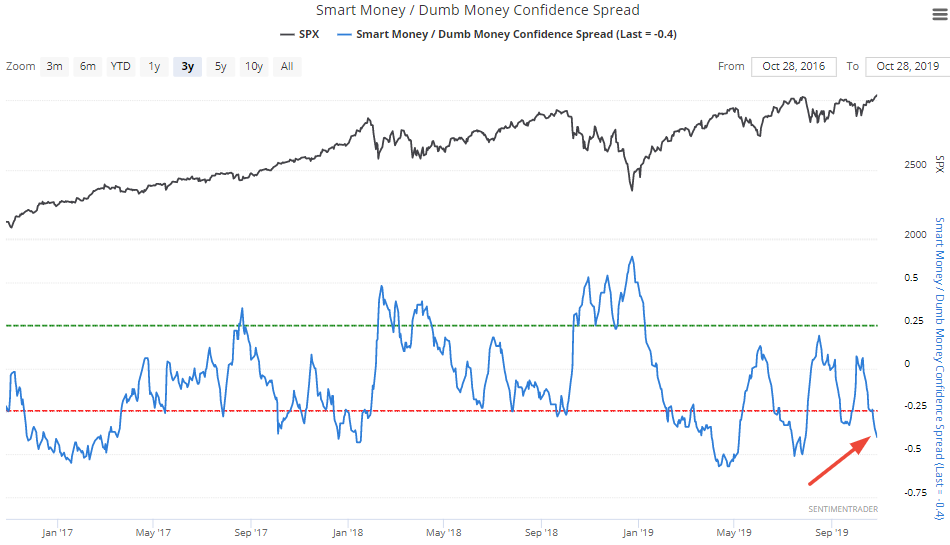
Similarly, our Smart Money/Dumb Money Confidence Spread has fallen to -0.4:

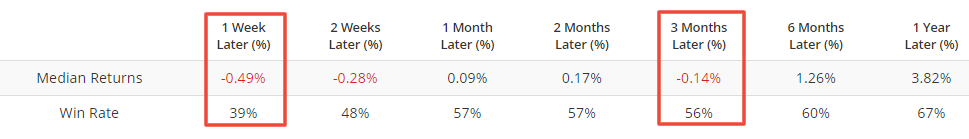
When it did so in the past, the S&P's returns over the next few weeks and months were worse than random:


DAX breadth

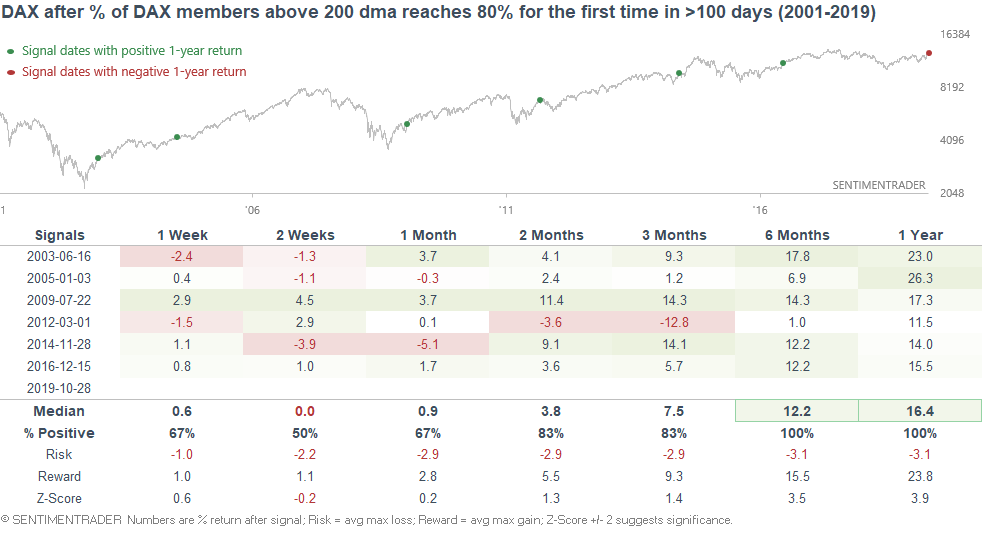
As overseas markets continue to rally, the % of DAX members above their 200 dma has reached 80% for the first time since October 2017:

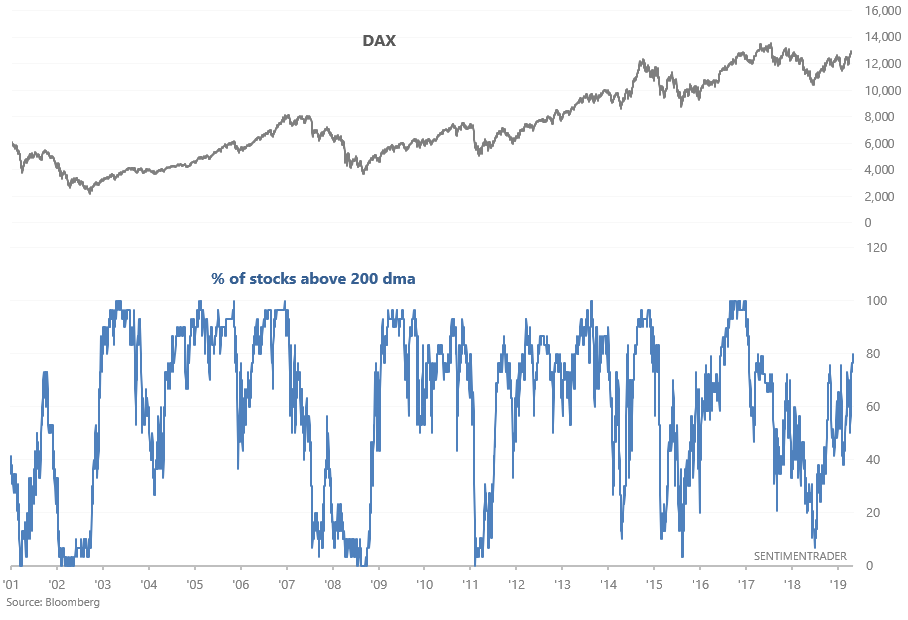
When this figure reached 80% for the first time in more than 100 days, the DAX consistently went higher over the next 6-12 months:
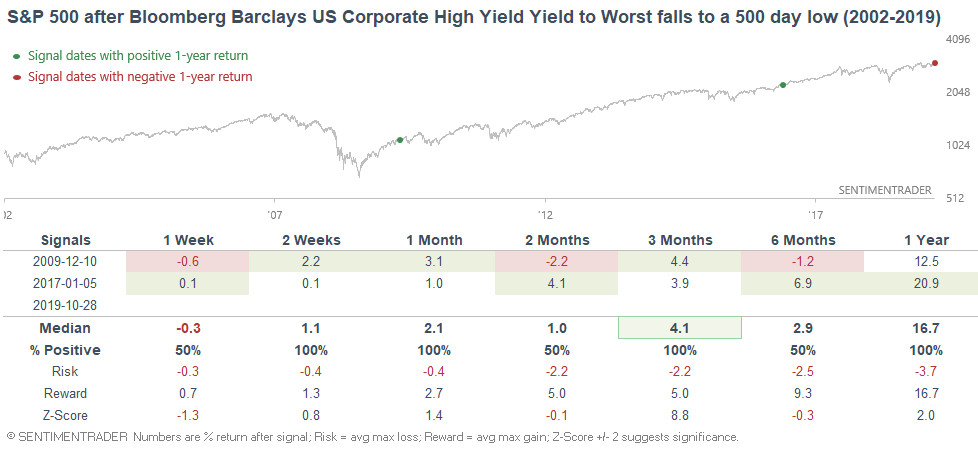

High yield

And finally, as the WSJ noted, yields on U.S. high-yield debt have fallen to the lowest level since 2017:

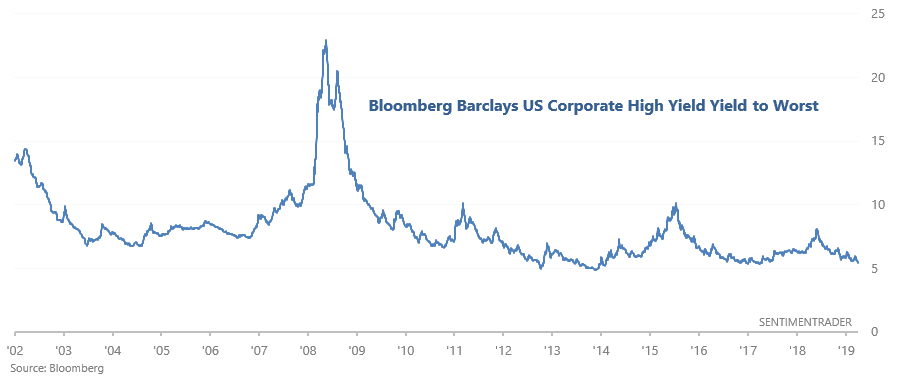
The 2 other times it did so, the S&P soared over the next year:

Sorry, you don't have access to this report

Upgrade your subscription plan to get access
Go to Dasboard
PRODUCTS
SentimenTrader
Trading Tools
Indicators & Data API
‍
Strategies & Scanner
‍
Research Reports
FREE
RESOUrCES
Simple Backtest
Calculator
Simple Seasonality
Calculator
The Kelly Criterion
Calculator
Sentiment Geo Map
‍
Public Research Reports
‍
Pricing
Bundle pricing
‍
Announcements
‍
FAQ
COMPANY
‍
About
‍
In the News
‍
Testimonials
‍
Client Success Stories
CONTACT
‍
General Inquiries
‍
Media Inquiries
‍
Financial Professionals Inquiries
‍
© 2025 Sundial Capital Research Inc. All rights reserved.
Setsail Marketing
TermsPrivacyAffiliate Program
Risk Disclosure: Futures and forex trading contains substantial risk and is not for every investor. An investor could potentially lose all or more than the initial investment. Risk capital is money that can be lost without jeopardizing ones’ financial security or life style. Only risk capital should be used for trading and only those with sufficient risk capital should consider trading. Past performance is not necessarily indicative of future results.

Hypothetical Performance Disclosure: Hypothetical performance results have many inherent limitations, some of which are described below. No representation is being made that any account will or is likely to achieve profits or losses similar to those shown; in fact, there are frequently sharp differences between hypothetical performance results and the actual results subsequently achieved by any particular trading program. One of the limitations of hypothetical performance results is that they are generally prepared with the benefit of hindsight. In addition, hypothetical trading does not involve financial risk, and no hypothetical trading record can completely account for the impact of financial risk of actual trading. for example, the ability to withstand losses or to adhere to a particular trading program in spite of trading losses are material points which can also adversely affect actual trading results. There are numerous other factors related to the markets in general or to the implementation of any specific trading program which cannot be fully accounted for in the preparation of hypothetical performance results and all which can adversely affect trading results.

Testimonial Disclosure: Testimonials appearing on this website may not be representative of other clients or customers and is not a guarantee of future performance or success.