Products
SentimenTrader Trading Tools
‍
Backtest Engine
My Trading Toolkit
Correlation Analysis
Seasonality
Indicators & Data API
‍
Proprietary Indicators & Charts
Market Data API
Strategies & Scanner
‍
50+ Trading Strategies
Smart Stock Scanner
Research Reports
‍
Research Solutions
Reports Library
Free Resources
Simple Backtest Calculator
Simple Seasonality Calculator
The Kelly Criterion Calculator
Sentiment Geo Map
Public Research Reports
Education
Sentiment Indicators
Technical Indicators
Pricing
Company
About
In the News
Testimonials
Client Success Stories
Contact
Log inLoginSign up
< BACK TO ALL REPORTS

What I'm looking at - standard deviations, tech breadth, relative strength, USD

Troy Bombardia
2020-02-14

Here’s what I’m looking at:


Bollinger Bands and momentum

As Seth Golden noted, the S&P has gone many days without a -5% pullback and is currently more than 2 standard deviations above its 200 day average.

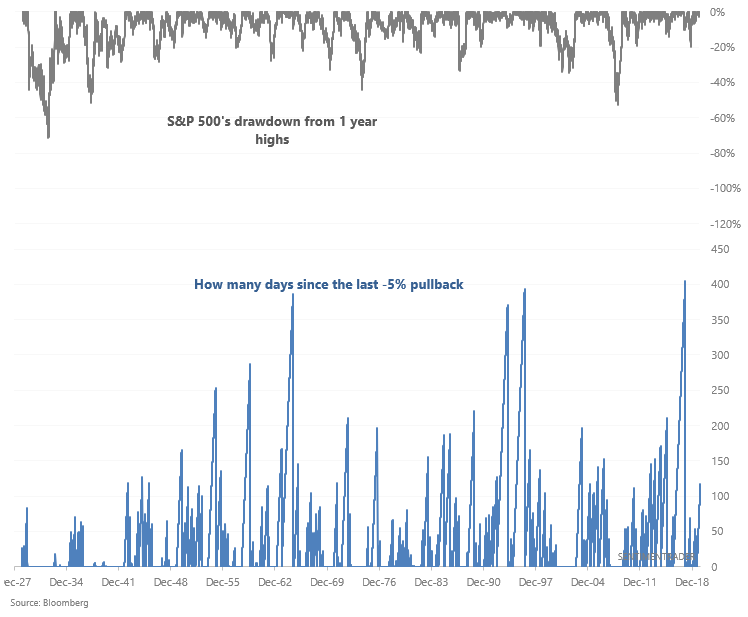
While it could be assumed that this is bearish for stocks, that hasn't always been the case. There's 2 sides to the "market has rallied too much" coin:

  1. Market has rallied too much, so it'll pullback. Or...
  2. Market's momentum is very strong, it'll "eventually" pullback and then rally even further after that.

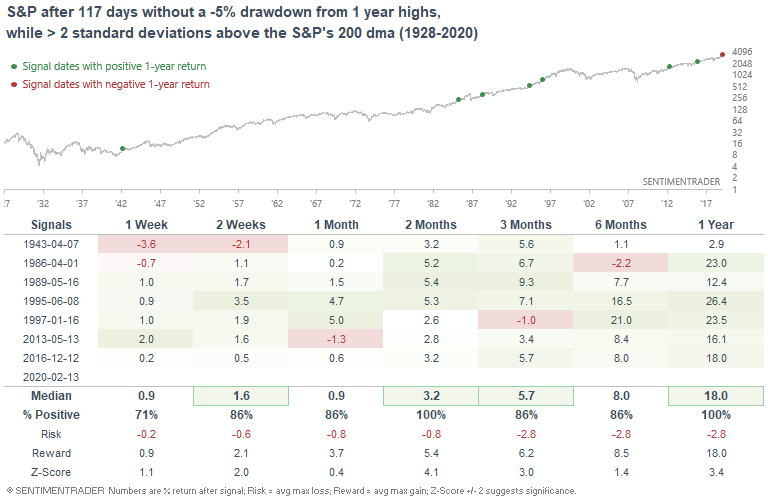
When the S&P went 117 days without a -5% drawdown from 1 year highs while it was more than 2 standard deviations above its 200 dma, the S&P's forward returns on nearly every time frame were more bullish than random.

In the meantime, the S&P is now on the verge of having gone up 15 of the past 19 weeks. Once again, this led to more bullish than average returns over the next 2 months:
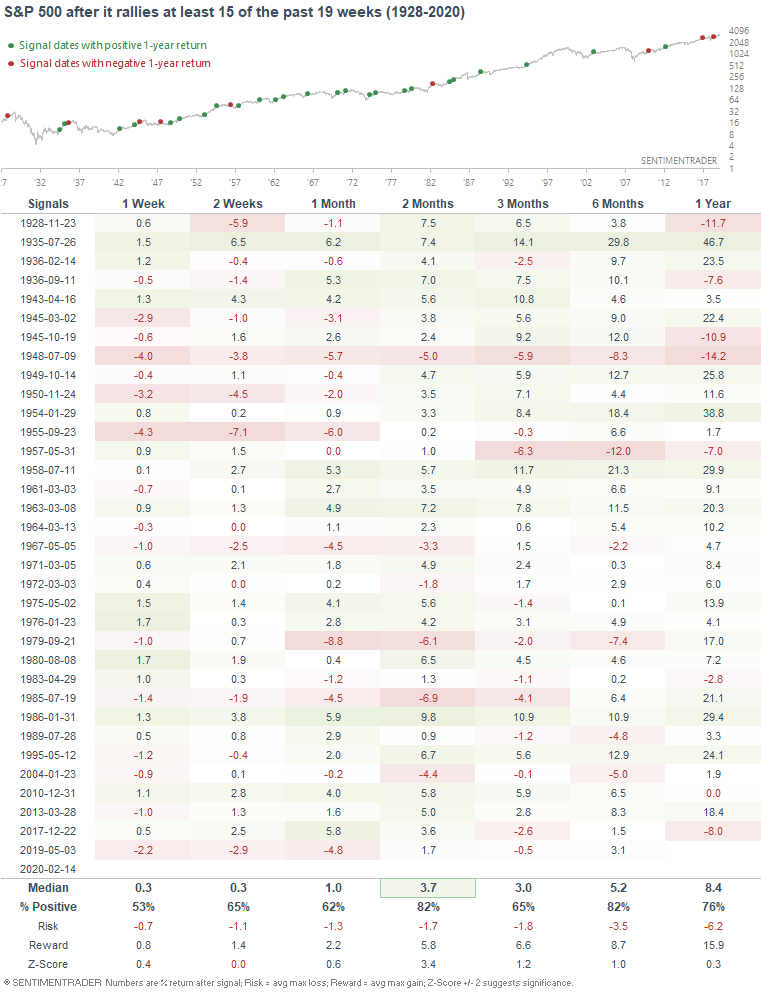
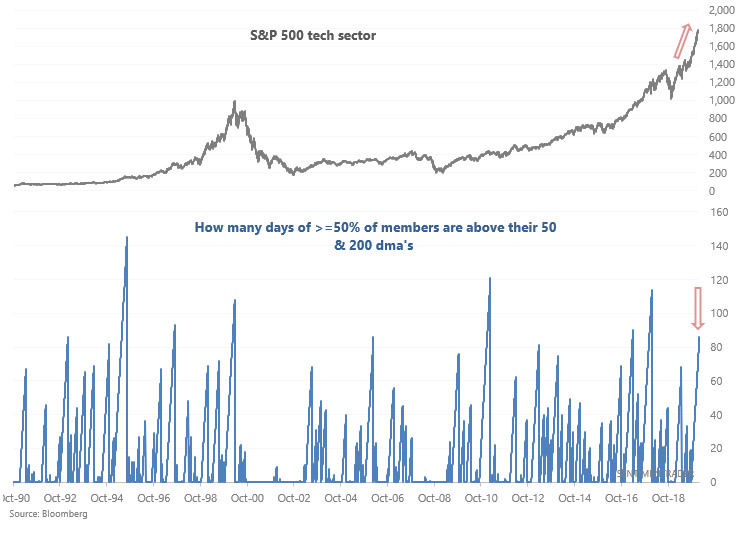
Tech breadth

Tech stocks continue to lead the broad U.S. stock market's rally. At least 50% of the S&P 500 tech sector's members have been above their 50 and 200 dma's for 4 months, which is an extremely long time:

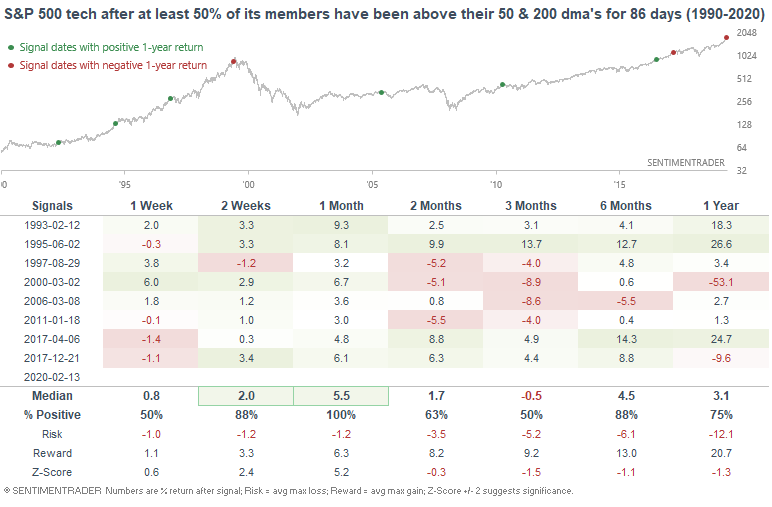
When the S&P 500 tech sector's breadth had been this strong for this long, it often faced weakness over the next 2-3 months:

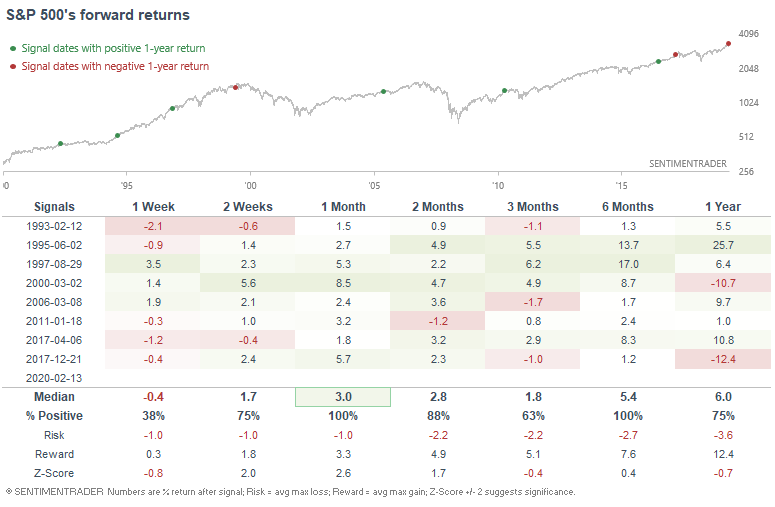
Here's what the S&P 500 did next:


Relative strength

2 of our best trading models rely on the relative strength between the NASDAQ Composite and S&P 500 (here and here). In general, it is far better to go long the NASDAQ when the NASDAQ is outperforming, and it's far better to go long the S&P 500 when the S&P 500 is outperforming. In other words, it's usually better to be a trend follower than a contrarian when it comes to the NASDAQ:S&P ratio.

However, the NASDAQ:S&P ratio has increased so much that its 14 week RSI is now above 83: 


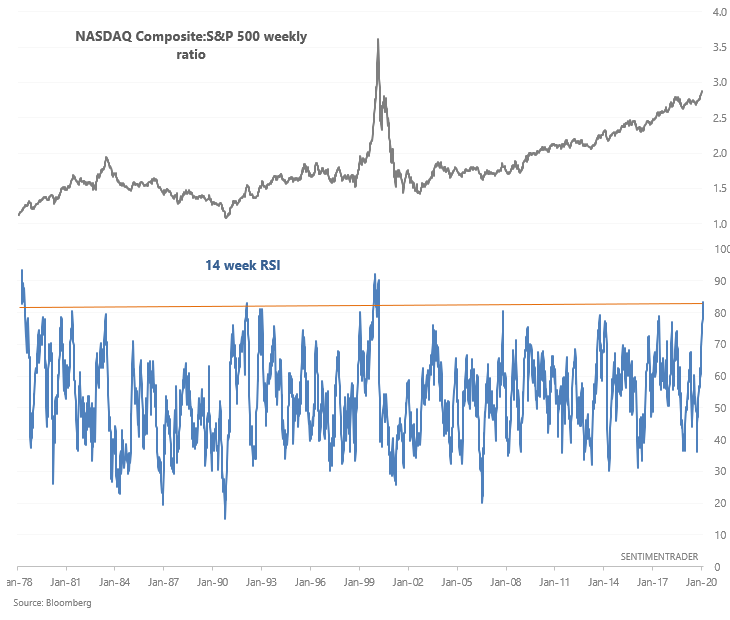
Aside from the initial case in 1978, there were only 2 other times when this happened. In general, this wasn't great for the NASDAQ:S&P ratio or for the NASDAQ and S&P:

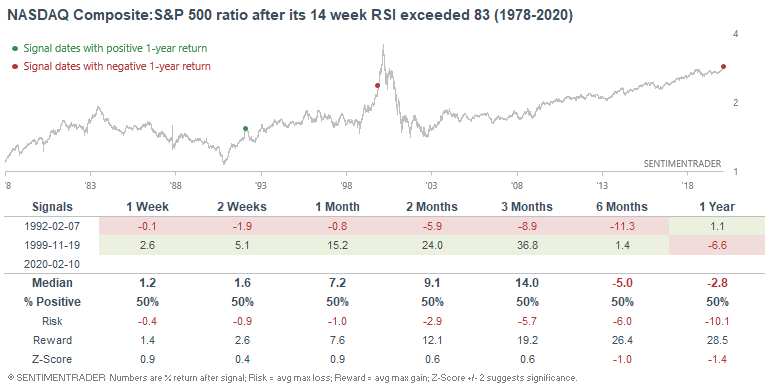
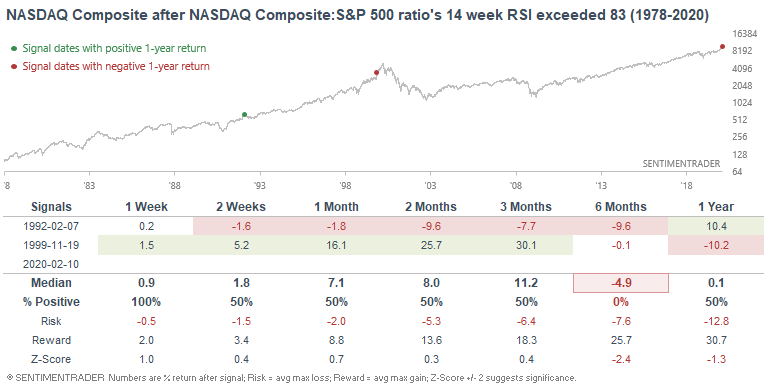
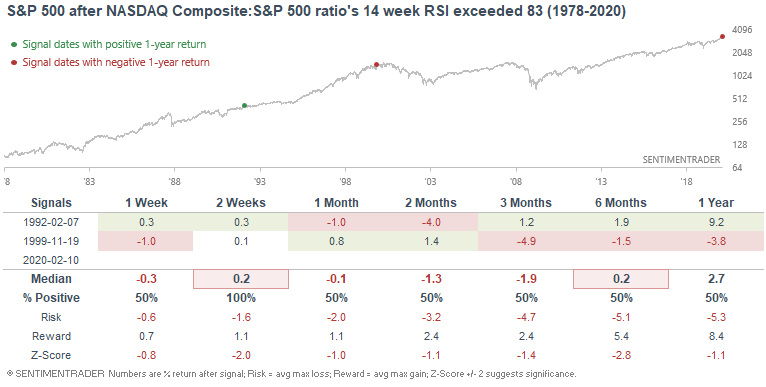
However, a sample size of 2 isn't big. So I wouldn't consider this to be a major short term bearish factor for stocks. 
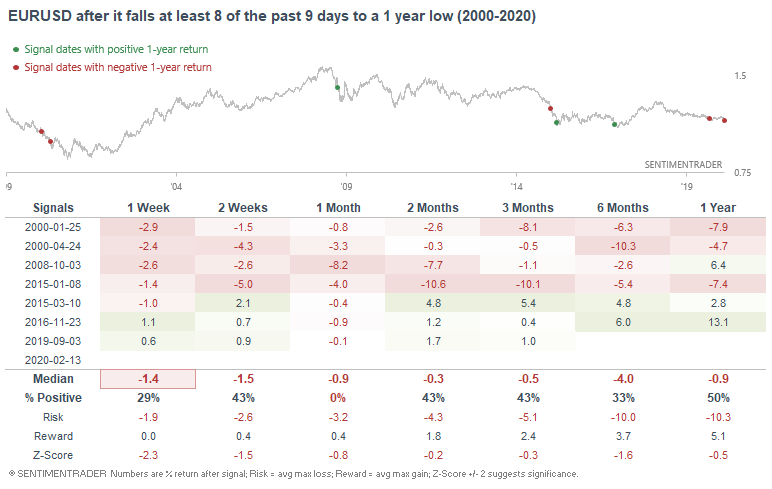

Dollar

And finally, the USD continues to rally while other currencies continue to sink against the USD. 

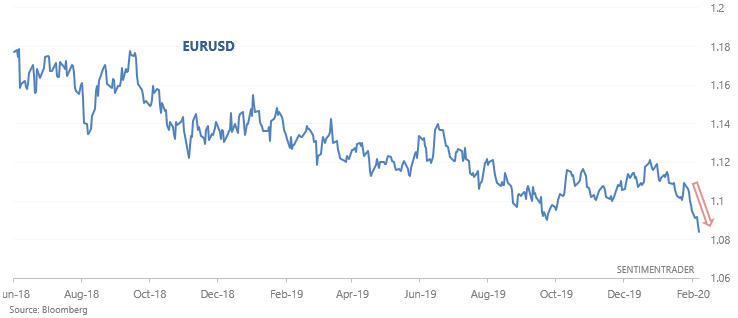
EURUSD has fallen 8 of the past 9 days to a multi-year low. When this happened in the past, its returns over the next month were weak:


My trading portfolio

My trading portfolio is allocated 50% in the Macro Index Model and 50% in the Simple Trading Model With Fundamentals. At the moment I have instituted a discretionary override and gone 100% long bonds (instead of long stocks) due to the extreme nature of many of our core indicators, even though some of these core indicators aren't in the models.

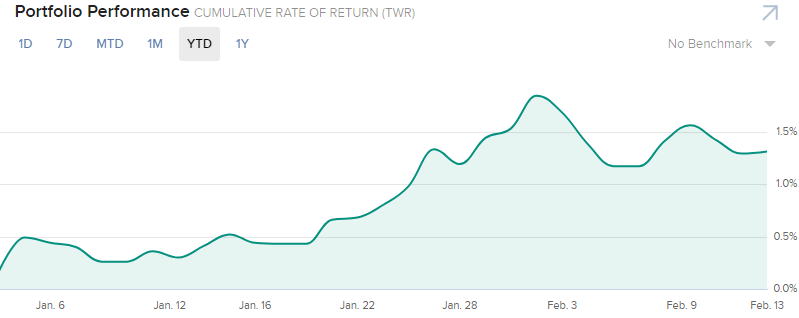
Performance YTD 2020:

  1. My trading account is up 1.31%

  2. Currently 100% in bonds

Sorry, you don't have access to this report

Upgrade your subscription plan to get access
Go to Dasboard
PRODUCTS
SentimenTrader
Trading Tools
Indicators & Data API
‍
Strategies & Scanner
‍
Research Reports
FREE
RESOUrCES
Simple Backtest
Calculator
Simple Seasonality
Calculator
The Kelly Criterion
Calculator
Sentiment Geo Map
‍
Public Research Reports
‍
Education
Sentiment Indicators
‍
Technical Indicators
‍
Pricing
Bundle pricing
‍
FAQ
‍
Announcements
‍
COMPANY
‍
About
‍
In the News
‍
Testimonials
‍
Client Success Stories
CONTACT
‍
General Inquiries
‍
Media Inquiries
‍
Financial Professionals Inquiries
‍
© 2025 Sundial Capital Research Inc. All rights reserved.
Setsail Marketing
TermsPrivacyAffiliate Program
Risk Disclosure: Futures and forex trading contains substantial risk and is not for every investor. An investor could potentially lose all or more than the initial investment. Risk capital is money that can be lost without jeopardizing ones’ financial security or life style. Only risk capital should be used for trading and only those with sufficient risk capital should consider trading. Past performance is not necessarily indicative of future results.

Hypothetical Performance Disclosure: Hypothetical performance results have many inherent limitations, some of which are described below. No representation is being made that any account will or is likely to achieve profits or losses similar to those shown; in fact, there are frequently sharp differences between hypothetical performance results and the actual results subsequently achieved by any particular trading program. One of the limitations of hypothetical performance results is that they are generally prepared with the benefit of hindsight. In addition, hypothetical trading does not involve financial risk, and no hypothetical trading record can completely account for the impact of financial risk of actual trading. for example, the ability to withstand losses or to adhere to a particular trading program in spite of trading losses are material points which can also adversely affect actual trading results. There are numerous other factors related to the markets in general or to the implementation of any specific trading program which cannot be fully accounted for in the preparation of hypothetical performance results and all which can adversely affect trading results.

Testimonial Disclosure: Testimonials appearing on this website may not be representative of other clients or customers and is not a guarantee of future performance or success.