
What I'm looking at - SKEW, gold's year, copper breakout, Pound, palm oil
Here's what I'm looking at:
SKEW
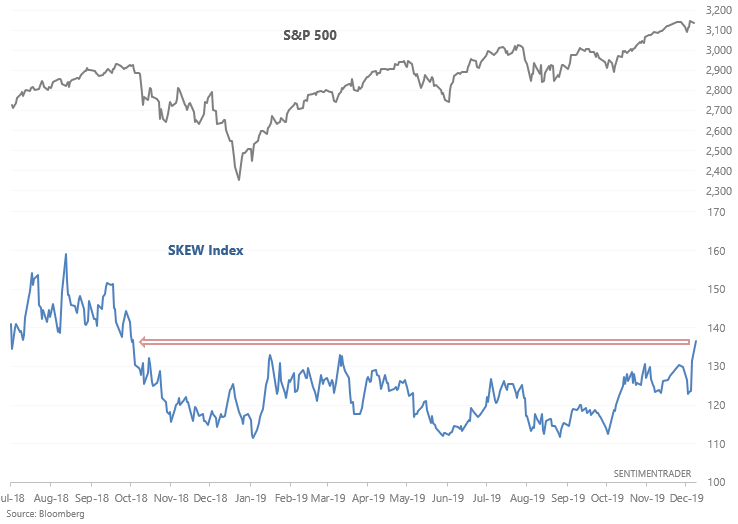
The SKEW Index, which looks at the risk of a black swan event in equities over the next 30 days, jumped to the highest level since October 2018:
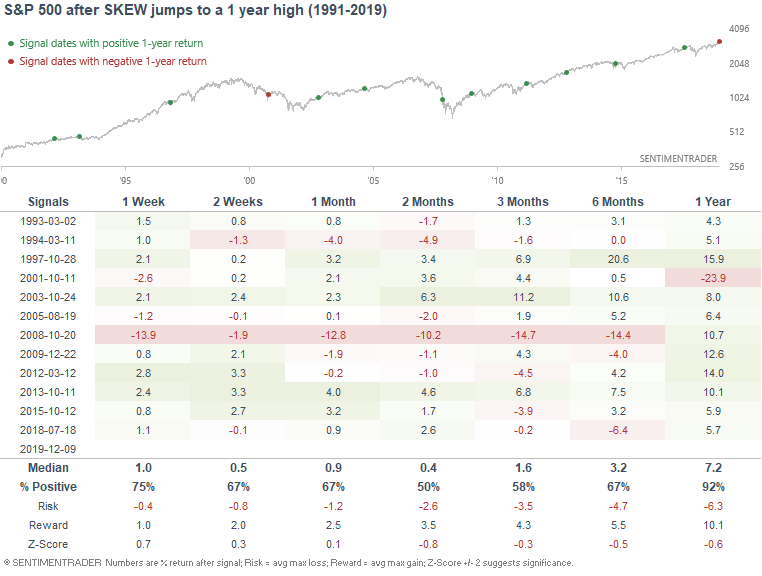
When this happened in the past, the S&P's returns over the next 2 months were worse than random, suggesting that it was better to hold bonds than stocks. In addition, returns over the next year were mostly bullish, with the exception of October 2001. That bearish case occurred in different environment from today: stocks were in a clear downtrend, and the economy was in a recession.
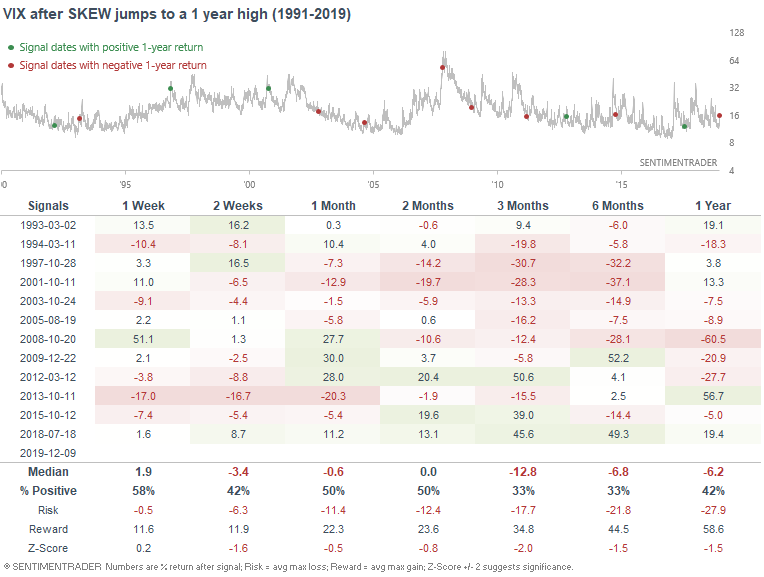
While this led to mixed results in stocks over the next 2-3 months, it wasn't a particularly bullish signal for VIX. If anything, VIX's returns over the next few weeks and months were more bearish than random:
Gold's momentum
I've looked at the stock market's momentum repeatedly in recent weeks, usually with the conclusion that it's bullish for U.S. equities over the next 6-12 months. But what about gold's momentum? As Bloomberg noted, gold has made an impressive rally this year, leading some traders to wonder if gold will continue to shine in 2020:
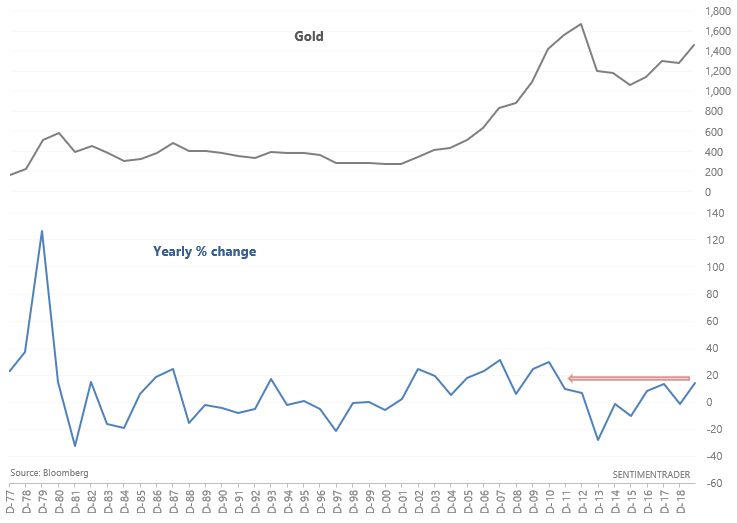
If we assume that gold retains its 14% year-to-date gains for the rest of this month, we can look at every case in which gold rallied more than 14% in a calendar year, and what it did next:
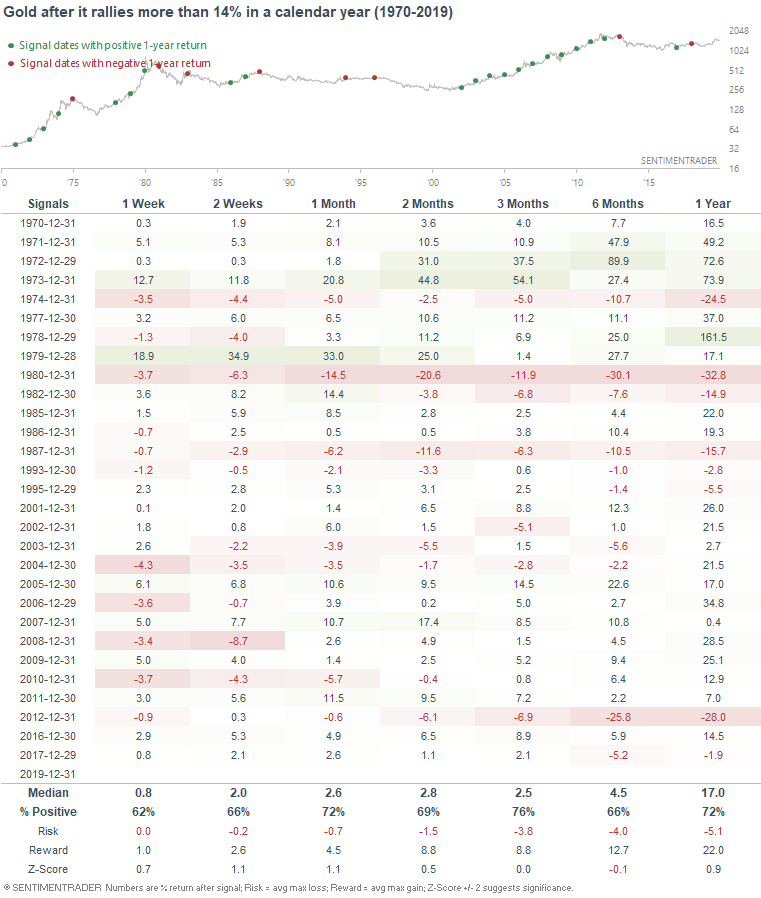
Although gold does have a tendency to rally over the next year, the momentum effect isn't as strong in gold as it is in U.S. equities.
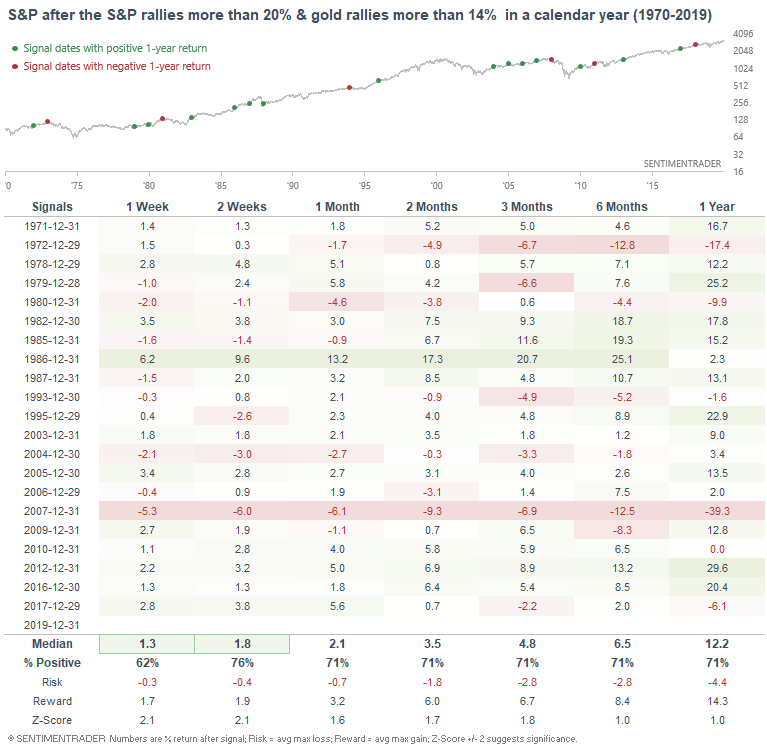
What if we look at cases in which gold rallied more than 14% in a calendar year, while stocks also rallied significantly?

...gold's forward returns were no different from random, while the S&P tends to rally in the first 2 weeks of January...
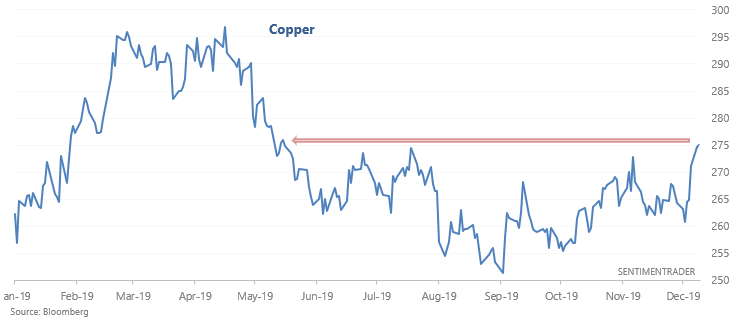
Copper's breakout
Copper has broken out to the highest level since May:
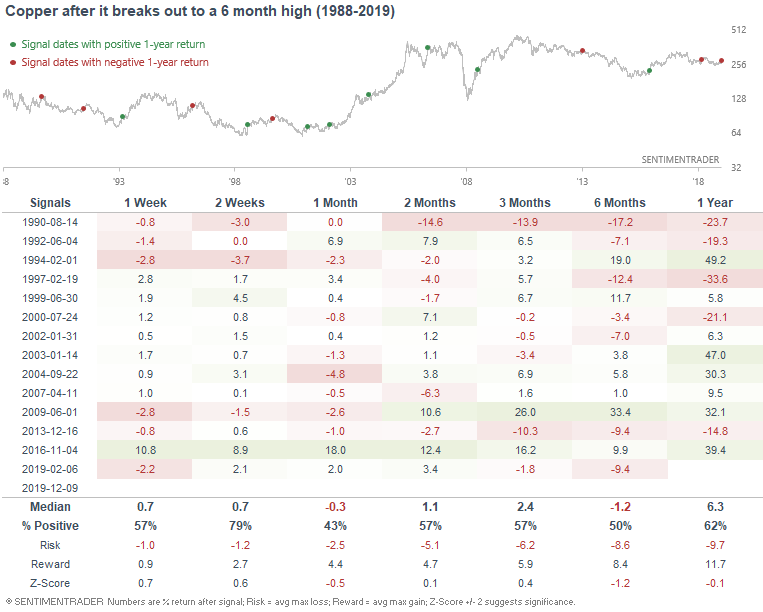
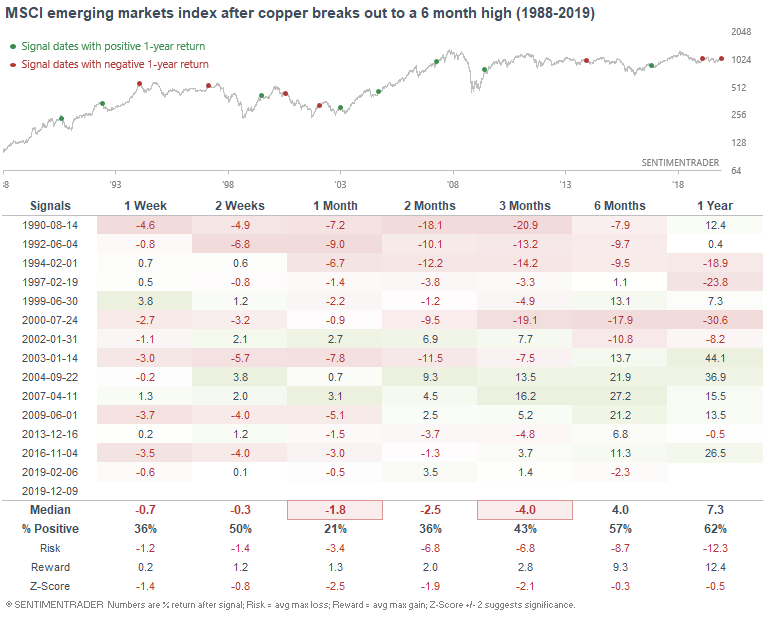
Some traders like to use copper as a gauge for the global economy, particularly for emerging markets. I've done various studies along these lines, usually with the conclusion that this connection is iffy. Moreover, breakout/breakdown patterns don't seem to work that well for commodities. The following table demonstrates what happened next to copper after it broke out to a 6 month high:
Meanwhile, the MSCI emerging markets index typically struggled over the next 1-3 months:
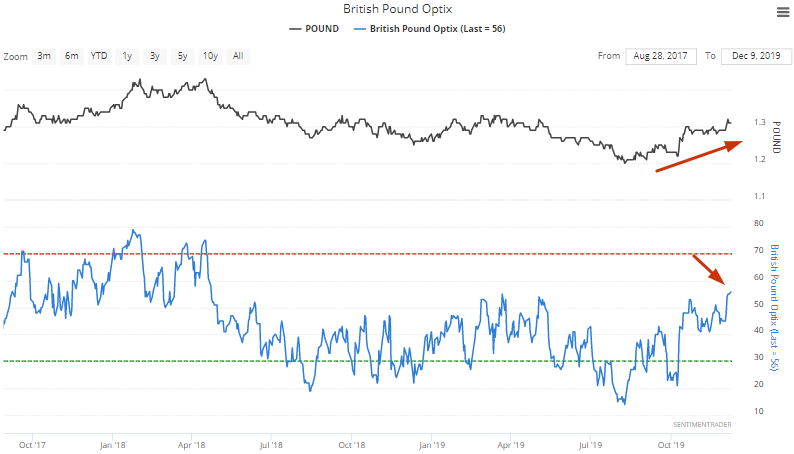
Pound
As the British Pound rallies into an election in which the Conservative Party is expected to win, the Pound's Optix has reached its highest level since April 2018:
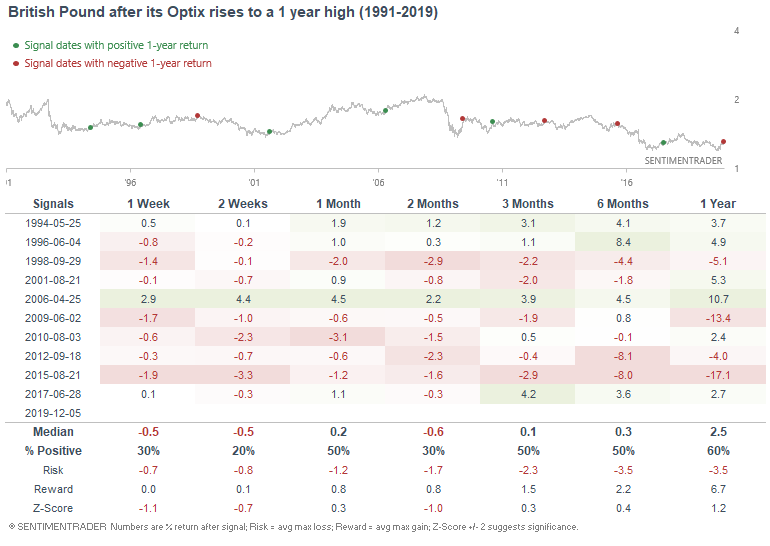
A resurgence in optimism towards the Pound hasn't been great for its forward returns, particularly over the next 2 weeks:
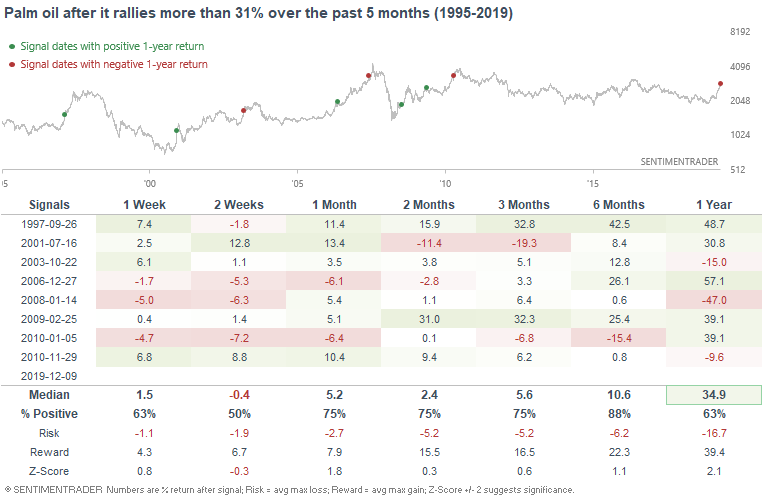
Palm oil
Palm oil prices are surging on fears of a sharp supply contraction. This has pushed its 5 month rate-of-change to the highest level since 2011, just as commodities peaked:
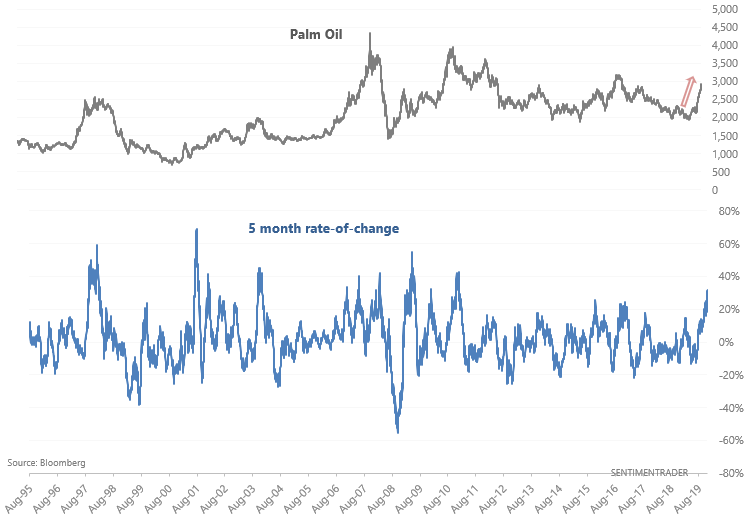
With that being said, such surges have typically led to more gains for this commodity over the next 6 months:
My trading portfolio
I've been moving countries and changing residencies over the past half year, so I haven't done much trading up until a month ago. Now that I've settled down, I've reopened trading accounts. In the interest of transparency, I'm going to show you what my own trading portfolio is doing, similar to what Jason does.
From October 25 (when I started to trade again) - present:
- My account is up 2.48%
- Currently 100% in bonds
I don't place discretionary trades - these are purely based on my quantitative models.