
What I'm looking at - sentiment, LEI, Hong Kong volatility, strong momentum, Mexico surge
Here's what I'm looking at:
Sentiment
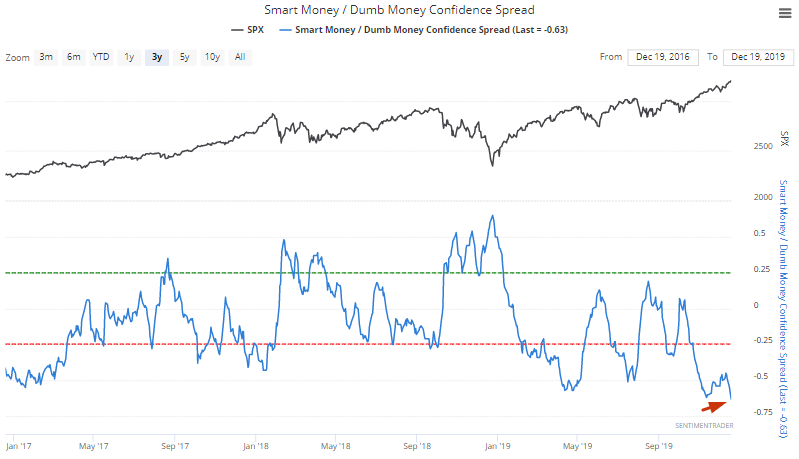
Sentiment for the major indices and various sectors remains extreme, which dampens our outlook for stocks in the short-medium term. The Smart Money/Dumb Money Confidence Spread continues to make multi-year new lows:
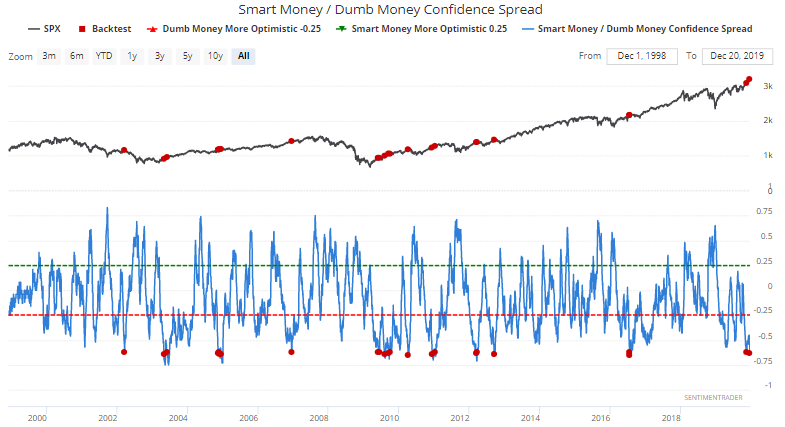
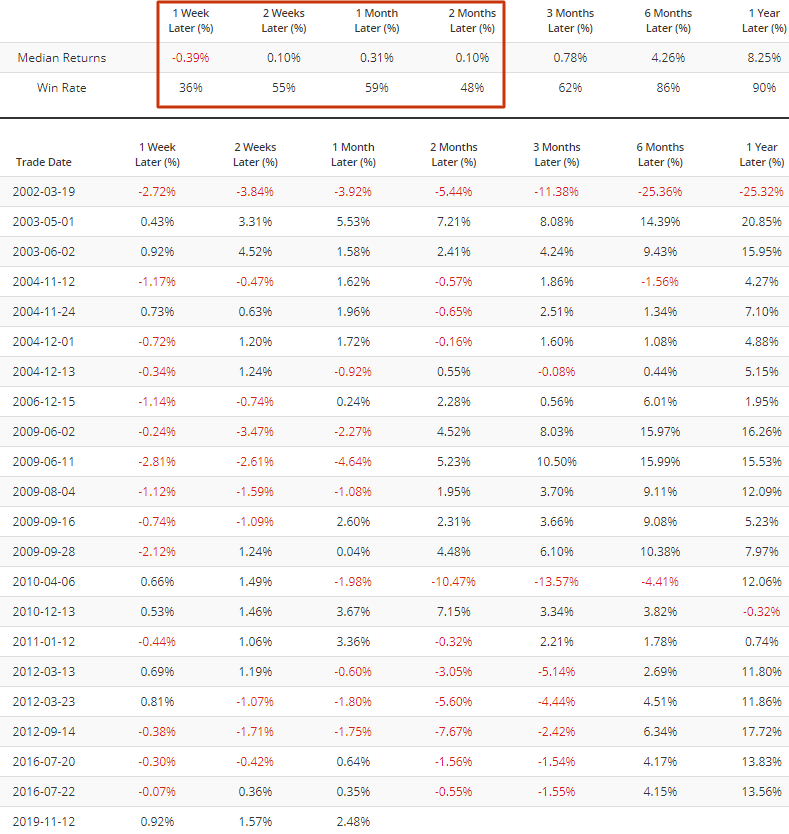
When this happened in the past, the S&P's returns over the next few weeks and months were worse than random:
Meanwhile, oil and gas producers' Optix's 10 dma has now exceeded 74:
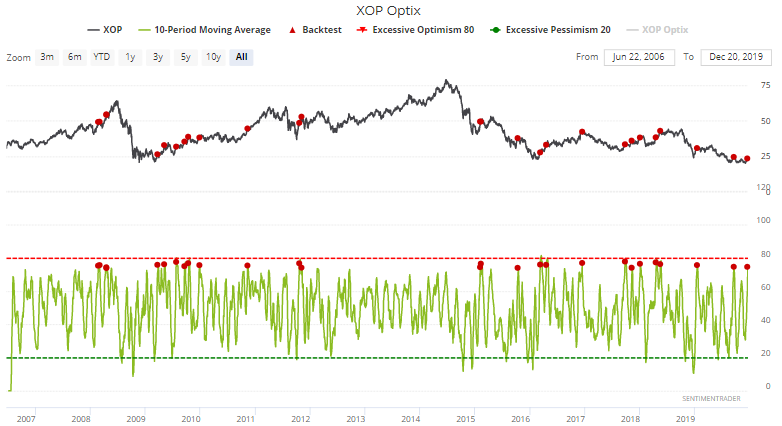
When this happened in the past, XOP performed extremely poorly over the next 2 weeks:
Conference Board LEI
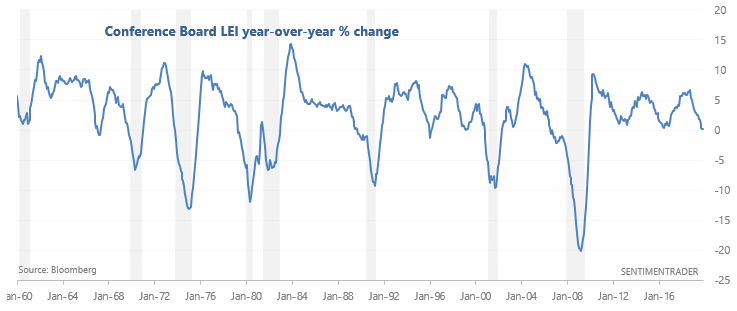
As plenty of market watchers have pointed out, the Conference Board LEI's year-over-year % change has fallen to 0.1%
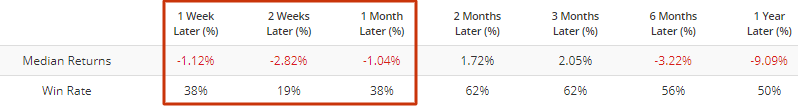
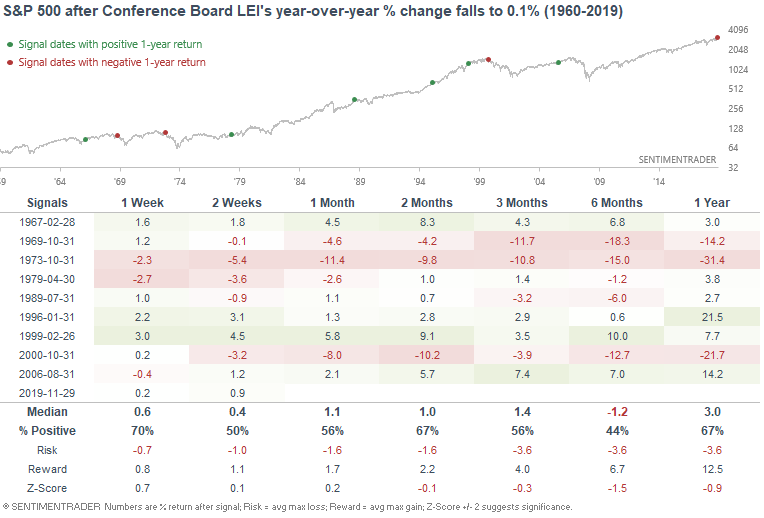
Historically, this often happened in or near recessions, which is why this was typically followed by weak returns in the S&P over the next 6 months:
With that being said, I don't believe the Conference Board LEI to be the best fundamental-driven model for market timing. The LEI is too exposed to manufacturing-related data, and manufacturing-related data aren't the best leading economic indicators. The best way to improve the LEI is to add an S&P trend following filter to filter out some of the false bearish signals. After all, there is no point arguing with price.
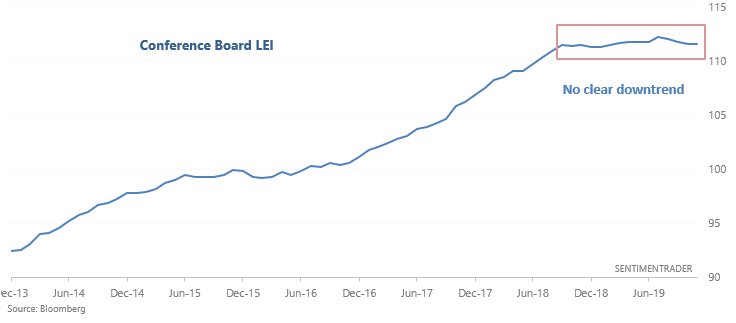
And lastly, there is the potential for the Conference Board LEI to rebound in the coming months should manufacturing-related data improve. While the LEI's year-over-year % change is coming down, the LEI itself is not trending down too strongly.
Hong Kong
As David Ingles pointed out, the Hang Seng Index's Volatility Index has dropped to a multi-year low:
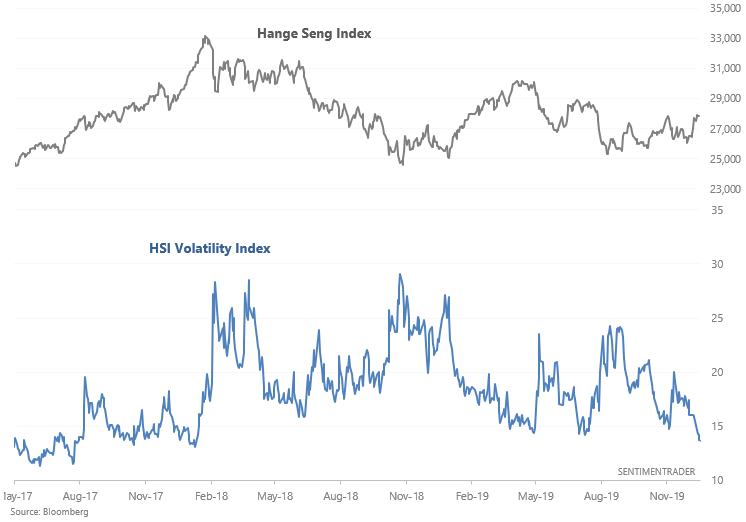
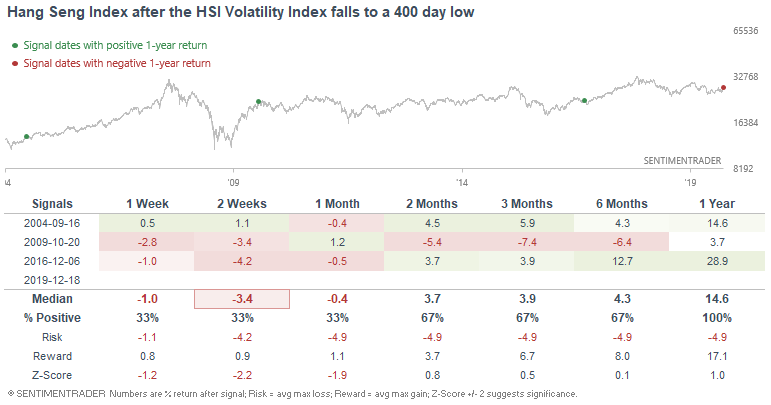
From 2004-present, there are only 3 comparable cases. Each of these 3 cases saw weak returns in the next few weeks, but typically occurred after a multi-year bottom in stocks. Hence why the Hang Seng's returns over the next year were bullish:
Strong upwards momentum
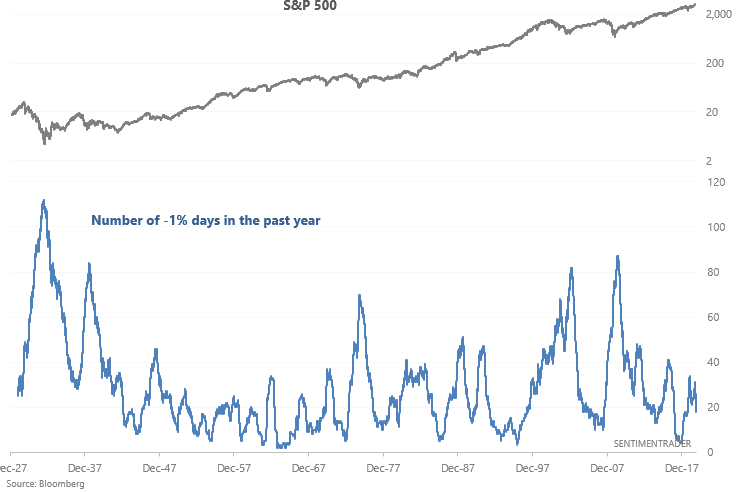
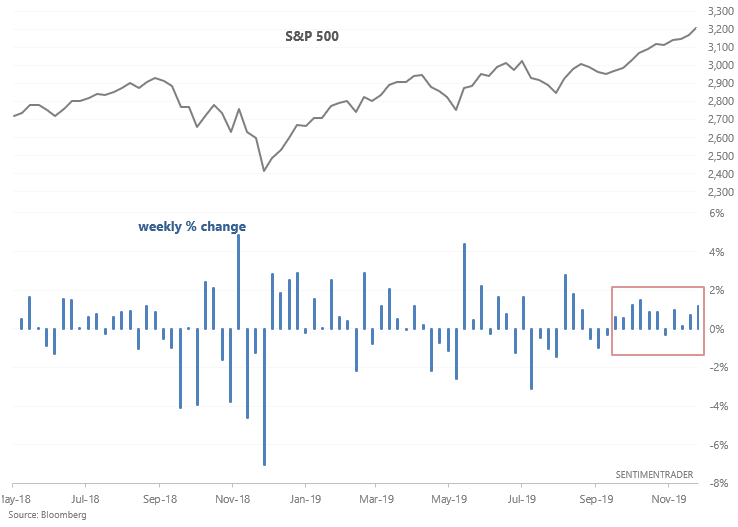
Stocks have surged this year with few pullbacks. There have only been 18 days with a -1% or greater daily drop in the past year (252 trading days). And as we approach the end of 2019, this figure will continue to drop as the stock market crash from December 2018 rolls off:
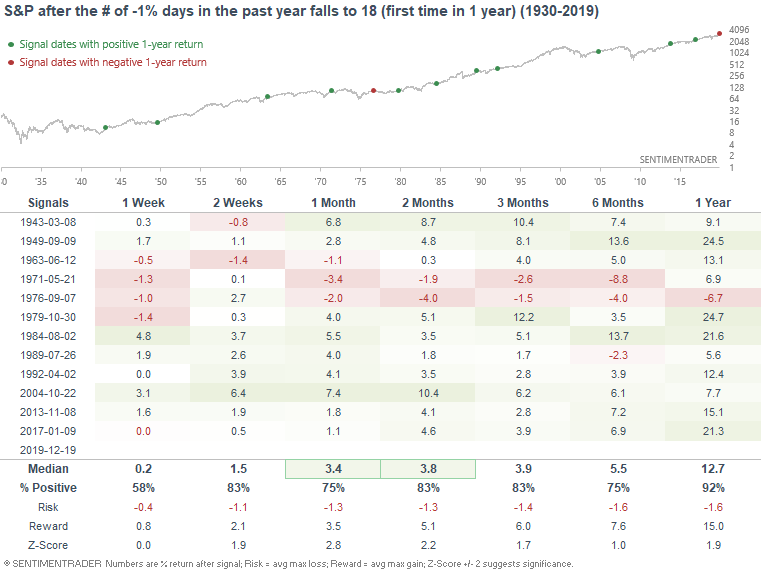
If we look at cases in which the number of -1% days in the past year falls to 18 for the first time in more than 1 year, the S&P's returns over the next year were almost always bullish. Low volatility may be a short term bearish factor for stocks, but it's usually a longer term bullish factor since the stock market doesn't usually peak when volatility is extremely low:
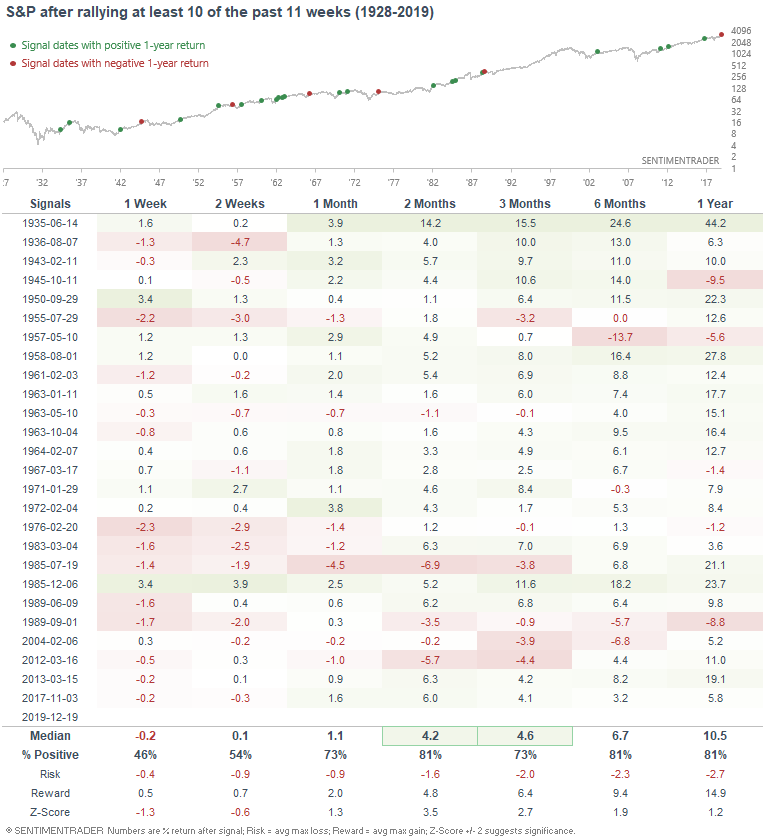
Absent a significant drop in the stock market today, the S&P will have rallied 10 of the past 11 weeks:
Such persistent rallies have usually been followed by weakness over the next 1-2 weeks, especially from 1980-present. And while the 2-3 months forward returns may seem bullish, many of those bullish cases occurred before the 1980s.
Overseas breadth
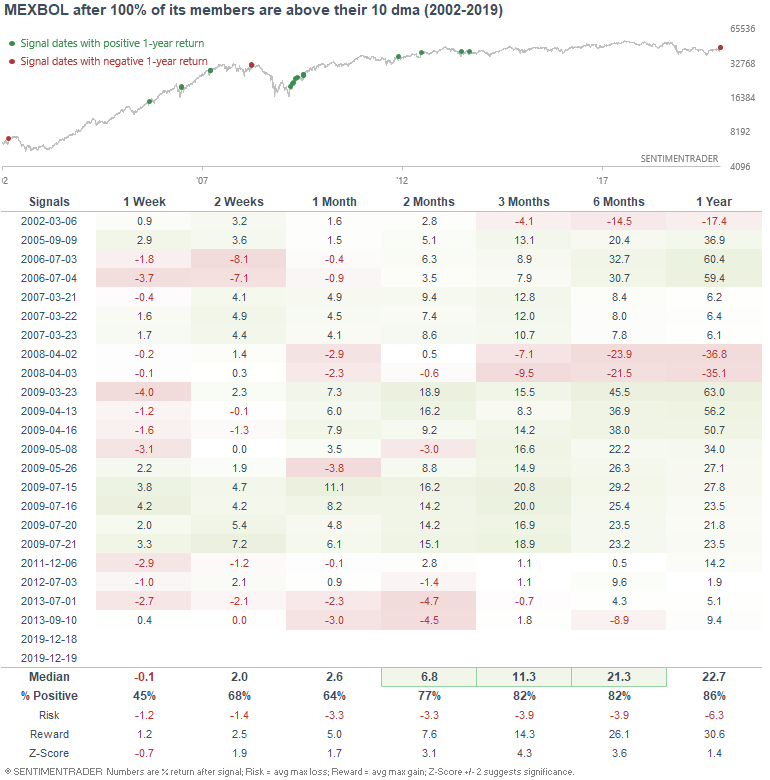
As overseas markets continue to trend higher, 100% of MEXBOL members are in a short term uptrend.
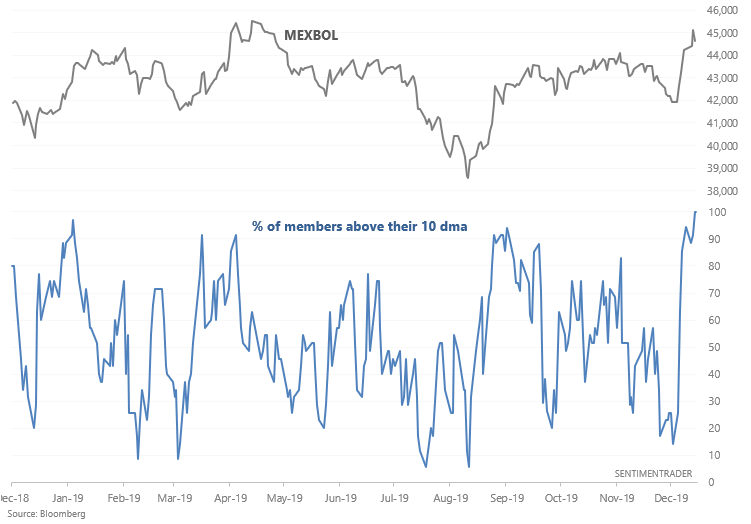
While this may be followed by a short term pullback in the MEXBOL over the next week, such breadth thrusts were typically followed by more gains over the next few months:
My trading portfolio
I've been moving countries and changing residencies over the past half year, so I haven't done much trading up until a month ago. Now that I've settled down, I've reopened trading accounts. In the interest of transparency, I'm going to show you what my own trading portfolio is doing, similar to what Jason does.
From October 25 (when I started to trade again) - present:
- My account is up 2.22%
- Currently 100% in bonds
I don't place discretionary trades - these are purely based on my quantitative models.