Products
SentimenTrader Trading Tools
‍
Backtest Engine
My Trading Toolkit
Correlation Analysis
Seasonality
Market Prediction
Indicators & Data API
‍
Proprietary Indicators & Charts
Market Data API
Strategies & Scanner
‍
50+ Trading Strategies
Smart Stock Scanner
Smart Option Scanner
Research Reports
‍
Research Solutions
Reports Library
Free Resources
Simple Backtest Calculator
Simple Seasonality Calculator
The Kelly Criterion Calculator
Sentiment Geo Map
Public Research Reports
Education
Sentiment Indicators
Technical Indicators
Pricing
Company
About
In the News
Testimonials
Client Success Stories
Contact
Log inLoginSign up
< BACK TO ALL REPORTS

What I'm looking at - rush into defensives, more extremes, travel, China

Troy Bombardia
2020-03-18
The stock market's daily volatility has been unrelenting of late. Meanwhile, investors and traders jumped headlong into defensive sectors.

Here's what I'm looking at:


Rush into defensives

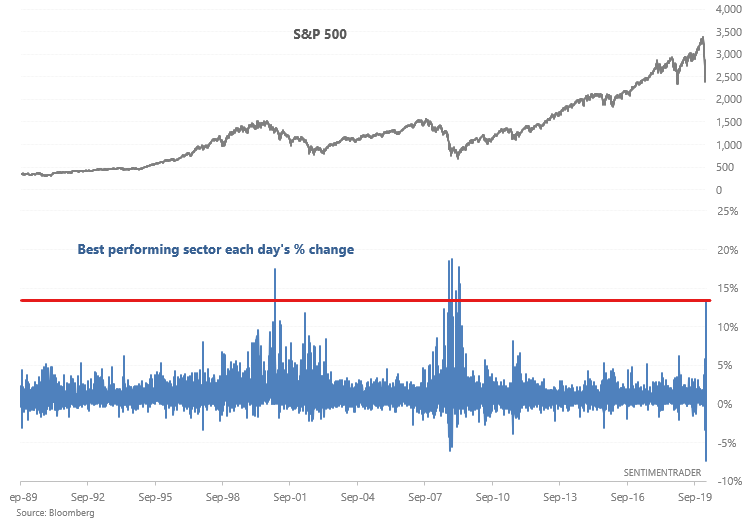
Defensive sectors like utilities don't usually offer much protection when everything is crashing. While utilities may fall less, they will still crash with the overall market. However, defensive sectors often outperform AFTER a crash, when the market is very volatile and is trying to put in a bottom. 

The S&P 500 utilities sector gained more than 13% on Tuesday, making it the best performing sector on Tuesday (if we exclude the real estate sector, whose data is limited). From 1989-present, there has been no other day in which the utilities sector was the strongest sector that day and rallied more than 13%.

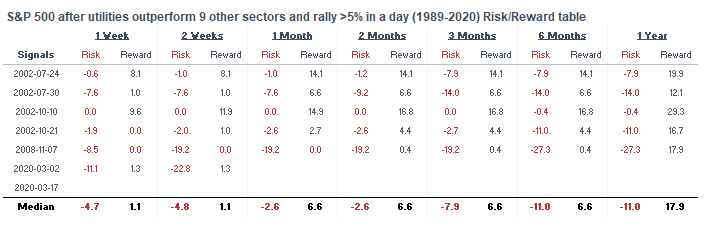
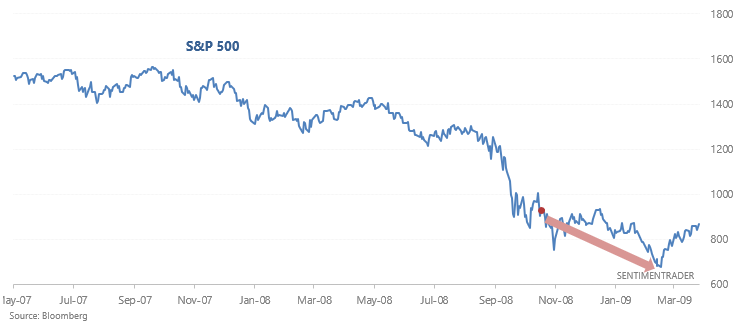
We'll need to relax the parameters to find historical cases. If we look for days in which utilities outperformed 9 other sectors and rallied more than 5% that day, all the cases occurred after the worst of the previous 2 bear markets as the stock market tried to put in a major bottom. 

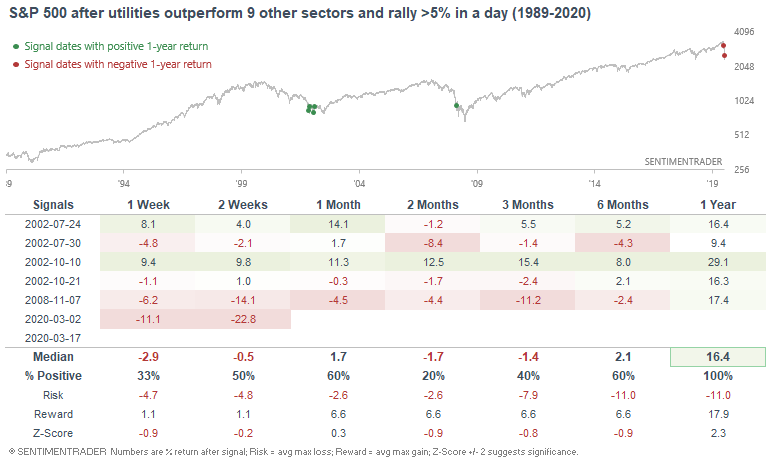
While the S&P surged over the next year, it usually experienced a lot of volatility in the short-medium term.

In the 2002 case, the S&P 500 swung sideways for months before soaring.

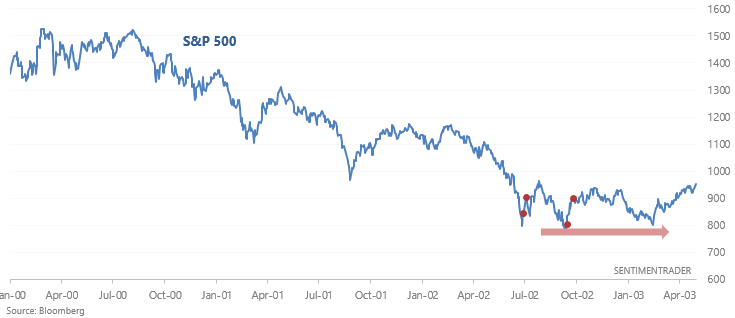
In the 2008 case, the S&P 500 made a marginal new low before it surged in 2009.


More extremes

Plunging confidence in stocks has pushed the 20 day average of our Stock/Bond ratio below -2.73, one of the lowest levels over the past 50+ years. It doesn't get much more extreme than this - even 2008 wasn't this bad. The most recent case came just after the S&P 500's bottom in December 2018, and the most memorable case was after the October 1987 crash.

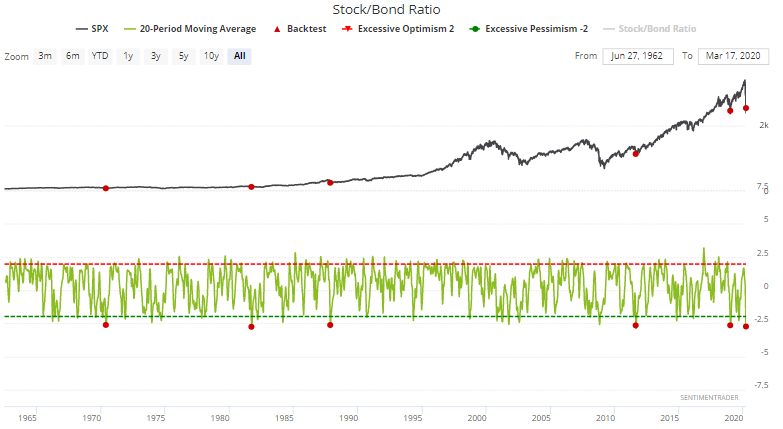
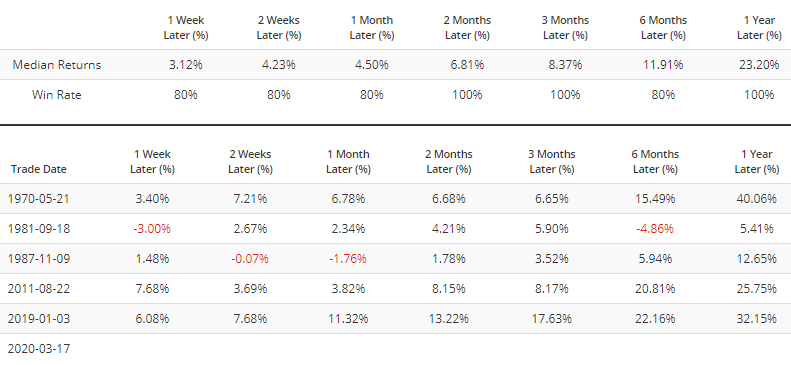
All 5 historical cases saw the S&P rally over the next 2-3 months.


Travel

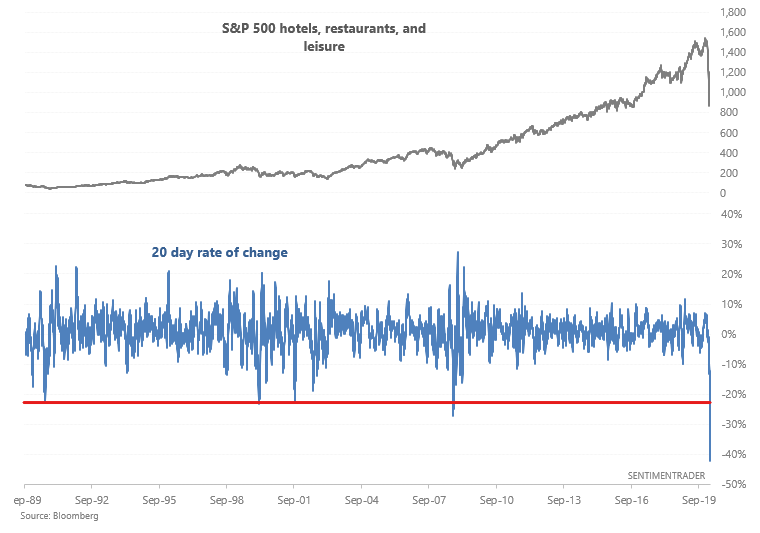
It's clear that things aren't good for people in the travel and tourism industry. The coronavirus pandemic has hurt the industry significantly, and many businesses are in a cash crunch (see WSJ here and here). With bankruptcy fears mounting, the S&P 500 hotels, restaurants, and leisure sector has plunged more than -40% over the past 20 days. To call this a "crash" would be an understatement.

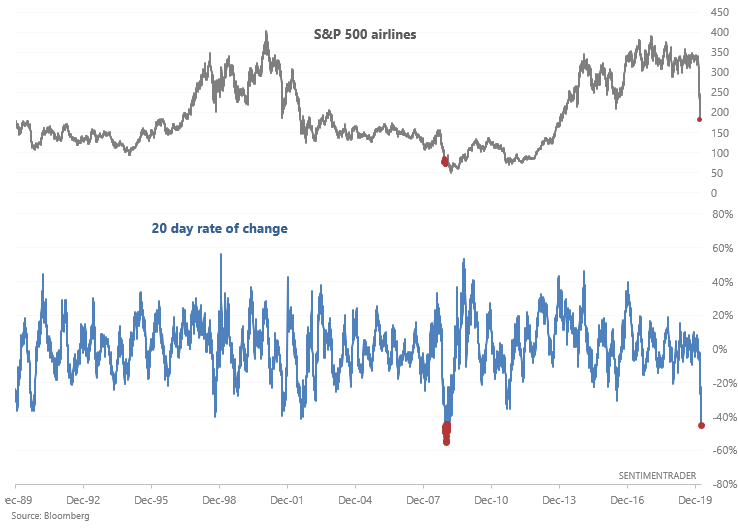
Airlines aren't faring much better. The S&P 500 airlines sector's 20 day rate of change is also among the lowest in history, matched only by that of 2008. Back then, the airlines sector fell a little more before bottoming.


China

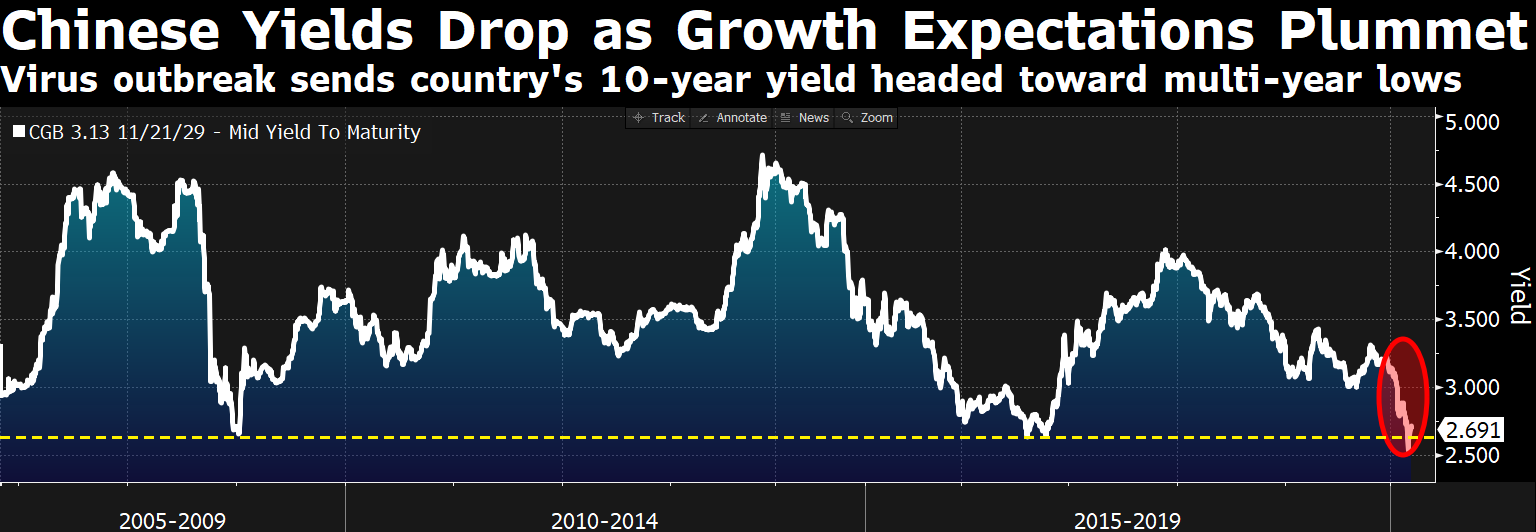
And finally, Bloomberg noted that the Chinese 10 year yield has fallen to a level which in the past, was a bullish sign for Chinese equities (and moreso bullish for global equities, since Chinese equities haven't moved much in years).

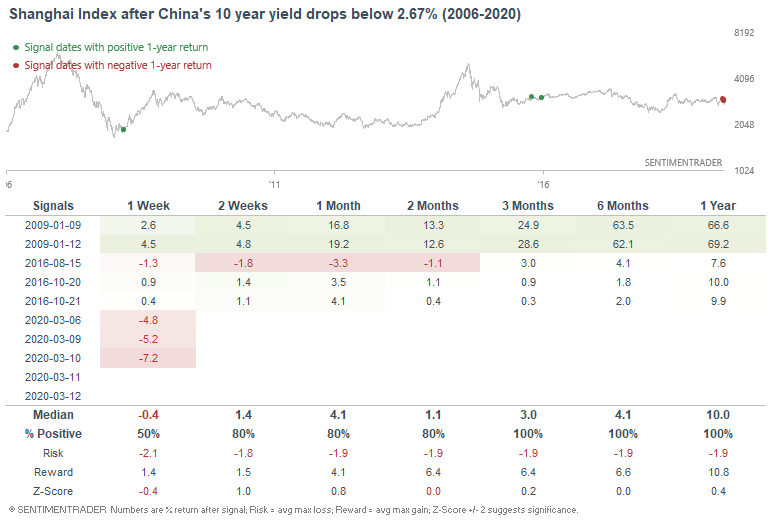
This happened after the global financial meltdown of 2008 and China's economic slowdown of 2015-2016. In both cases global equities recovered over the next year.

PRODUCTS
SentimenTrader
Trading Tools
Indicators & Data API
‍
Strategies & Scanner
‍
Research Reports
FREE
RESOUrCES
Simple Backtest
Calculator
Simple Seasonality
Calculator
The Kelly Criterion
Calculator
Sentiment Geo Map
‍
Public Research Reports
‍
Education
Sentiment Indicators
‍
Technical Indicators
‍
Pricing
Bundle pricing
‍
FAQ
‍
Announcements
‍
COMPANY
‍
About
‍
In the News
‍
Testimonials
‍
Client Success Stories
CONTACT
‍
General Inquiries
‍
Media Inquiries
‍
Financial Professionals Inquiries
‍
© 2026 Sundial Capital Research Inc. All rights reserved.
Setsail Marketing
TermsPrivacyAffiliate Program
Risk Disclosure: The information and tools provided are for research and analytical purposes only and are not intended as investment advice. Market analysis involves uncertainty, and outcomes may differ from expectations. Users should conduct their own due diligence and consider their individual circumstances before making any financial decisions. Past performance is not necessarily indicative of future results.

Hypothetical Performance Disclosure: Hypothetical performance results have many inherent limitations, some of which are described below. No representation is being made that any account will or is likely to achieve profits or losses similar to those shown; in fact, there are frequently sharp differences between hypothetical performance results and the actual results subsequently achieved by any particular trading program. One of the limitations of hypothetical performance results is that they are generally prepared with the benefit of hindsight. In addition, hypothetical trading does not involve financial risk, and no hypothetical trading record can completely account for the impact of financial risk of actual trading. for example, the ability to withstand losses or to adhere to a particular trading program in spite of trading losses are material points which can also adversely affect actual trading results. There are numerous other factors related to the markets in general or to the implementation of any specific trading program which cannot be fully accounted for in the preparation of hypothetical performance results and all which can adversely affect trading results.

Testimonial Disclosure: Testimonials appearing on this website may not be representative of other clients or customers and is not a guarantee of future performance or success.