What I'm looking at - optix & sentiment, ex-U.S., bond market rally, airlines
Here’s what I’m looking at:
Optix & sentiment
The stock market's wild intraday swings are normal. Very rarely does the market crash and then make a V-shaped recovery. Short term sentiment readings are fluctuating with these daily price movements, but when we apply a 10 day moving average to various sentiment readings, sentiment remains extremely low.
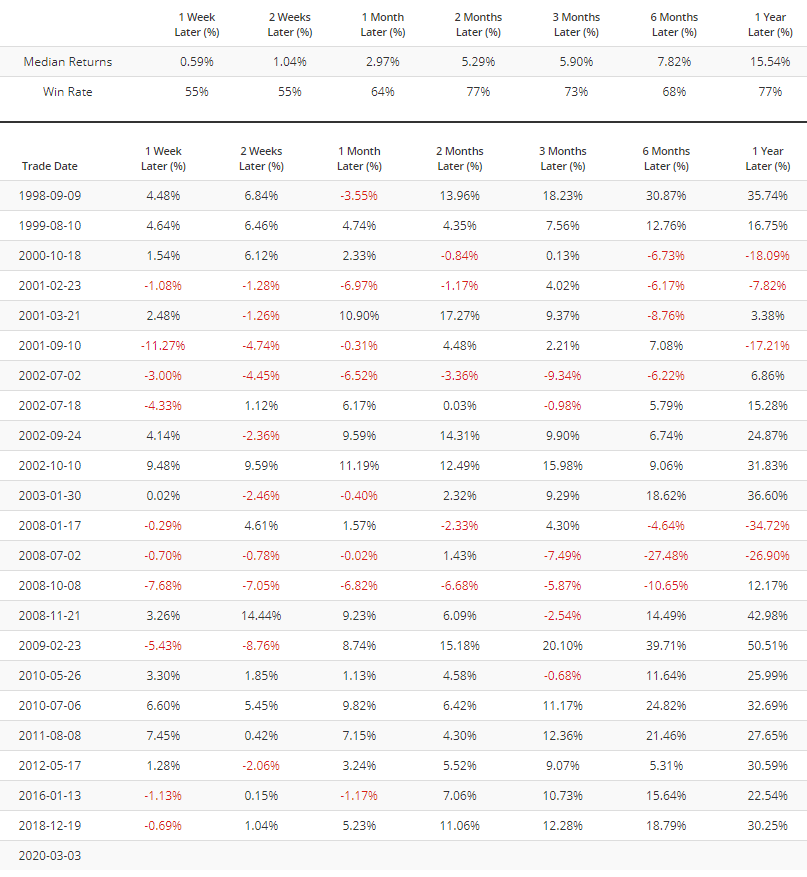
For example, SPY Optix's 10 dma has fallen below 21:
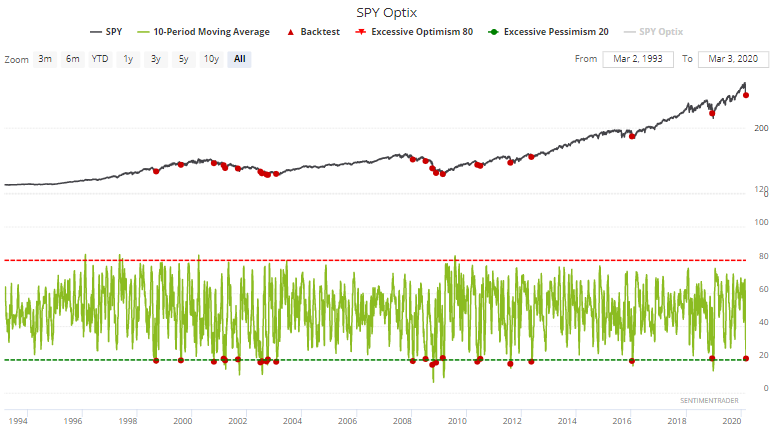
Excluding overlapping signals, this was mostly bullish for the S&P 500 2 months later, with a median gain of +5.29%:
Likewise, investors and traders are extremely pessimistic towards Consumer Staples, with XLP Optix's 10 dma below 23:
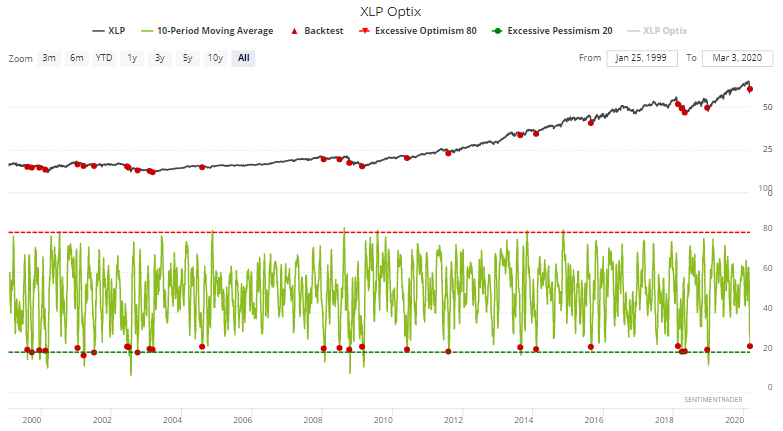
Once again, this led to better than expected returns for XLP over the next 2-4 weeks:
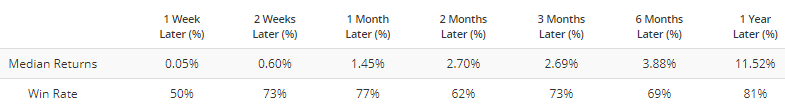
For the financial sector, XLF Optix's 10 dma has fallen below 21:
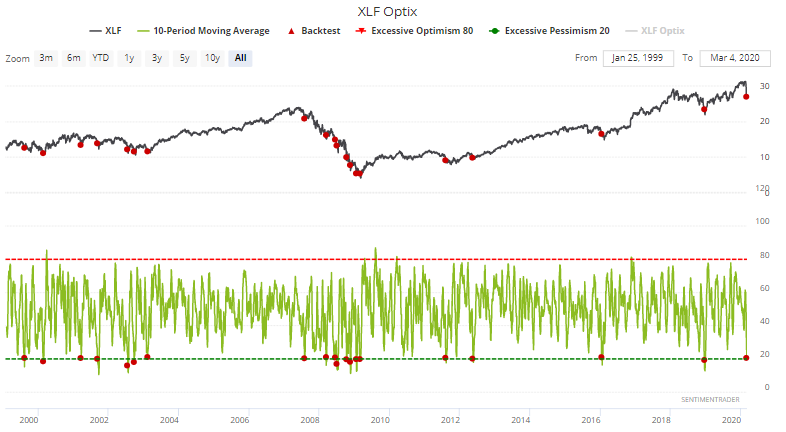
XLF's 2-3 month forward returns were more bullish than random, with most of the failures occurring during the 2007-2009 global meltdown. To be clear, I do not think coronavirus will be as severe as the 2008 financial crisis in terms of its impact on the stock market:
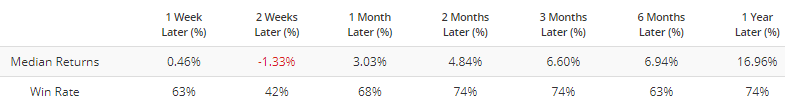
For industrials, XLI Optix's 10 dma has fallen below 18:
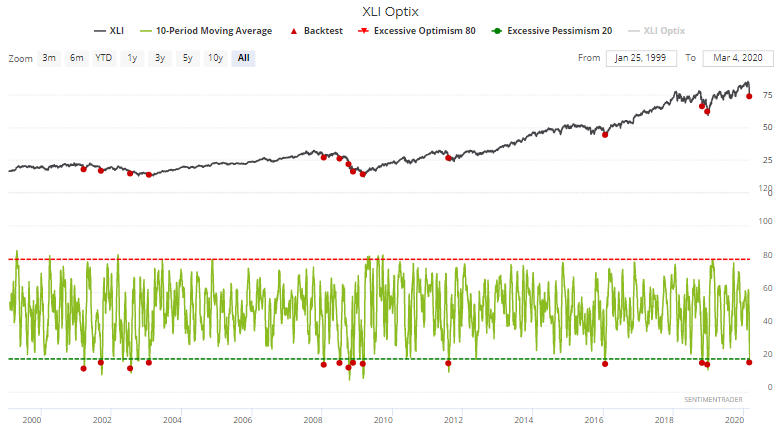
Once again, this was mostly bullish for XLI 1-2 months later:
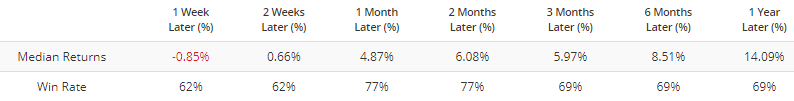
For healthcare, XLV Optix's 10 dma has fallen below 21:
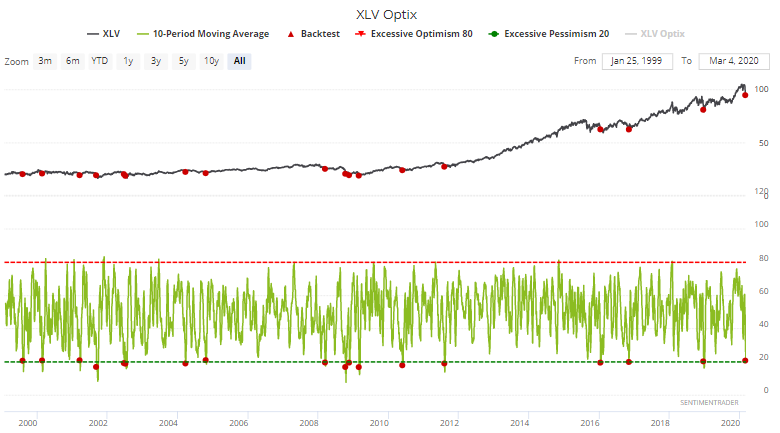
In the past, this usually led to a rally for XLV over the next 1-3 months:
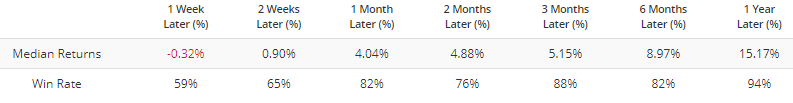
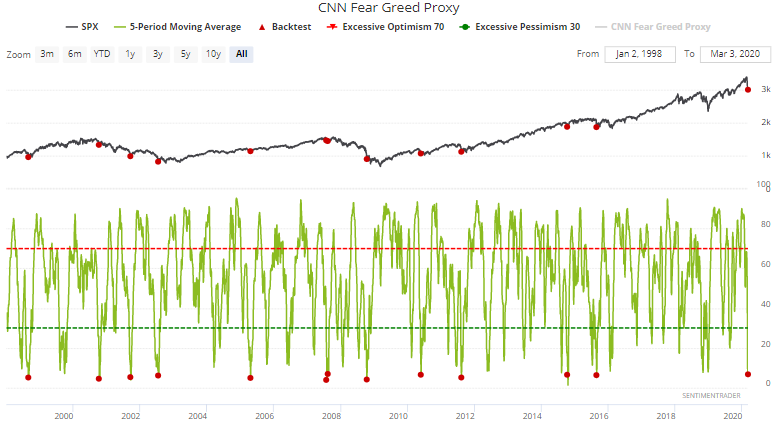
And finally, a 5 day average of our proxy for the popular CNN Fear/Greed Index is EXTREMELY low. This always led to a rally for the S&P 500 over the next few weeks, even during the worst of the 2008 crisis and the 2000-2002 bear market:
ex-U.S.
Jason and I have covered the U.S. stock market's crash in depth over the past week. Let's take a look at sentiment and breadth outside of the U.S. (more on this later in the week).
Like the rest of the world, Australian equities collapsed last week. (Whether this is "due to" corona-virus is besides the point).
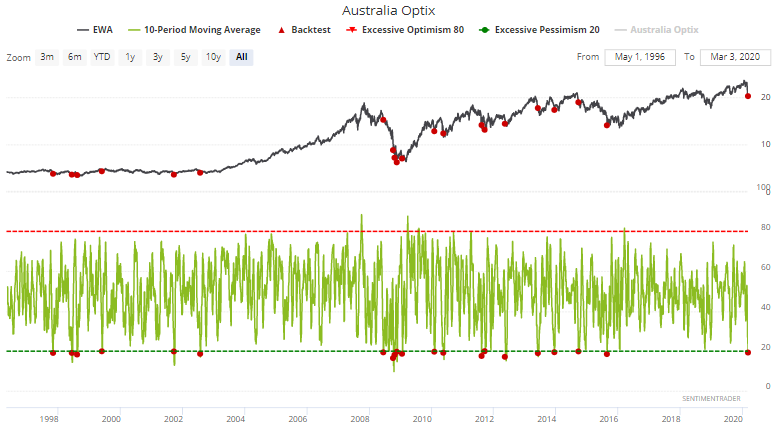
When a 10 day average of Australia's Optix was this low in the past, EWA (Australia ETF) had a strong tendency to rally over the next month.

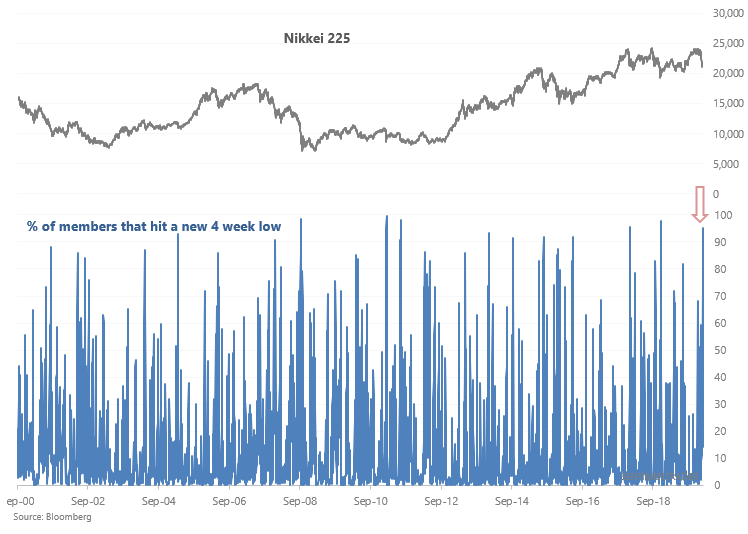
Meanwhile, 95% of the Nikkei's members crashed to a 4 week new low:
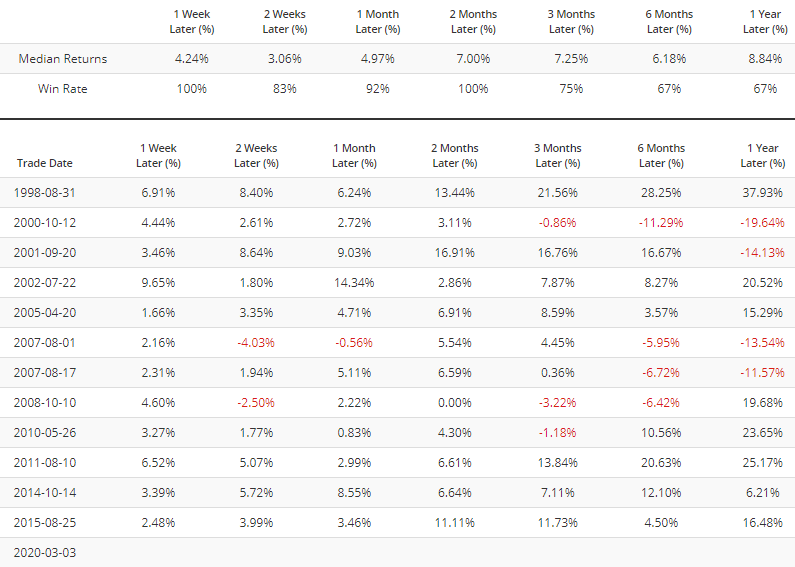
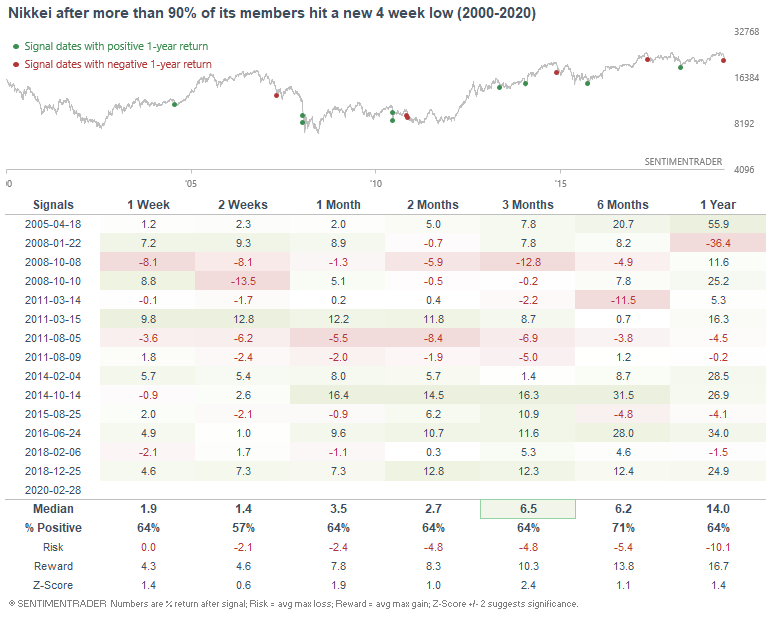
When so many Japanese stocks sold off together, the Nikkei's returns over the next 3 months were more bullish than random:
Bonds
Investors and traders continue to scramble like mad towards bonds as equity markets remain extremely volatile. A 10 day average of TLT Optix is among the highest in history:
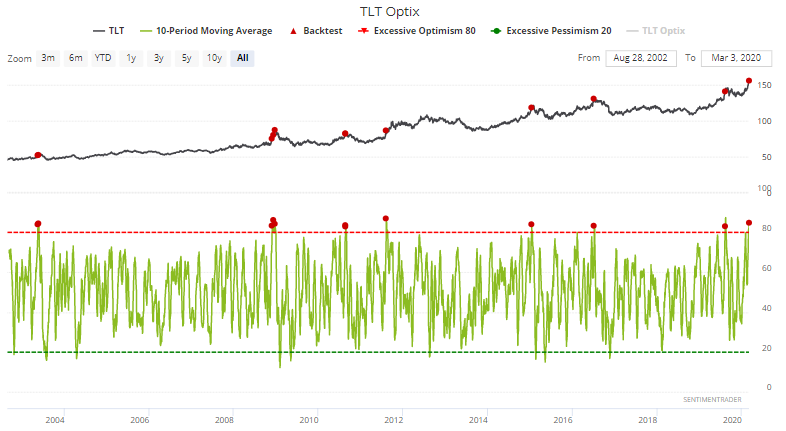
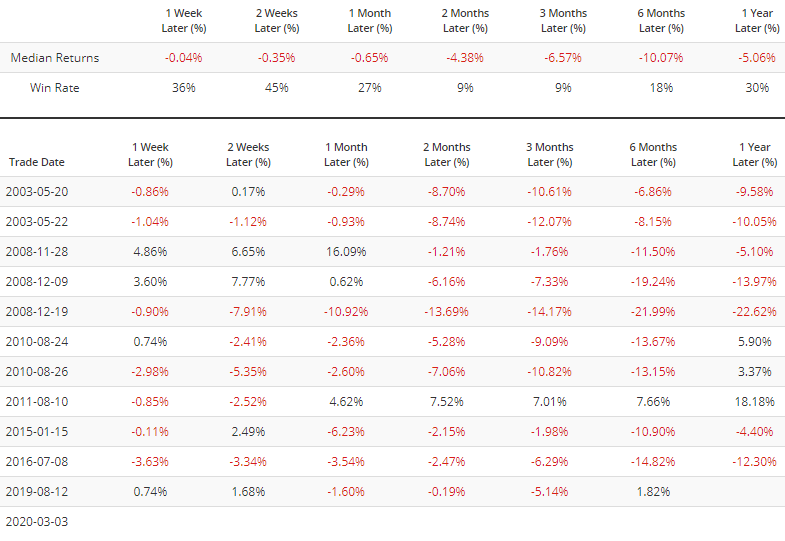
When market participants were this optimistic towards bonds, TLT almost always suffered over the next 2 months:
Airlines
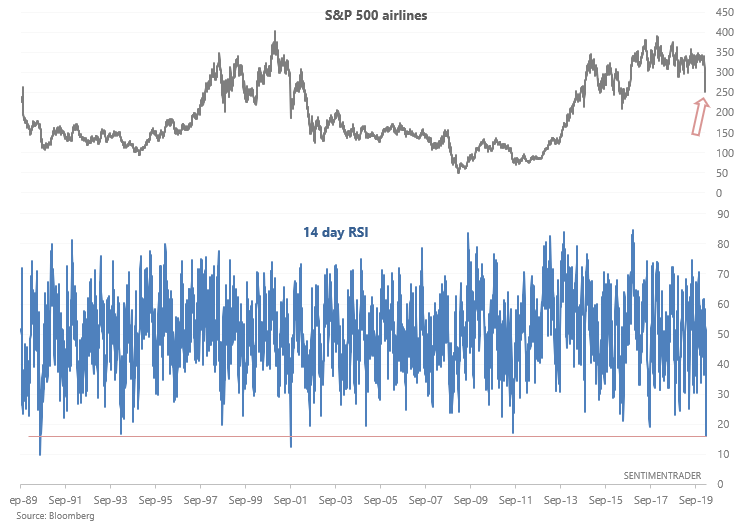
And lastly, the S&P 500 airlines sector has been crushed by recent coronavirus fears. A lot of travellers have cancelled flight plans for fear of contagion (or worse, being quarantined at the airport for just having a fever). The airlines sector's 14 day RSI is among the lowest ever, only matched by 9/11 and the 1990 Iraq invasion of Kuwait:
Here's what the S&P 500 airlines sector did during similar historical cases:
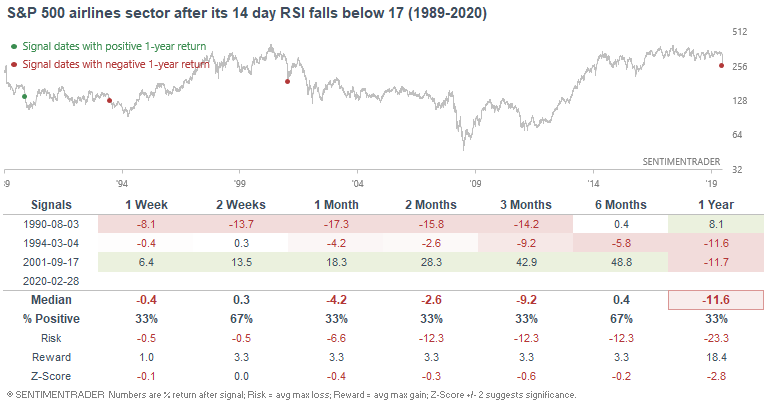
*Sample size is low, so take this with a grain of salt.
How I allocate my assets
Instead of sharing how I manage my own trading portfolio, here's how I allocate all my assets for the sake of full transparency. Some of these percentages are approximate, particularly for private assets (since private assets don't have a value on a day to day basis).
- 40% emerging market real estate.
- 20% trading portfolio. My trading portfolio is allocated 50% in the Macro Index Model and 50% in the Simple Trading Model With Fundamentals. Right now I am 25% long stocks and 75% long bonds
- 20% is a buy and hold position for the S&P 500 which I won't sell unless I see better opportunities in private markets. This IS NOT a trading position - here I care about the earnings yield. I expect this portion of the portfolio to see weak returns over the next 5-10 years given that valuations are high (and hence earnings yields are low).
- 20% in short term Treasury bond ETFs. This is a temporary placeholder. When opportunities arise I will sell these cash-like instruments to fund private market investments.
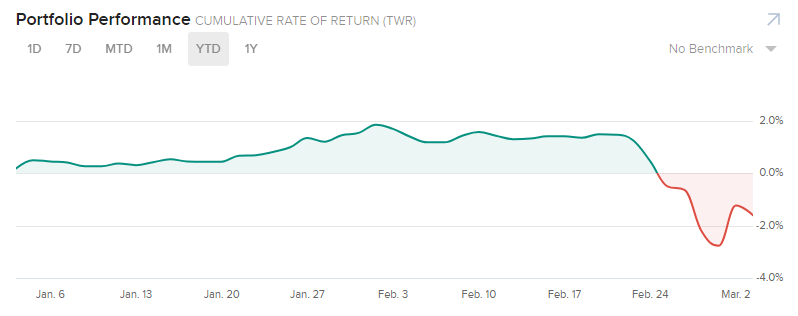
YTD 2020 performance for my public markets portfolio (trading portfolio, buy and hold position, temporary placeholder):
-1.61%