What I'm looking at - ISM, Hindenburg Omen, oil, semiconductors, China
Here's what I'm looking at:
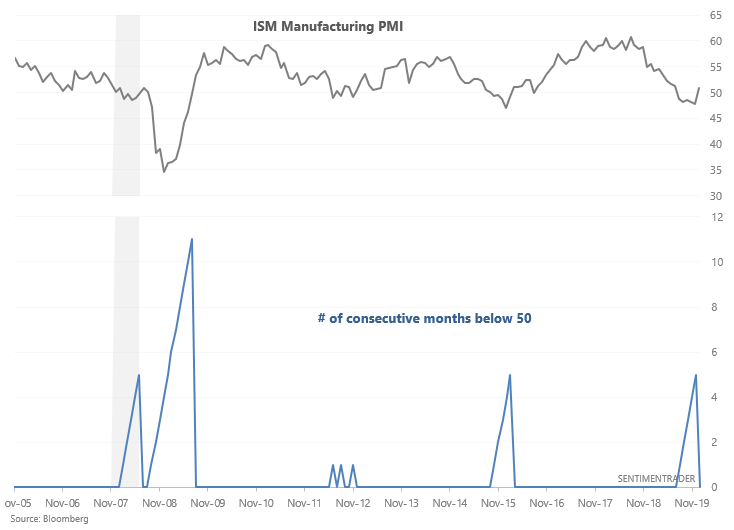
ISM Manufacturing PMI
Bears focused heavily on manufacturing data over the past few months to support their case, often citing the weak ISM manufacturing PMI. But for the first time in 5 months, the ISM manufacturing PMI is above 50 (i.e. no longer in contraction).
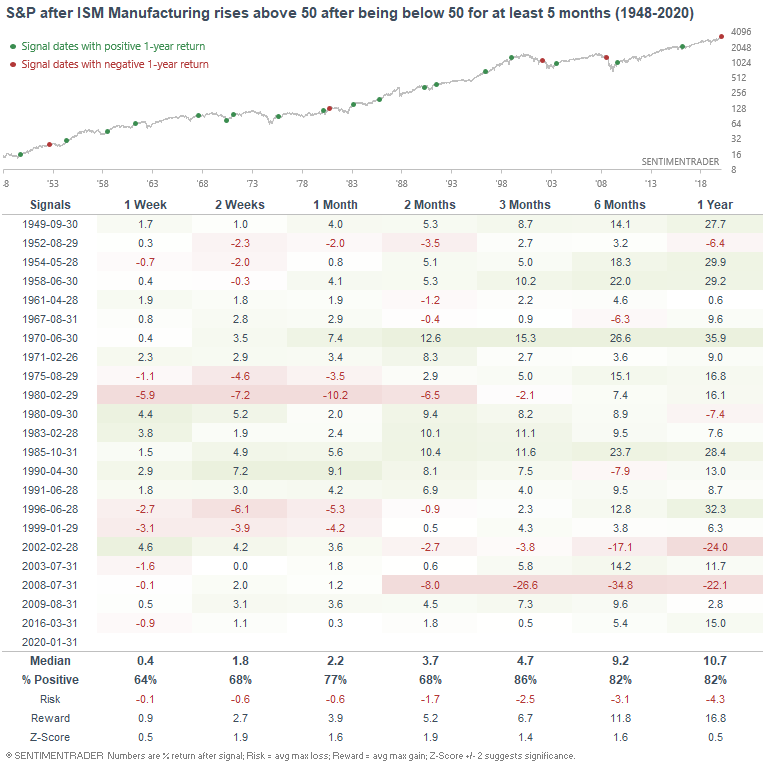
When the ISM Manufacturing PMI rose above 50 for the first time in at least 5 months, the S&P's 3-12 month forward returns leaned bullish:
Most of the bearish cases, particularly the major bearish cases (see 2002 and 2008) occurred when the stock market was significantly below its all-time highs. So if we isolate for the cases in which the S&P was within 10% of a 1 year high...
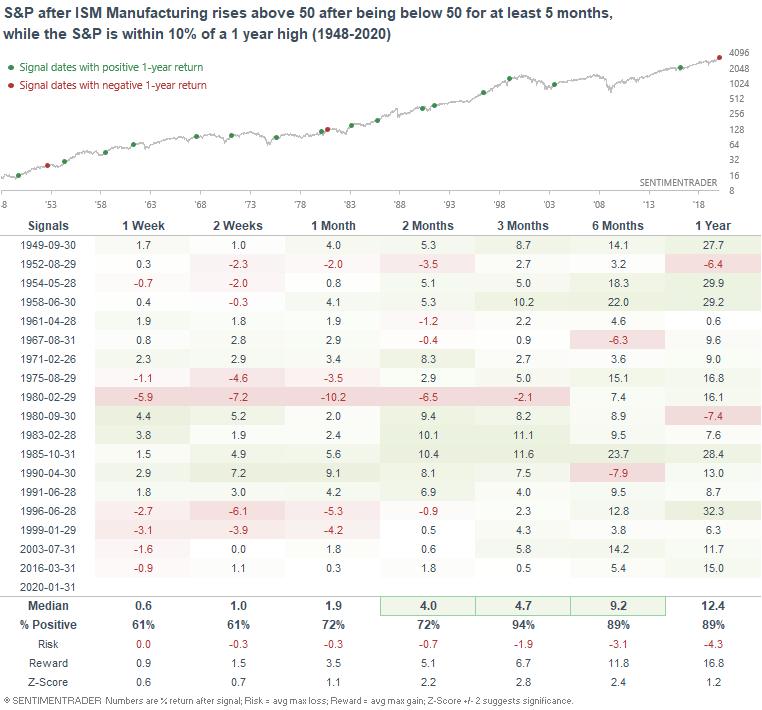
The S&P's 3-12 month forward returns become more bullish. Overall, there is no significant U.S. economic deterioration right now.
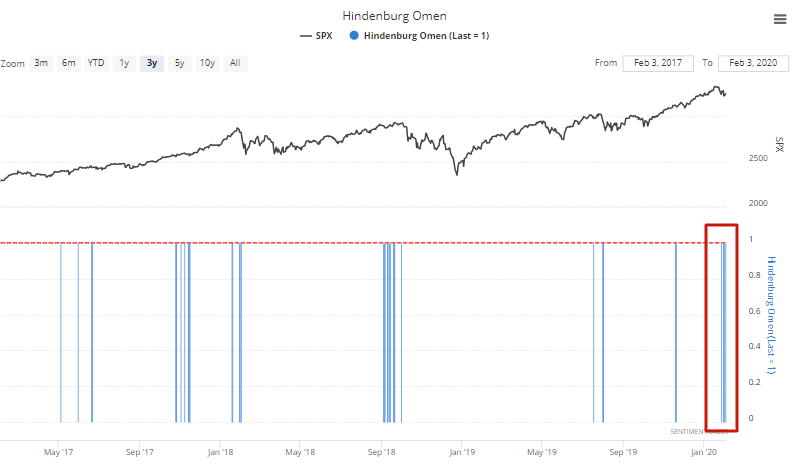
Clusters of Hindenburg Omen signals
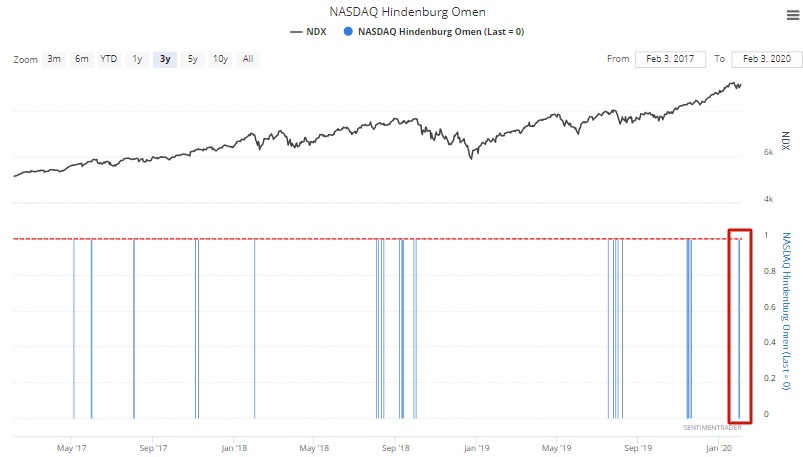
Jason and I have looked at the Hindenburg Omen in recent weeks. While these signals failed last November, thusfar they have been accurate. 4 Hindenburg Omen signals have been triggered on the NYSE and 2 Hindenburg Omen signals have been triggered on the NASDAQ:
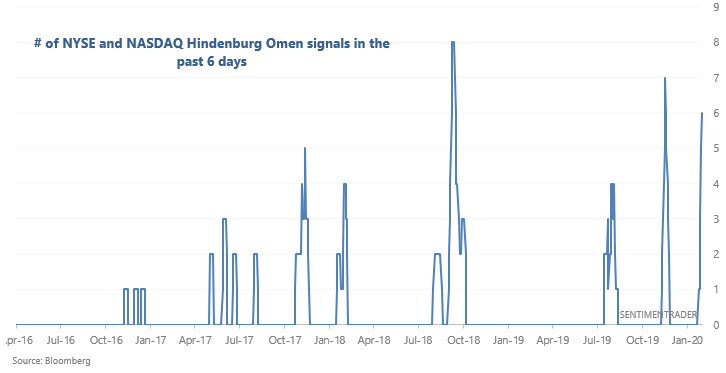
Let's combine the # of signals on both exchanges:
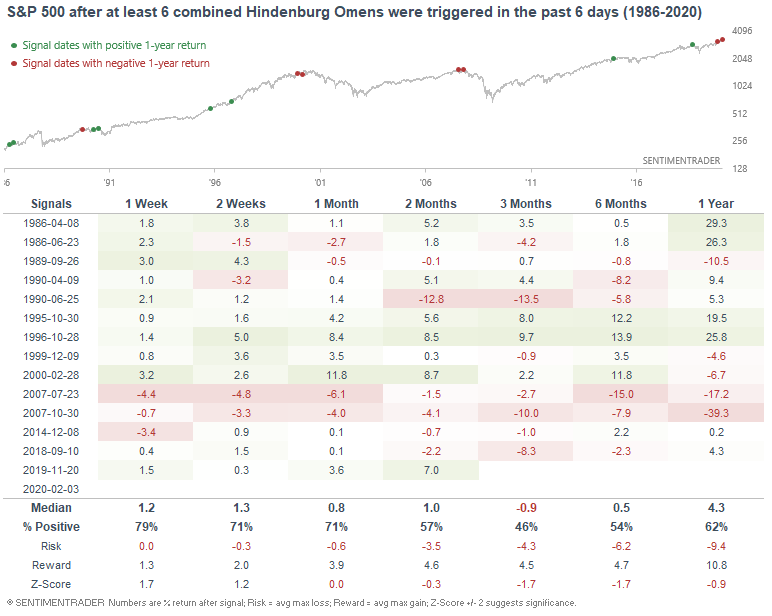
The following table illustrates what happened next to the S&P 500 when at least 6 combined Hindenburg Omen signals were triggered in the past 6 days:
Here's what happened next to the NASDAQ Composite:
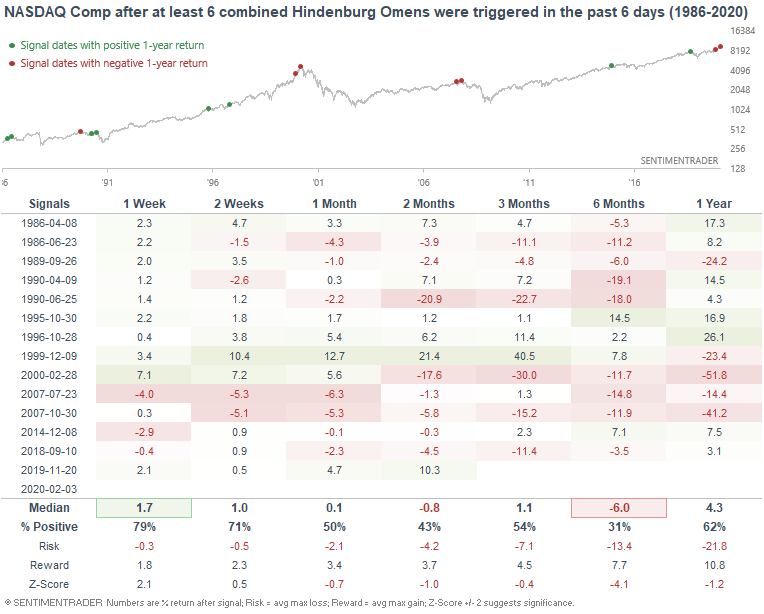
Overall, this is a short term bearish factor for U.S. equities over the next few months.
Oil crushed
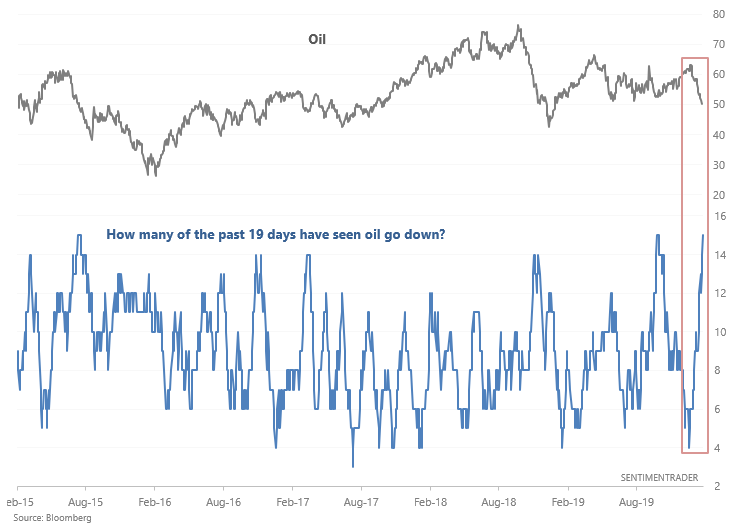
Coronavirus fears have crushed commodities: copper is down a record number of days in a row, the CRB Index has fallen -10% of the past 20 sessions, and oil has fallen 15 of the past 19 days:
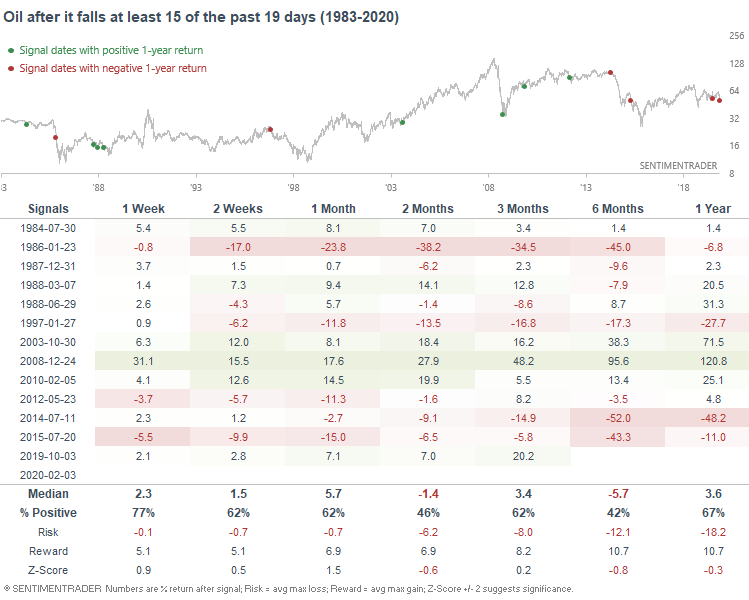
All of these "crazy selling" extremes would lead one to think that commodities are overdue for a bounce. While a bounce is indeed "inevitable" (things are always inevitable if you wait long enough), the important question is "when". When oil fell at least 15 of the past 19 days, its forward returns were not consistently bullish:
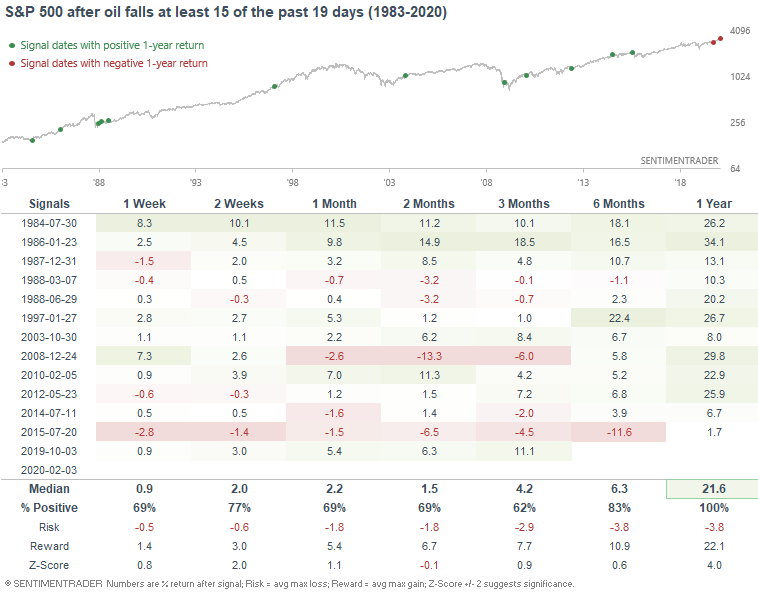
On the positive side, this was quite bullish for the U.S. stock market over the next year, since intense selling in commodities often occurs with global economic fears:
Semiconductors
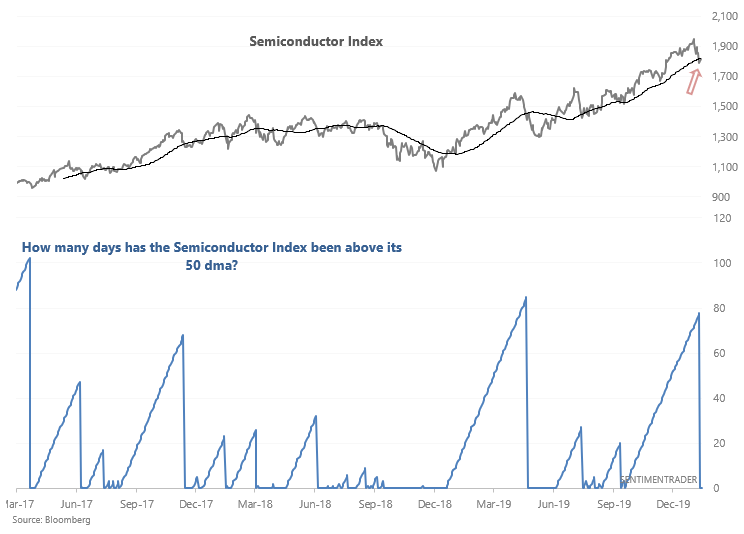
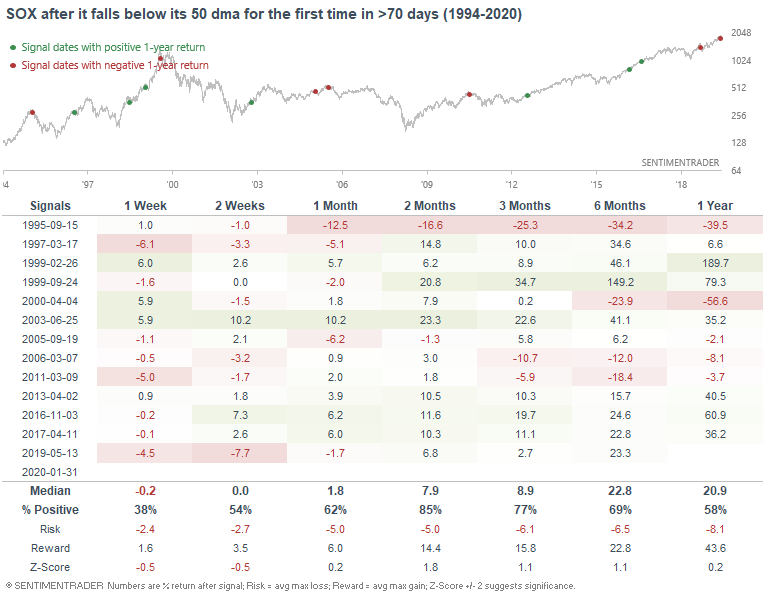
The Semiconductor Index is taking a break after leading the stock market's rally over the past half year. It has fallen below its 50 dma for the first time in >70 days (i.e. a pause after strong momentum).
When the Semiconductor Index witnessed a long streak of strong momentum and then made a pullback, it had a strong tendency to rally more over the next 2 months:
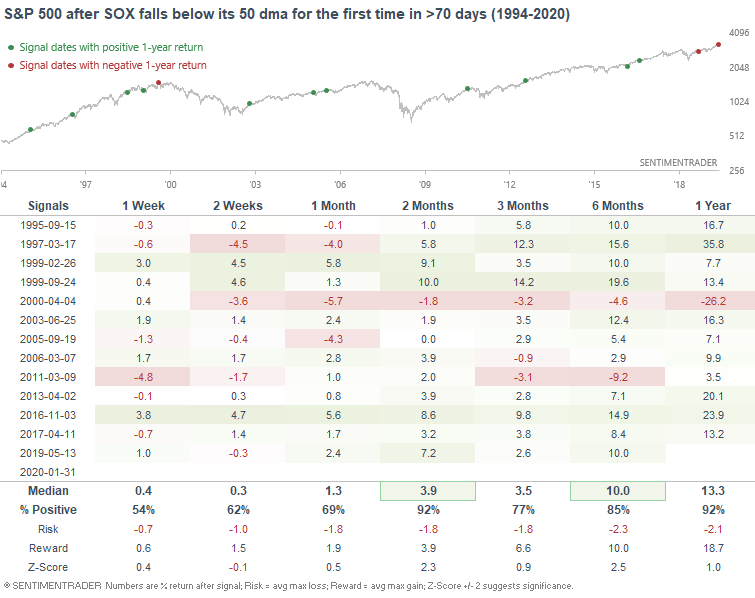
As did the S&P 500...
Chinese selloff
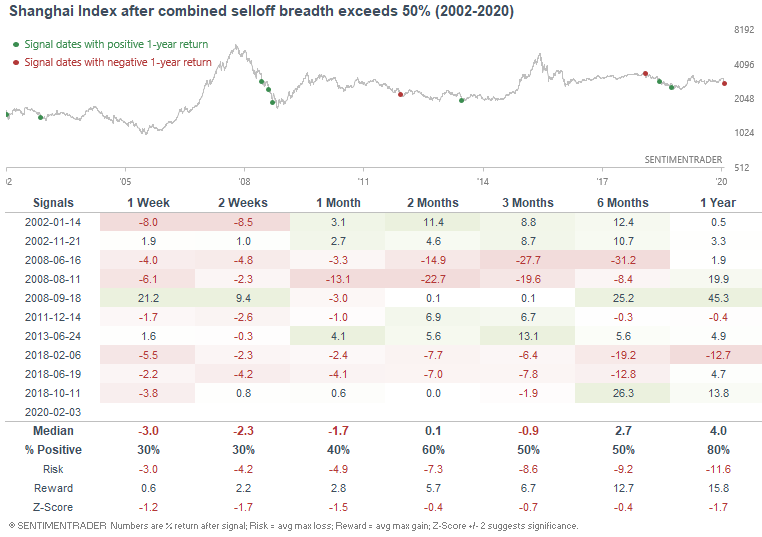
And finally, yesterday's selloff in Chinese equities was extreme (which was to be expected, given all the negative news). Here's an aggregate chart which combines the "% of members below their lower Bollinger Bands", the "% of members with RSI < 30", and the "% of members at new 52 week lows". As I said, quite extreme:
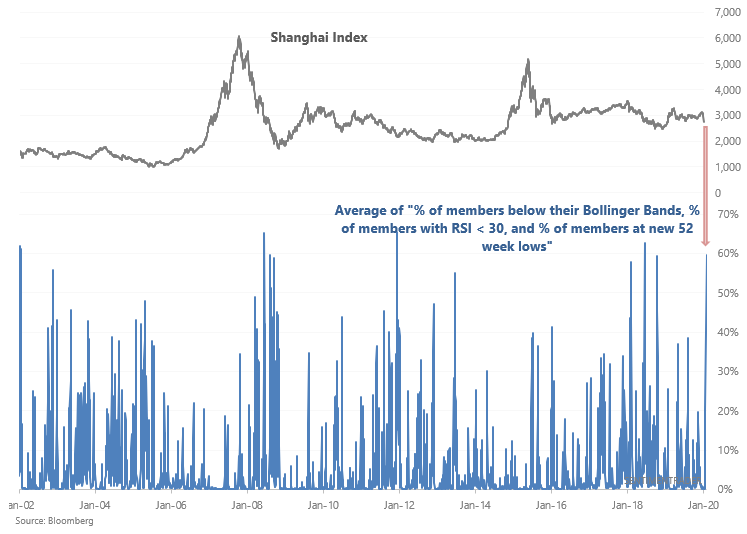
When the selling this was intense in the past, the Shanghai Index usually faced more weakness in the weeks and months ahead:
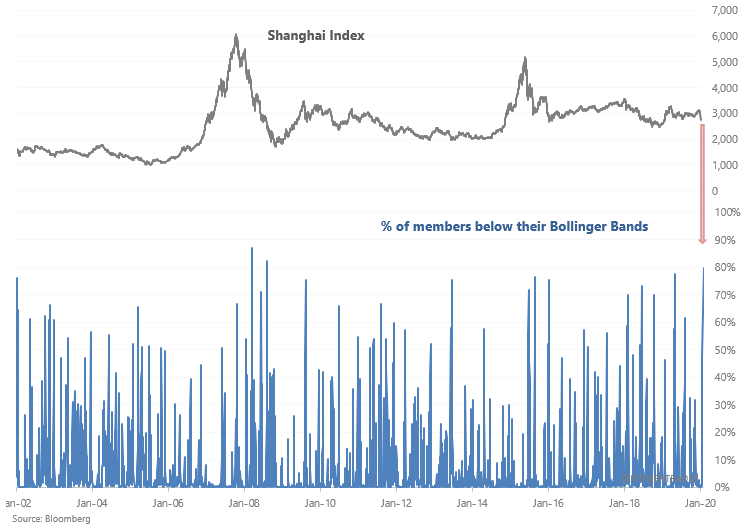
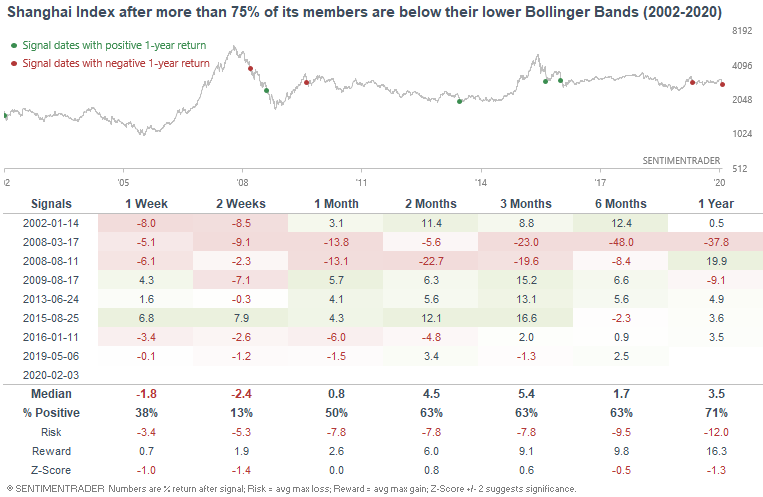
Of these 3 breadth indicators, the most extreme is the "% of members below their lower Bollinger Bands". Such extreme selling (by this measure at least) has only been witnessed 2 other times from 2002-present:
Once again, such extreme selling has not been good for the Shanghai Index over the next few weeks/months:
My trading portfolio
My trading portfolio is allocated 50% in the Macro Index Model and 50% in the Simple Trading Model With Fundamentals. At the moment I have instituted a discretionary override and gone 100% long bonds (instead of long stocks) due to the extreme nature of many of our core indicators, even though some of these core indicators aren't in the models.
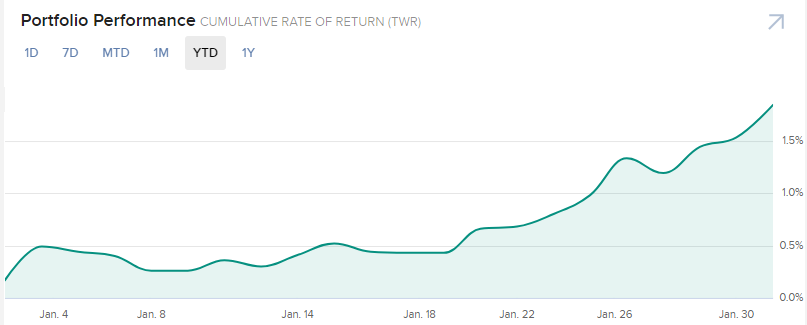
Performance YTD 2020:
- My trading account is up 1.84%
- Currently 100% in bonds