What I'm looking at - housing starts, momentum (too much?), small caps
Here's what I'm looking at:
Housing Starts
The latest reading for Housing Starts surged to 1.608 million. While bears are quick to point out that much of this surge is due to warm weather, the more important point is that the housing sector is still improving. Housing is a key leading sector of the U.S. economy:
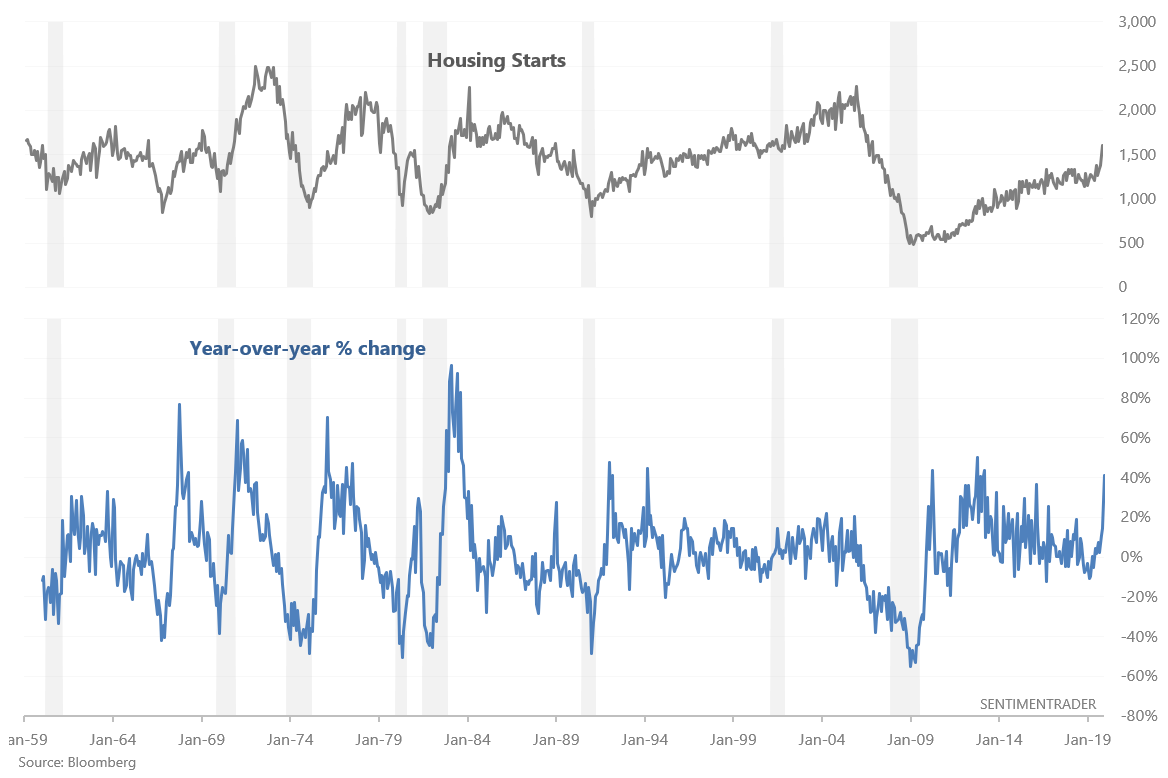
This has pushed the year-over-year change in Housing Starts above 40%, a level that's typically reached after a slump in the economy or economic recession:
- 2012: after housing made a wide bottom from 2009-2012.
- 2010: after the economy bottomed in 2009
- 1992: after the 1990-1991 recession
- 1982: after the 1981 recession
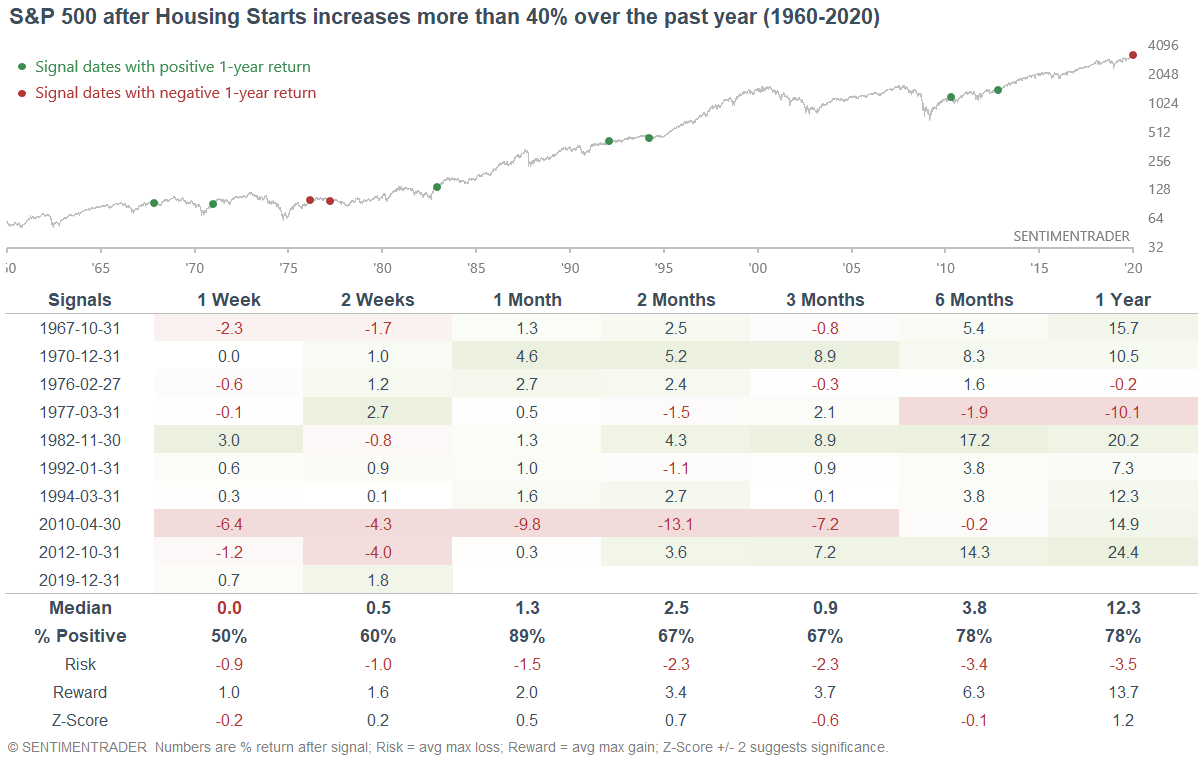
Overall, increasing housing activity is a long term (6-12 month) bullish factor for stocks.
Momentum: strong, or too much?
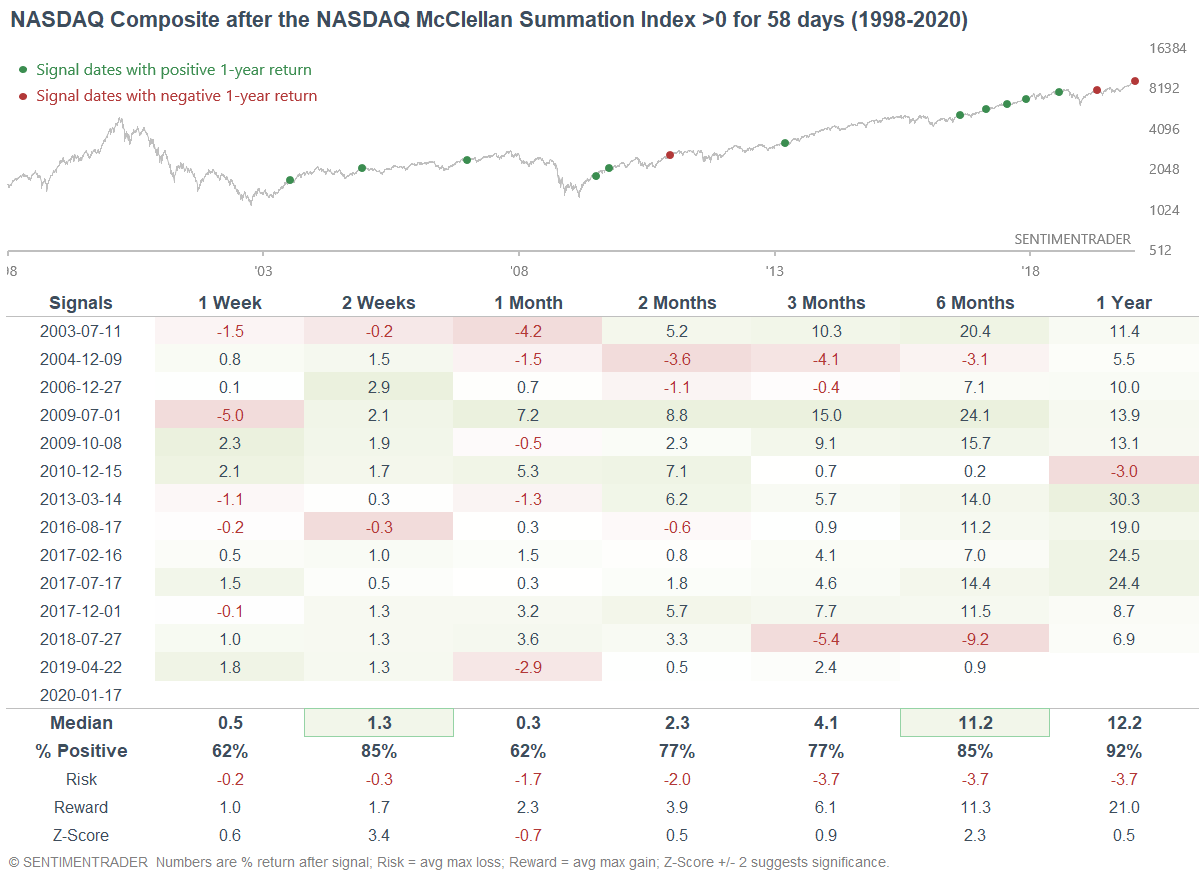
As Jason mentioned, most sentiment-related indicators are bearish, with the exception of some scattered momentum-related studies. For example, the NASDAQ McClellan Summation Index (long term breadth indicator) has been above 0 for 58 days.
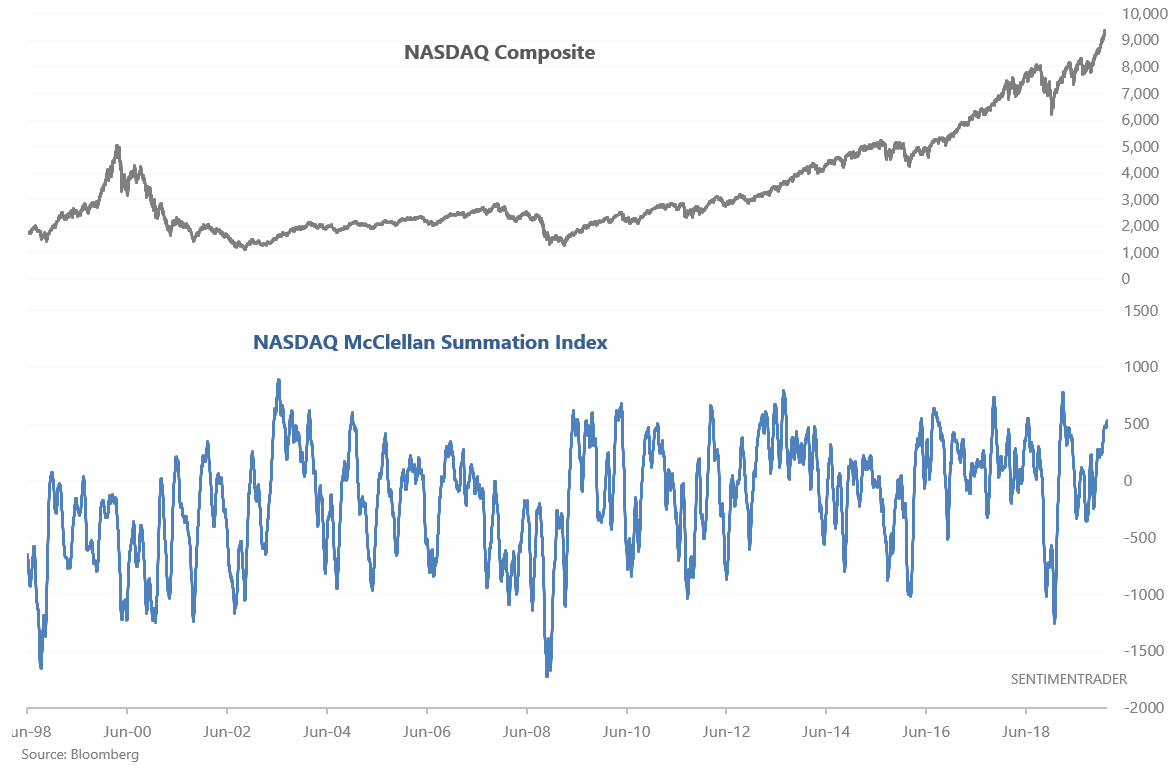
While the NYSE McClellan Summation Index tends to remain above zero for long periods of time ("long" = months if not years), a 58 day streak for the NASDAQ McClellan Summation Index is already long (historically). When this happened in the past, the NASDAQ's returns over the next 2 weeks and 6 months were mostly bullish. I prefer using momentum for a 6 month forward basis instead of a 2 week forward basis.
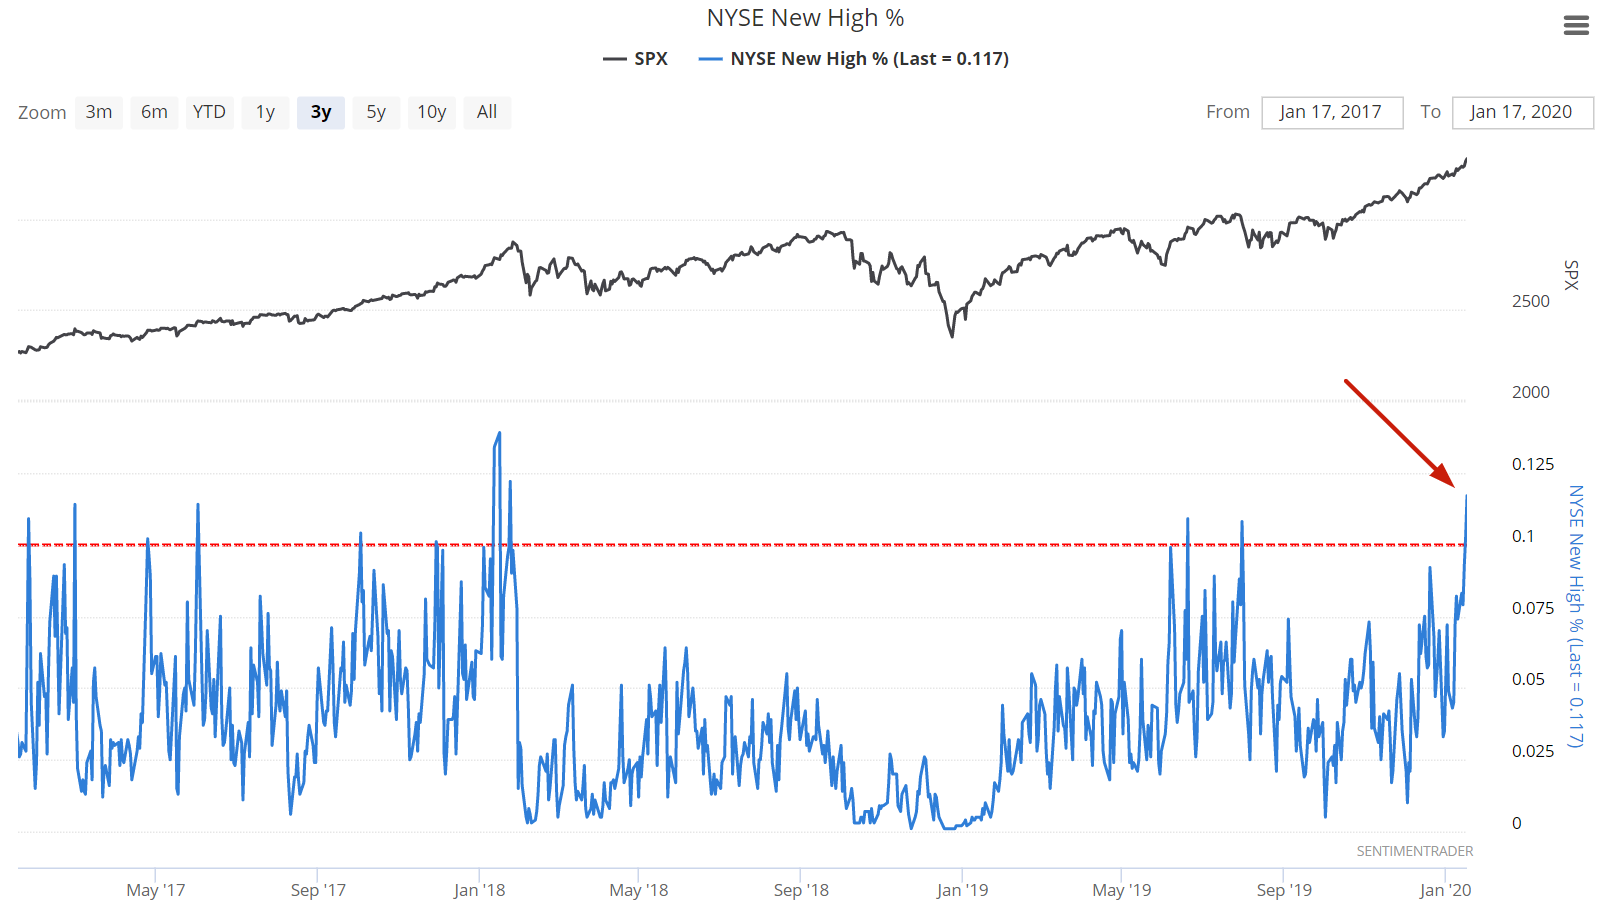
Speaking of strong breadth and momentum, the % of NYSE issues making new 52 week highs has jumped to the highest level since January 2018:
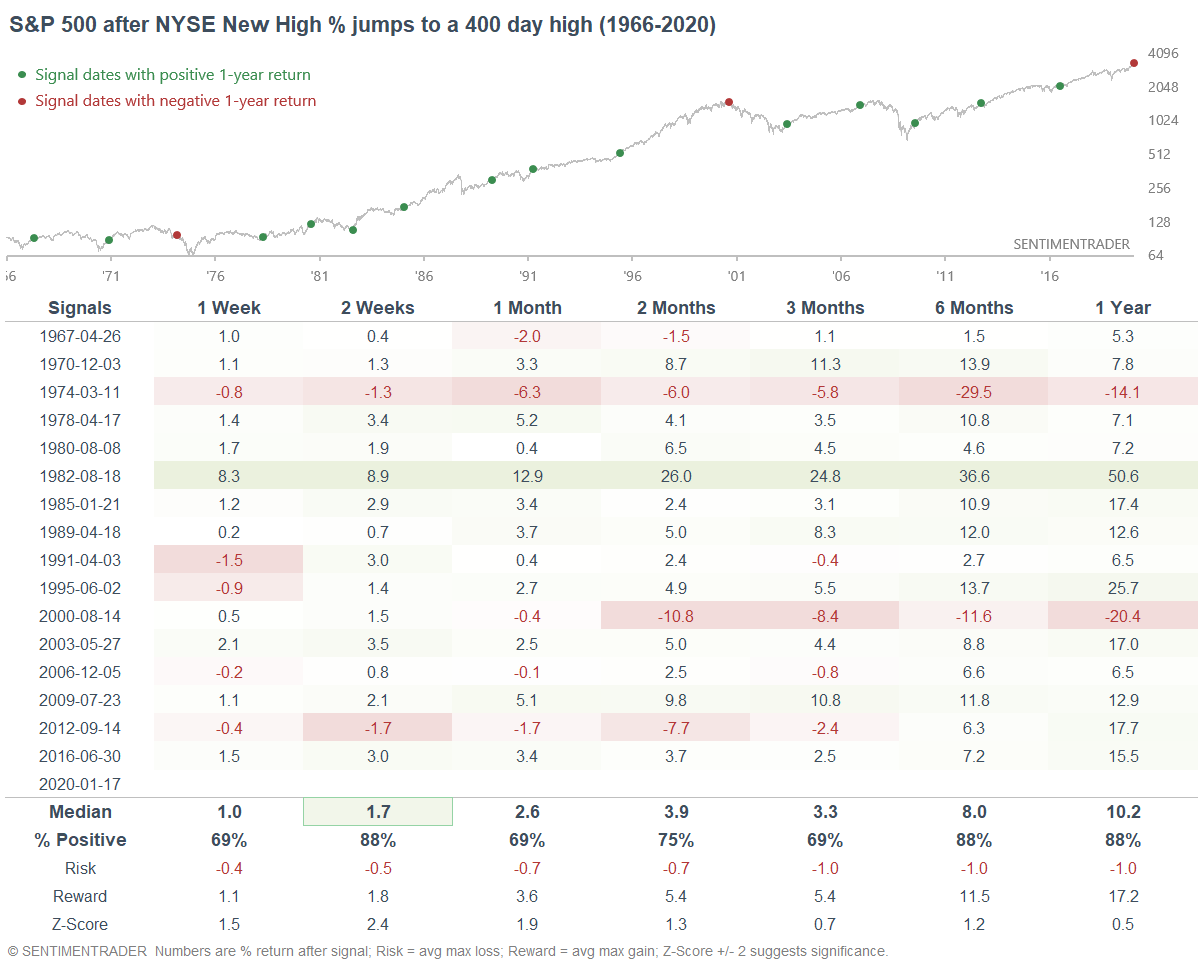
When the % of issues jumped to a 400 day high in the past, the S&P's returns over the next 2 weeks were usually bullish:
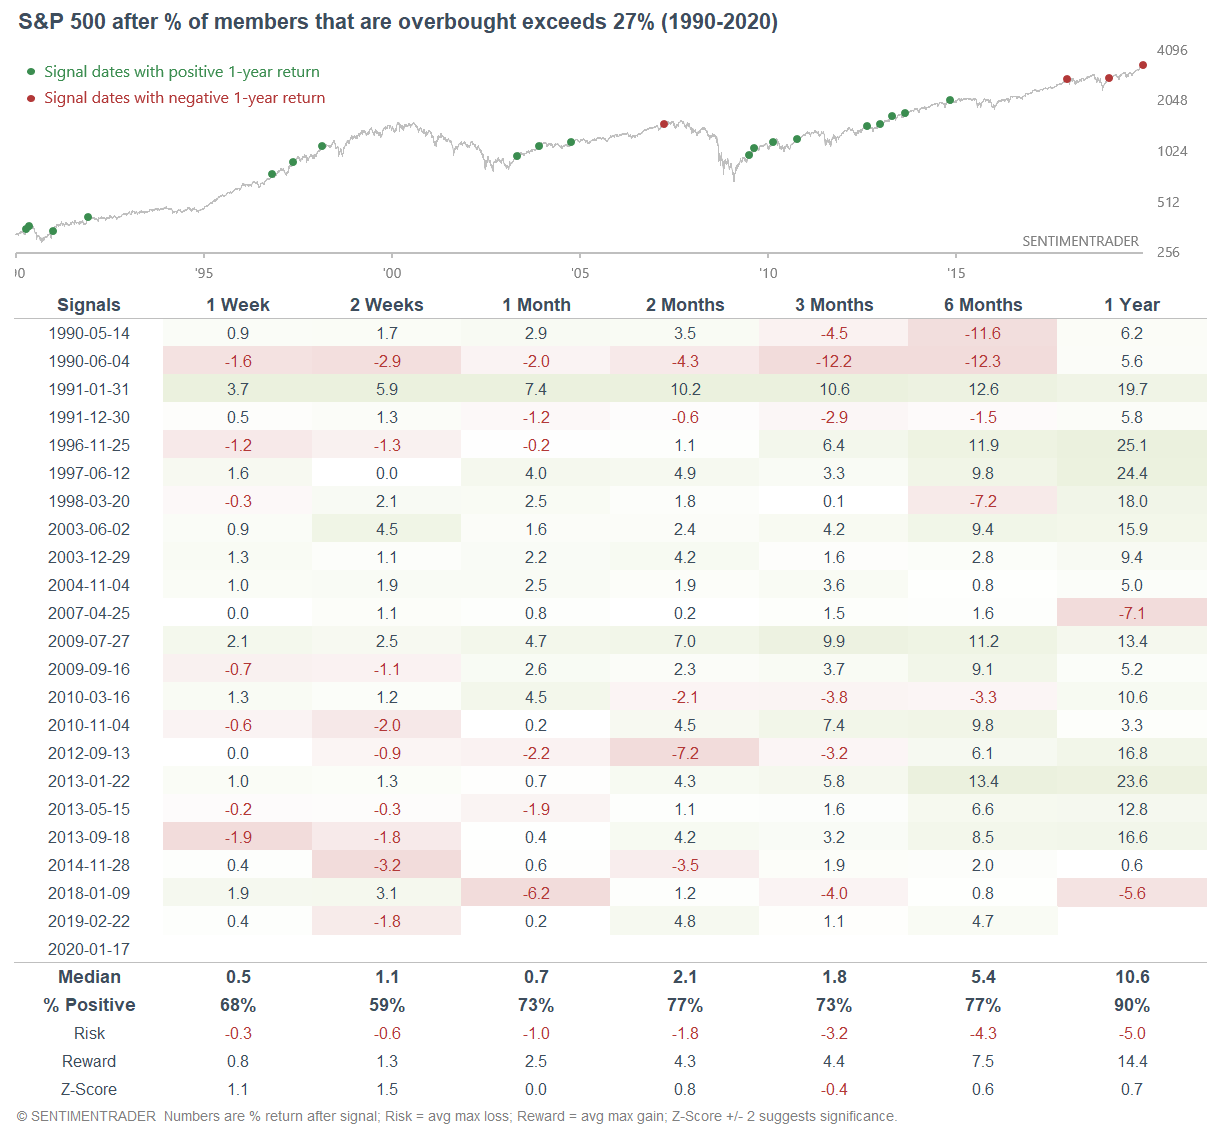
It's hard to draw the fine line between "strong momentum will lead to more short term gains" vs. "the market's short term momentum is too strong, and it will pullback soon". But there are signs that the later is starting to become true. More than 27% of the S&P 500's members are overbought (14 day RSI > 70), one of the highest readings over the past 5 years:
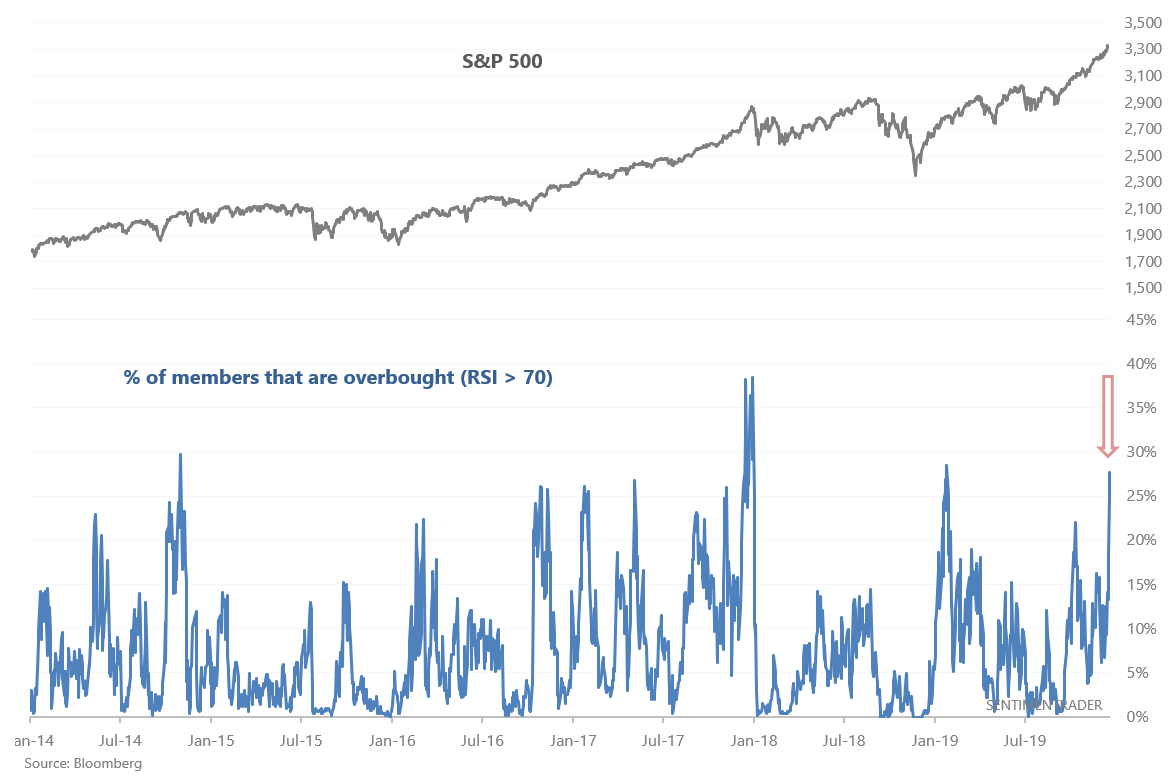
When this many members of the S&P 500 became overbought, the S&P usually fell over the next 2 weeks during this bull market (2009-present)
Small caps breakout
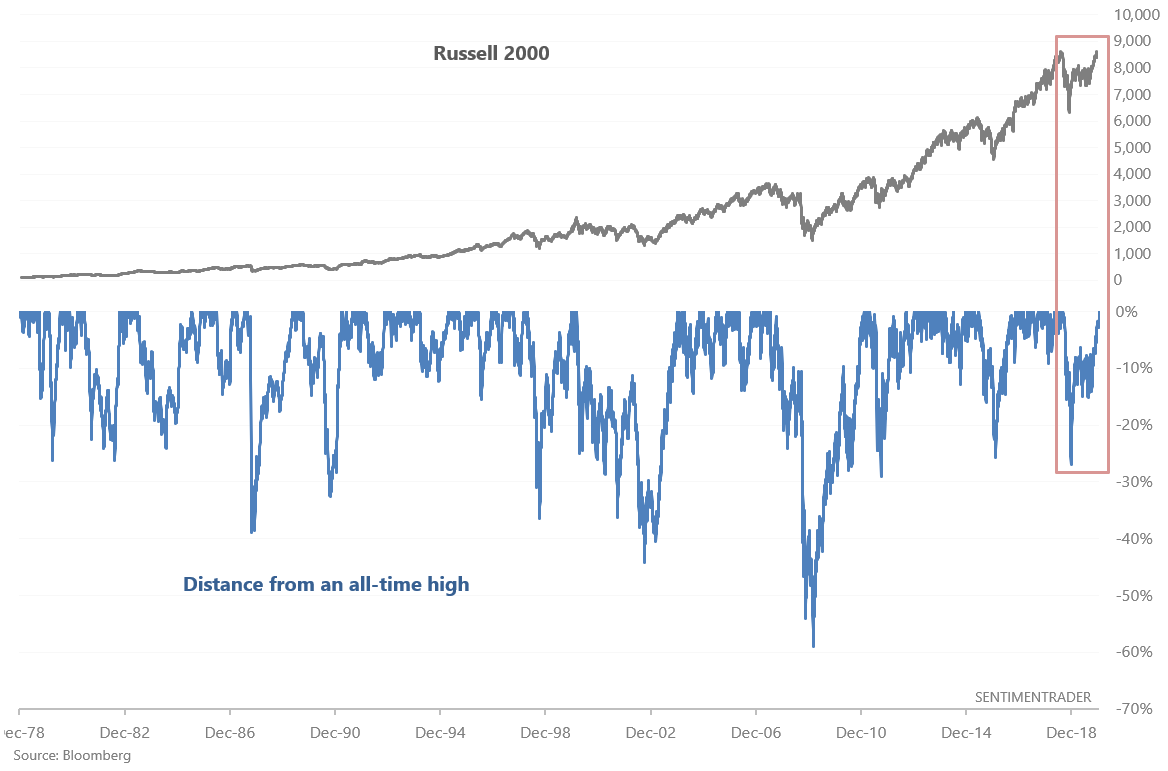
The S&P 500, Dow, and NASDAQ all made new all-time highs in 2019 after crashing in Q4 2018. The one outlier is the Russell 2000 (small caps), which has yet to make a new all-time high.
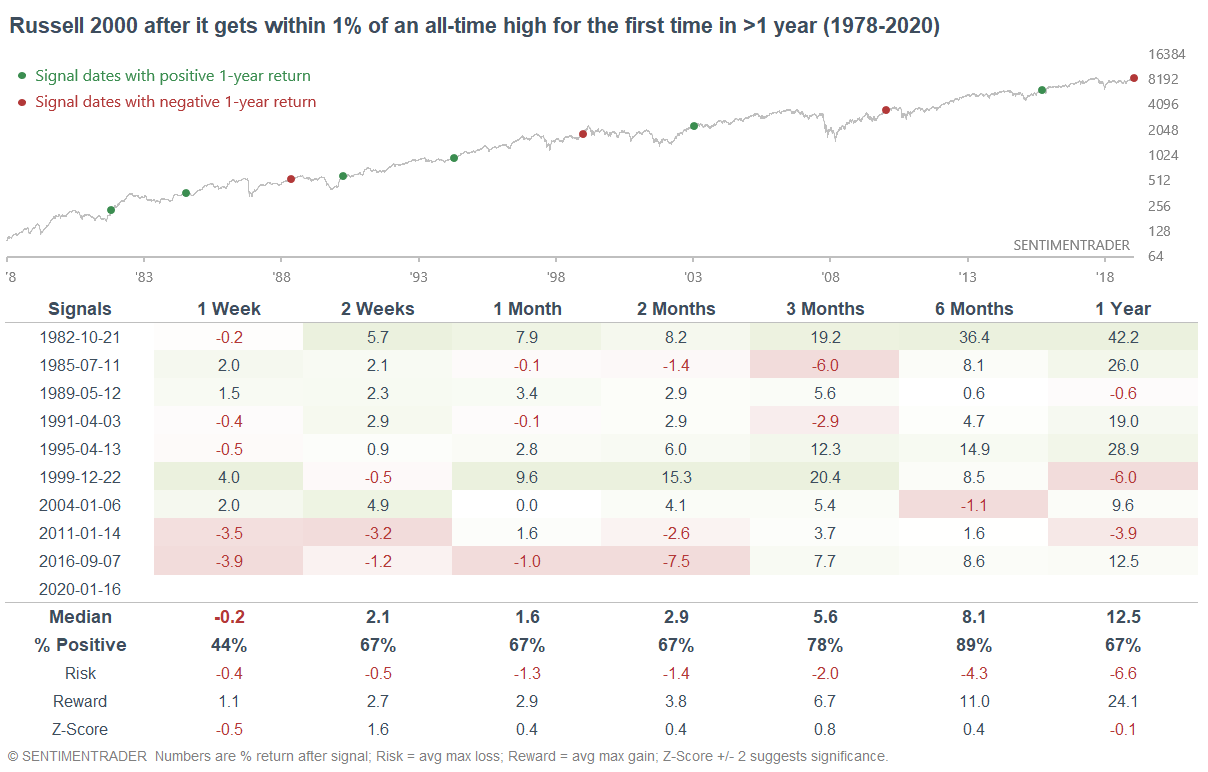
This may be about to change. The Russell 2000 (total return, including dividends reinvested) is less than 1% below its all-time high.
When the Russell 2000 (total return) came close to an all-time high for the first time in more than a year, it usually trended higher over the next 6 months.
My trading portfolio
My trading portfolio is allocated 50% in the Macro Index Model and 50% in the Simple Trading Model With Fundamentals. At the moment I have instituted a discretionary override and gone 100% long bonds (instead of long stocks) due to the extreme nature of many of our core indicators, even though some of these core indicators aren't in the models.
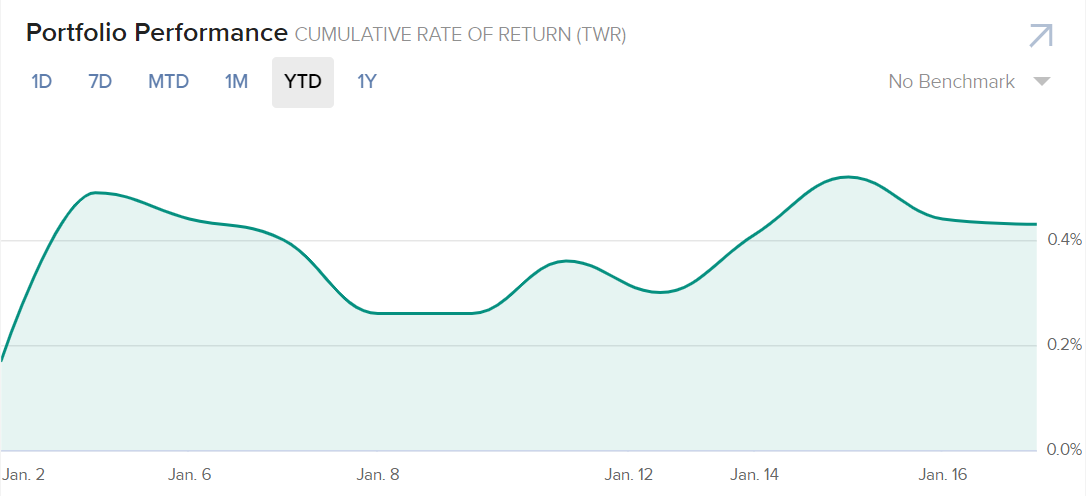
Performance YTD 2020:
- My trading account is up 0.43%
- Currently 100% in bonds