
What I'm looking at - Housing Starts, CFO's pessimism, ZEW, FedEx crash
The stock market remains near an all-time high after the Fed cut rates. Personally, I wouldn't spend too much time thinking about how the Fed's actions will impact the stock market. Plenty of people try to guess, and when you add up their successes + failures you realize that their guess isn't much better than a 50/50 bet. Overall, follow the data and don't trade the news. Here's what I'm looking at:
Housing
As I said on Tuesday, housing weakness was a key contributor to the Macro Index's bearishness in late-2018. But various housing indicators are starting to improve, starting with the NAHB Housing Market Index and now Housing Starts. After trending sideways for a year, Housing Starts has finally made a new high for this economic expansion.
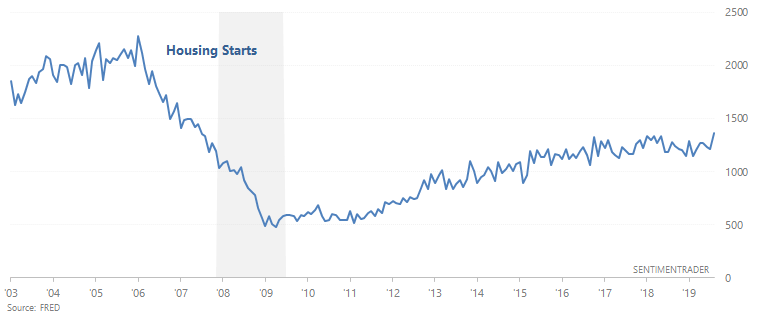
This is very important, because housing indicators are some of the most consistent leading indicators for the U.S. economy. Plenty of academic papers have examined the leading nature of housing, and some have even declared that "housing IS the U.S. economy". In the past, housing indicators such as Housing Starts typically trended sideways before bear markets and recessions began. The new high in Housing Starts is encouraging for this economic expansion and bull market.
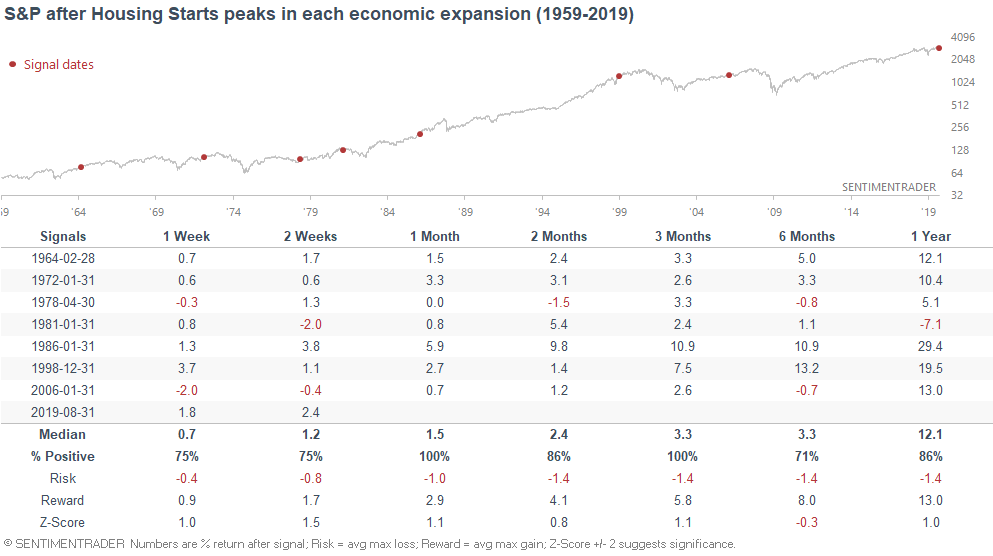
Now let's assume a worst case scenario. Let's assume that the latest reading (for the month of August 2019) will be the high for Housing Starts in this economic expansion.
When Housing Starts peaked in each economic expansion, the S&P typically continued to rally over the next year. Hence why this is a leading indicator.
What surprises me about the resurgence in housing is that Bill McBride from Calculated Risk seems to be right. Back in 2018 when housing indicators were trending downwards, Bill said that he didn't think a recession would happen until 2021 because he didn't think housing would peak until 2021. This was a bold call at the time, because the consensus was RECESSION INCOMINGGGGG. And Bill has an amazing track record. He called the 2007 housing crash, called the 2012 housing bottom, and seems to be on track so far.
Personally, I don't like to guess economic data because most guesses are no better than a 50/50 coin toss. But if I had to trust one economist with my money, it certainly would be Bill. (Also he has nothing to sell, so there is an honesty factor).
*This is not a paid endorsement. Just a fan of his work.
Overall, the resurgence in housing (if this continues) is good for macro.
CFO's pessimism
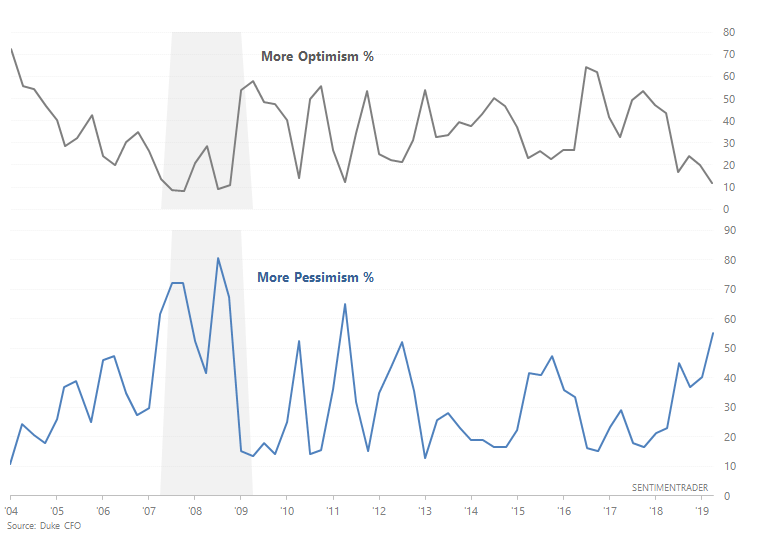
As CNBC noted, "a survey of 225 chief financial officers by Duke University shows pessimism on the U.S. economy has been growing steadily this year ".
This is due to a global slowdown in growth (particularly outside the U.S.), combined with Trump's ongoing trade war.
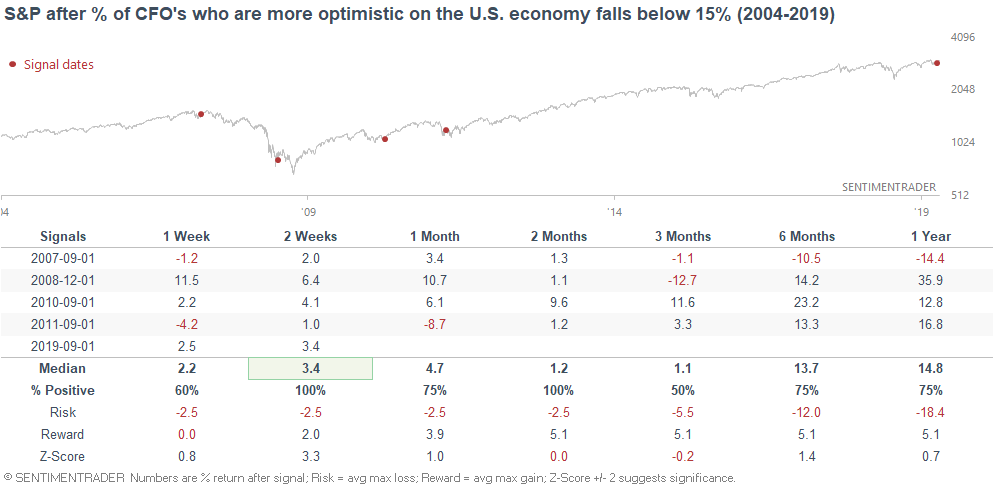
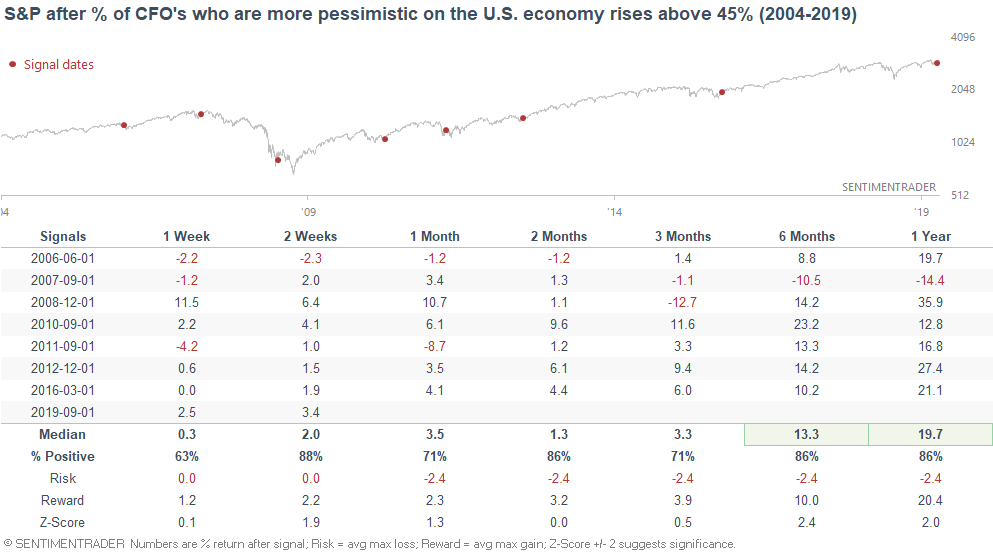
The following charts illustrate what % of CFO's are more optimistic about the U.S. economy, and what % of CFO's are more pessimistic about the U.S. economy.
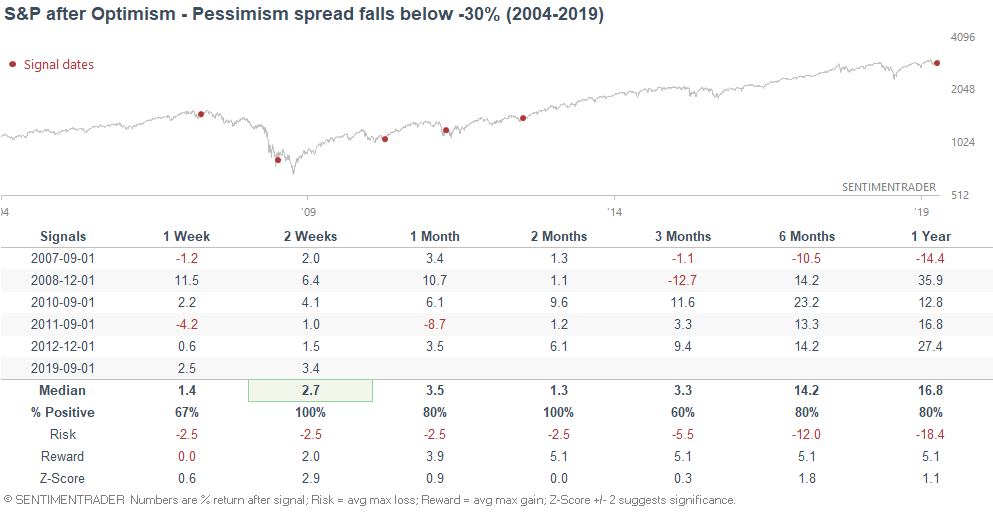
The next chart looks at the Optimism - Pessimism spread
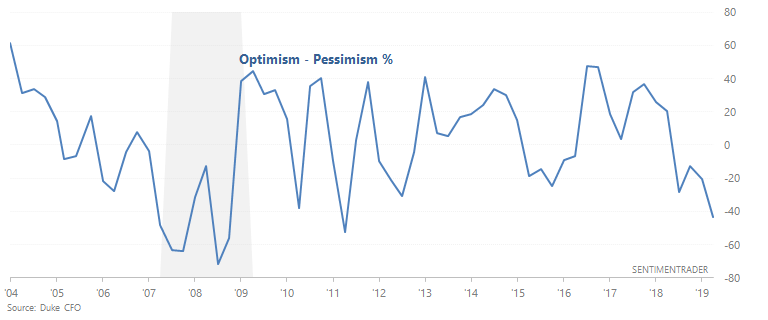
Overall, CFO's tend to become more pessimistic whenever global growth slows down (e.g. 2007-2008, 2010, 2011, 2012, 2015, now). However, their concerns aren't always accurate because many "growth slowdowns" don't turn into full-blown recessions and bear markets.
The following chart illustrates what happened next to the S&P after the % of CFO's who are more optimistic on the U.S. economy falls below 15%:
The next chart illustrates what happened next to the S&P after the % of CFO's who are more pessimistic on the U.S. economy rises above 45%:
And lastly, the next table looks at what happened next to the S&P when the Optimism - Pessimism spread falls below -30%:
Overall, I wouldn't be too concerned about the fact that CFO's are turning pessimistic. Their concerns are a reflection of what we already know: global growth slowdown + trade war.
Germany ZEW
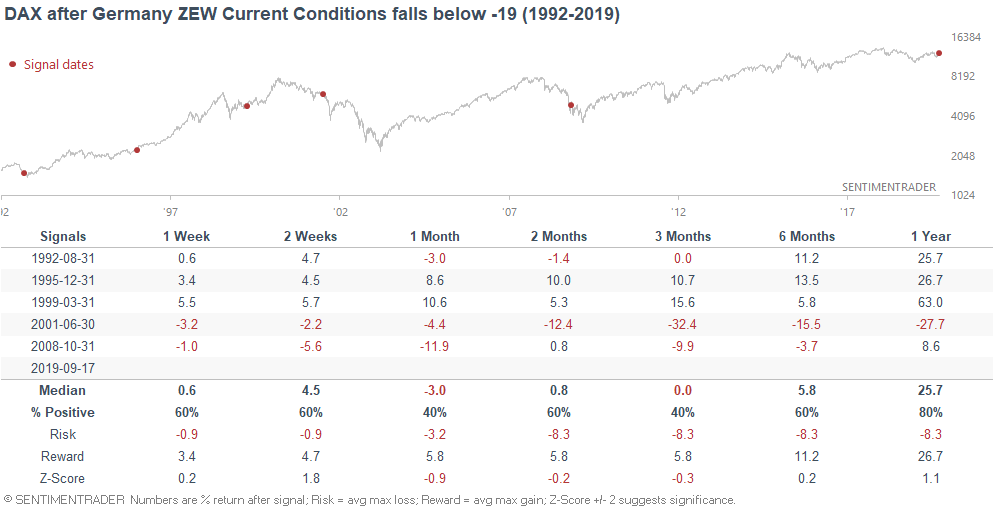
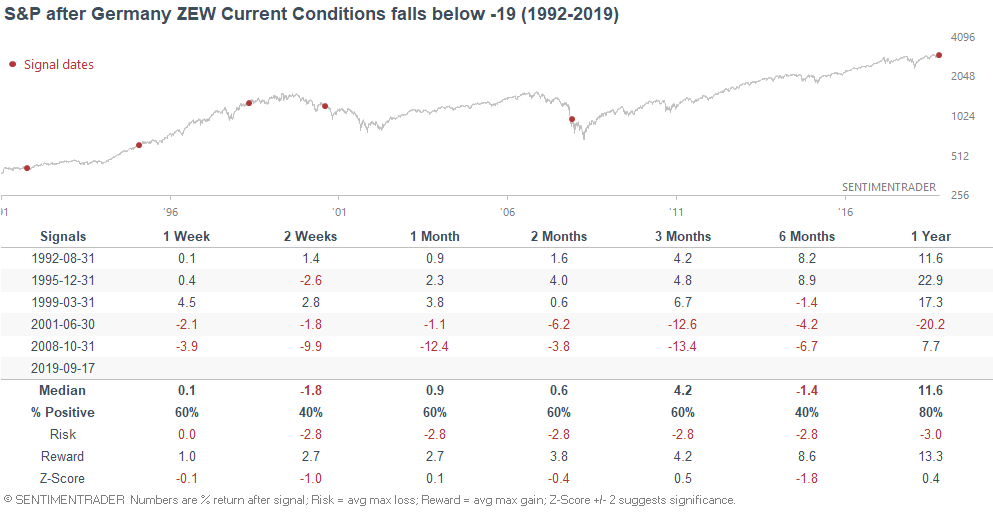
The Germany ZEW survey is a popular sentiment survey that asks analysts from banks, insurance companies, and industrial enterprises what they think about the German economy. And right now, Germany's ZEW Current Conditions has fallen to the "lowest level since 2008" (insert scary music).
Except it hasn't always been that scary. When this happened in 2008, it occurred towards the end of the bear market and the worst of the recession. Before that, it wasn't a consistent long term bearish factor (1+ years) for the German stock market, although there was weakness over the next 3-6 months.
*Sample size is a bit small, but sentiment surveys seem to be quite useful for understanding the German economy. I follow Ifo and ZEW for the German economy.
Here's what happened next to the S&P 500.
Fedex
And lastly, FedEx crashed more than 12% yesterday. Pundits are quick to point out that "this is the worst one day crash since 2008", thereby implicitly connecting today with 2008 ("it's 2008 all over again")
*FedEx crashed on its earnings report.
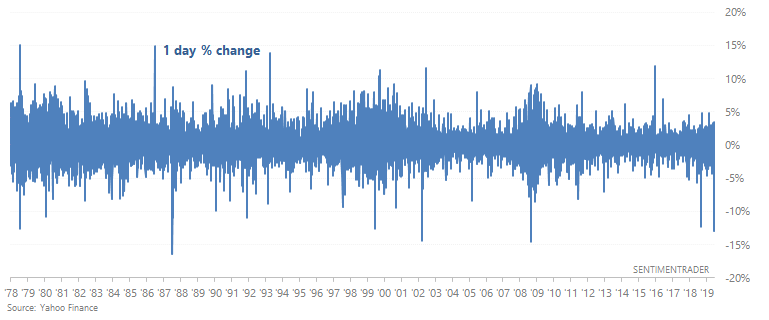
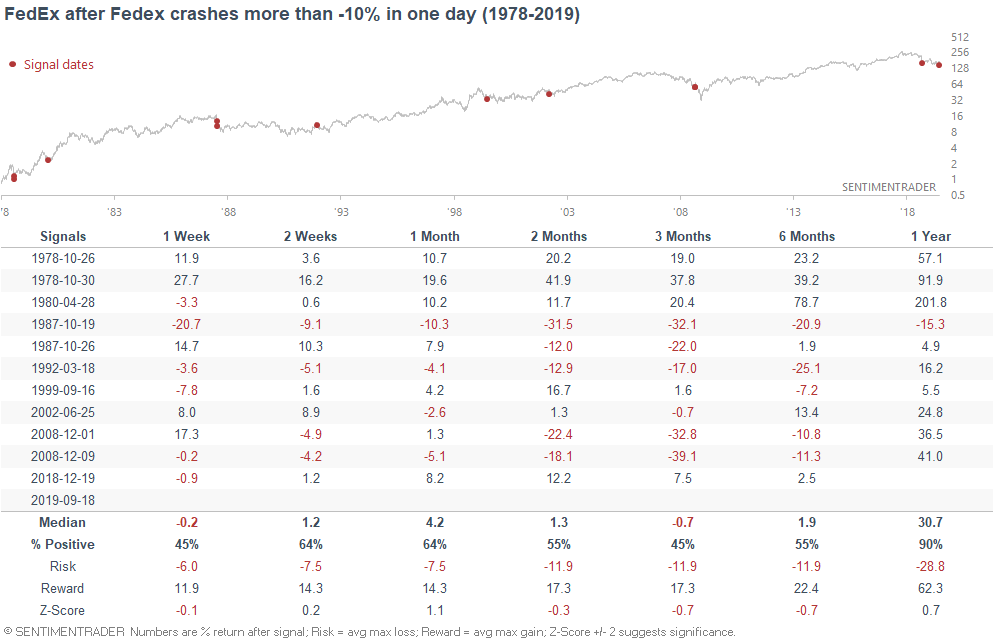
Except the biggest one day FedEx crashes usually occurred towards the end of a bear market, not the beginning.
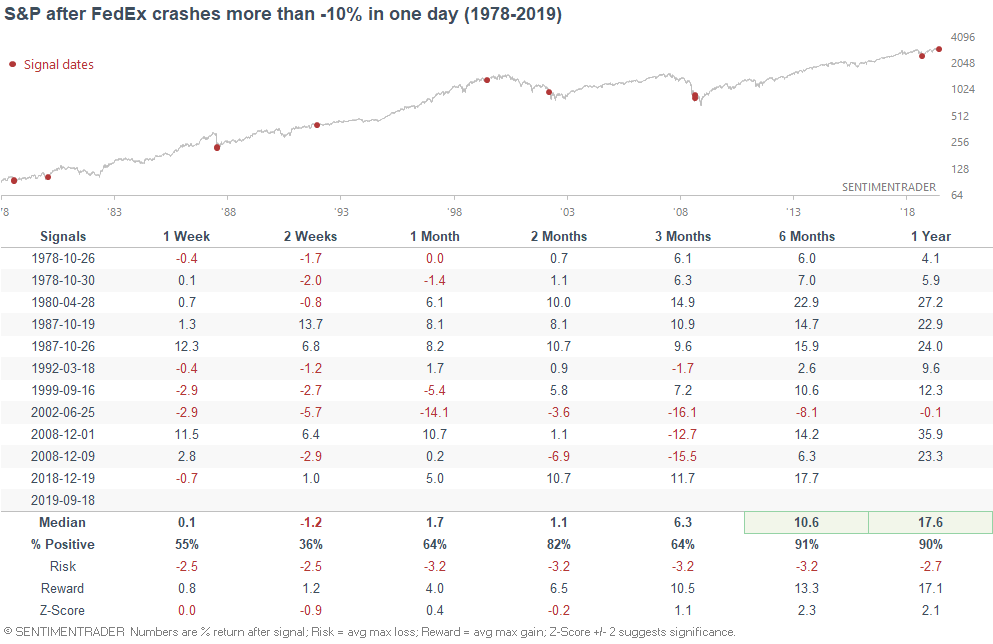
Here's what happened next to FedEx:
Overall, I don't think it makes much sense to use 1 company's stock price to predict the broad U.S. stock market or economy. This reminds of popular tweets last year that went along the lines of:
- GE is crashing right now. The last time GE crashed was 2008. I guess it's 2008 all over again!
- Sotheby's is crashing right now. The last time Sotheby's crashed was 2008. I guess it's 2008 all over again!
Conclusion
From my weekend market overview:
- Long term risk:reward doesn’t favor bulls. Valuations are high, but valuations can remain high for years.
- Fundamentals (6-12 months): still bullish because there is no significant U.S. macro deterioration, but this could change IF macro data deteriorates significantly over the next few months
- Technicals (3-6 months): mostly bullish
- Technicals (1-2 months): no clear edge in either direction