Products
SentimenTrader Trading Tools
‍
Backtest Engine
My Trading Toolkit
Correlation Analysis
Seasonality
Indicators & Data API
‍
Proprietary Indicators & Charts
Market Data API
Strategies & Scanner
‍
50+ Trading Strategies
Smart Stock Scanner
Research Reports
‍
Research Solutions
Reports Library
Free Resources
Simple Backtest Calculator
Simple Seasonality Calculator
The Kelly Criterion Calculator
Sentiment Geo Map
Public Research Reports
Pricing
Company
About
In the News
Testimonials
Client Success Stories
Contact
Log inLoginSign up
< BACK TO ALL REPORTS

What I'm looking at - healthcare, France, GDP growth, MSCI World Index, breadth

Troy Bombardia
2019-11-19
null

Here's what I'm looking at:


Healthcare

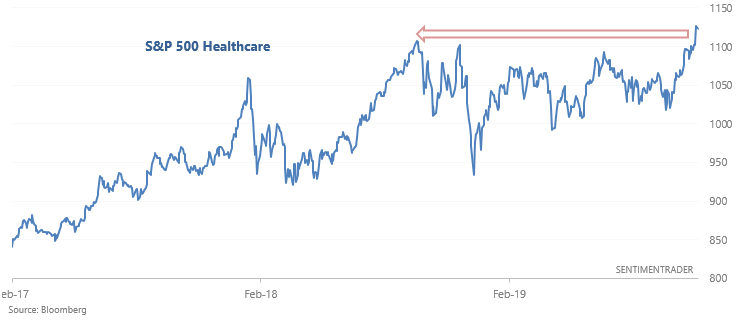
With stock markets around the world trending higher, various sectors of the S&P 500 continue to breakout. For example, the S&P 500 Healthcare sector exceeded its October 2018 high last Friday:

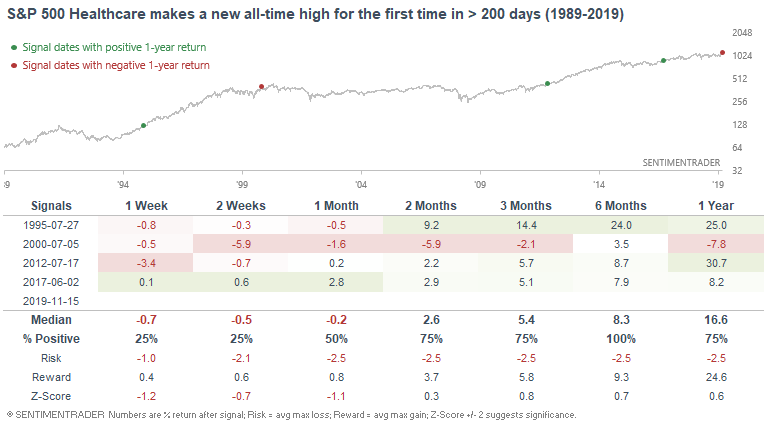
Over the past 30 years, such long term breakouts were rare but bullish for the S&P 500 Healthcare sector over the next 6 months.

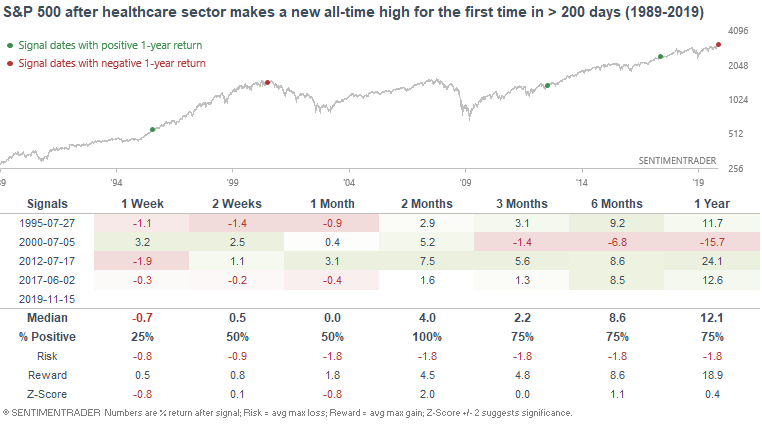
As for the S&P 500, this was still bullish over the next 2 months, despite one of the cases (July 2000) occurring just before a massive bear market began.


France

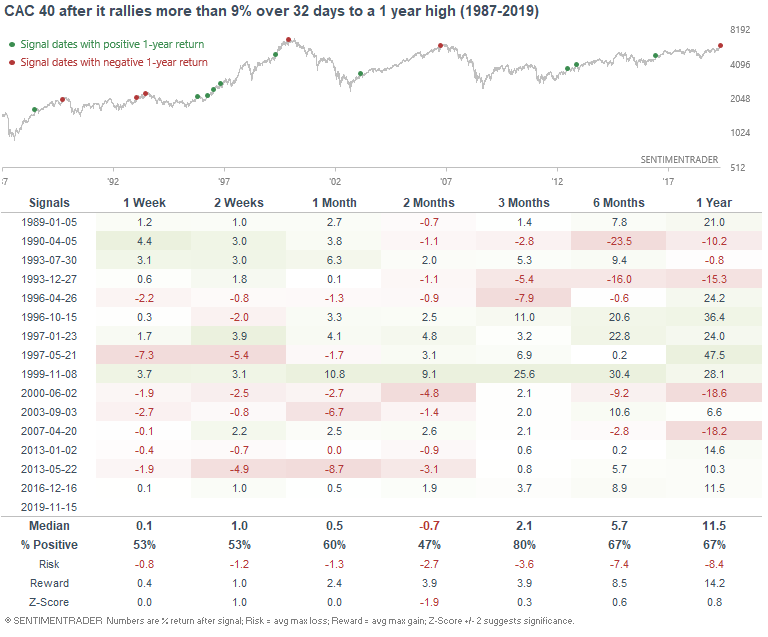
With global stocks still rallying higher, a short term breather is likely. For example, France's CAC 40 Index has rallied more than 9% since early-October to a multi-year high:

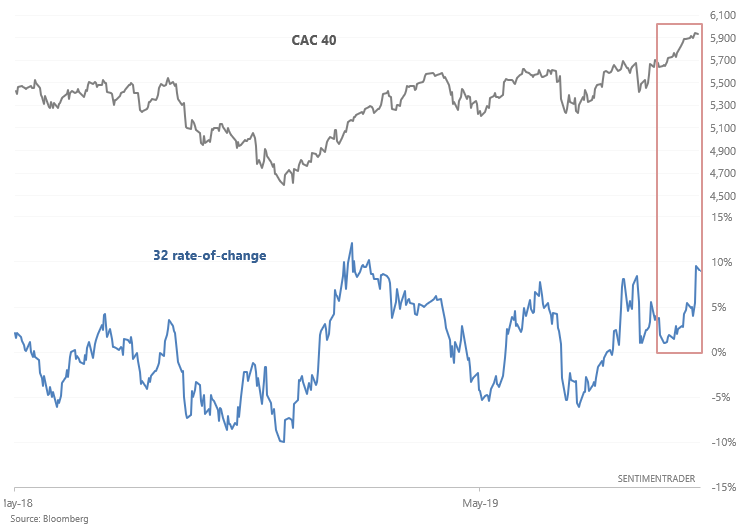
Such strong short term rallies typically run into trouble over the next 2 months, with a bearish risk:reward profile for the CAC 40.


GDP growth

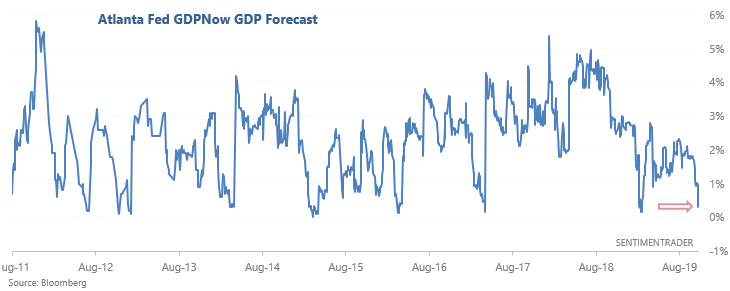
As Bloomberg TV demonstrated, the Atlanta Fed's GDPNow GDP Forecast (estimate for growth) is showing a sharp slowdown for Q4.

Such slowdowns in economic growth expectations have occurred multiple times in this bull market, and were all bullish for stocks over the next 2 months:

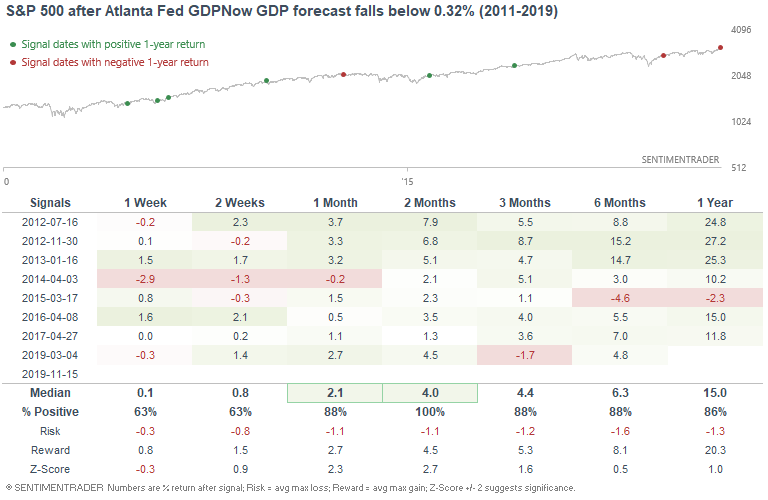
*Don't take the 6-12 month forward returns too seriously, since this data is limited to the current bull market. With that being said, if we only look at cases that were not followed by a recession (and a recession now is unlikely), this is bullish for stocks on almost all time frames.

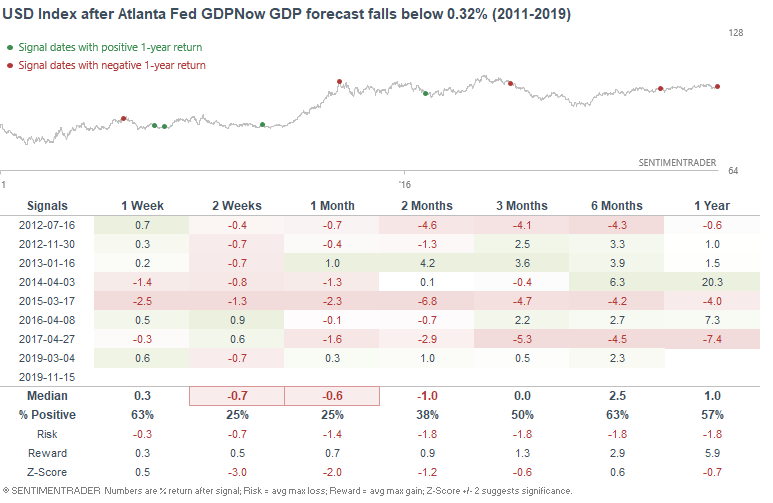
Meanwhile, this was mostly bearish for the U.S. Dollar over the next few weeks:
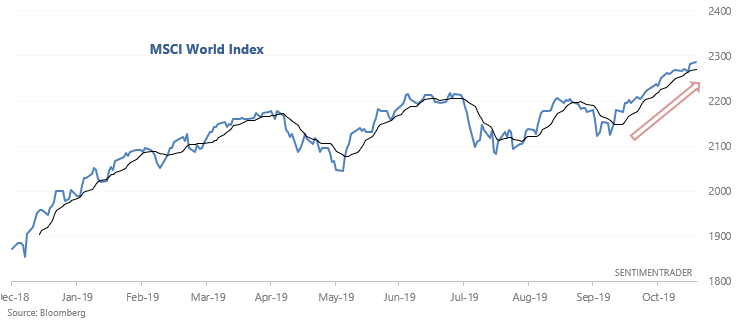

MSCI World Index

With stocks rallying a few points every day, the MSCI World Index continues to push towards new highs.

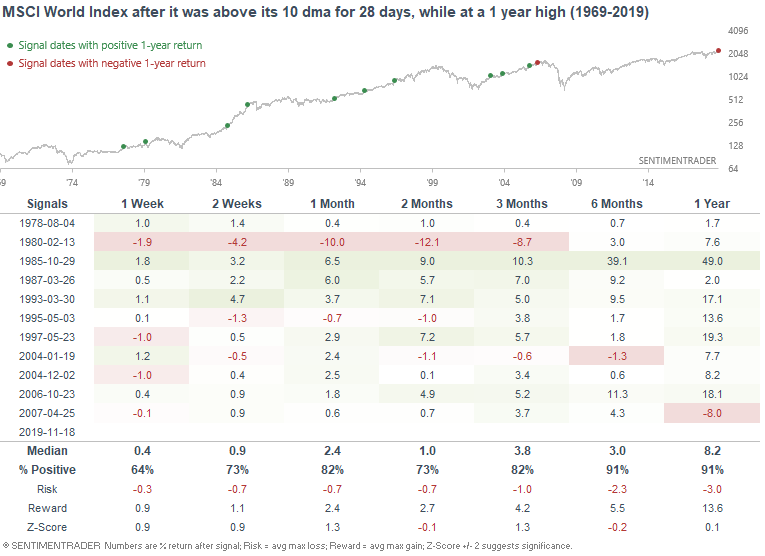
Similar to my weekend post, the MSCI World Index has spent 28 days above its 10 dma. When this happened while global stocks were at a 1 year high, the MSCI World Index almost always went up 6-12 months later. The one big exception was 2007, when this occurred just a few months before stocks topped.


Breadth

Jason (here and here) and I have touched on breadth recently, usually with the conclusion that breadth is short term bearish for stocks right now. These problems remain. Similar to several of the past few days, the S&P managed to squeak out a gain while more volume flowed into falling issues than rising issues.

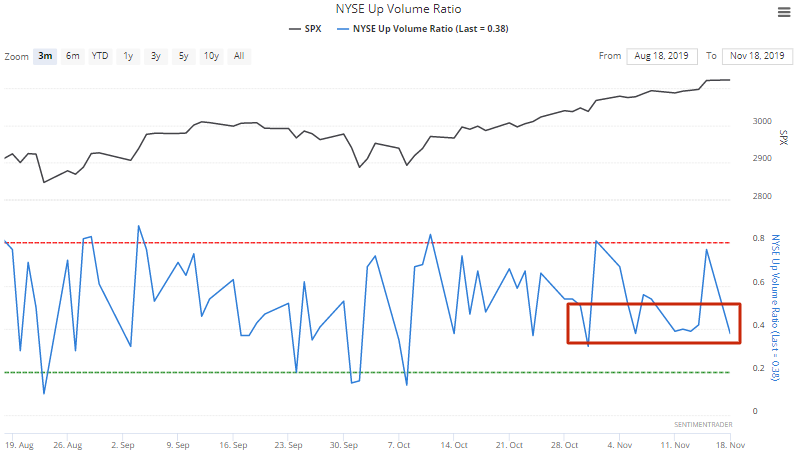
The S&P 500 has gone up on 8 of the past 9 days, while 6 of the past 9 days have seen more volume flowing into declining issues. Looking at the few times this happened in the past, the S&P went up every time over the next 2-6 months. This is mostly due to the fact that many of these signals occurred in 2017, a year in which stocks rallied relentless, regardless of warning signs from various indicators. 

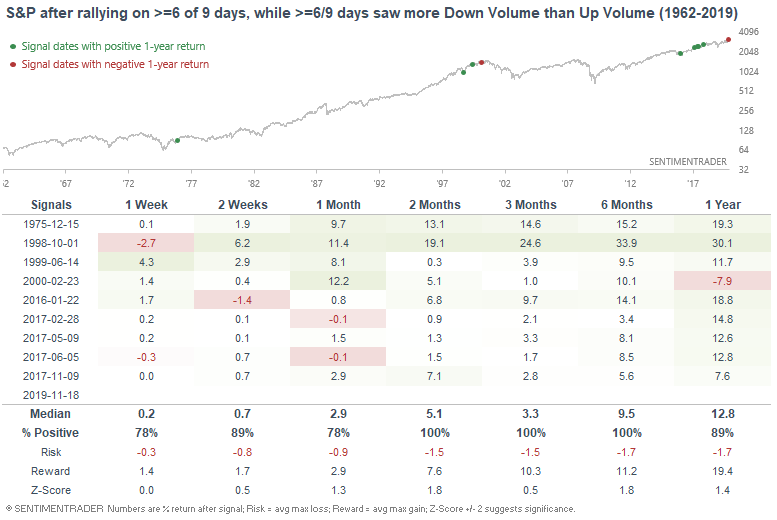
Despite this bullish stat, I would overall consider breadth to be a bearish factor for stocks right now.

Sorry, you don't have access to this report

Upgrade your subscription plan to get access
Go to Dasboard
PRODUCTS
SentimenTrader
Trading Tools
Indicators & Data API
‍
Strategies & Scanner
‍
Research Reports
FREE
RESOUrCES
Simple Backtest
Calculator
Simple Seasonality
Calculator
The Kelly Criterion
Calculator
Sentiment Geo Map
‍
Public Research Reports
‍
Pricing
Bundle pricing
‍
Announcements
‍
FAQ
COMPANY
‍
About
‍
In the News
‍
Testimonials
‍
Client Success Stories
CONTACT
‍
General Inquiries
‍
Media Inquiries
‍
Financial Professionals Inquiries
‍
© 2025 Sundial Capital Research Inc. All rights reserved.
Setsail Marketing
TermsPrivacyAffiliate Program
Risk Disclosure: Futures and forex trading contains substantial risk and is not for every investor. An investor could potentially lose all or more than the initial investment. Risk capital is money that can be lost without jeopardizing ones’ financial security or life style. Only risk capital should be used for trading and only those with sufficient risk capital should consider trading. Past performance is not necessarily indicative of future results.

Hypothetical Performance Disclosure: Hypothetical performance results have many inherent limitations, some of which are described below. No representation is being made that any account will or is likely to achieve profits or losses similar to those shown; in fact, there are frequently sharp differences between hypothetical performance results and the actual results subsequently achieved by any particular trading program. One of the limitations of hypothetical performance results is that they are generally prepared with the benefit of hindsight. In addition, hypothetical trading does not involve financial risk, and no hypothetical trading record can completely account for the impact of financial risk of actual trading. for example, the ability to withstand losses or to adhere to a particular trading program in spite of trading losses are material points which can also adversely affect actual trading results. There are numerous other factors related to the markets in general or to the implementation of any specific trading program which cannot be fully accounted for in the preparation of hypothetical performance results and all which can adversely affect trading results.

Testimonial Disclosure: Testimonials appearing on this website may not be representative of other clients or customers and is not a guarantee of future performance or success.