Products
SentimenTrader Trading Tools
‍
Backtest Engine
My Trading Toolkit
Correlation Analysis
Seasonality
Indicators & Data API
‍
Proprietary Indicators & Charts
Market Data API
Strategies & Scanner
‍
50+ Trading Strategies
Smart Stock Scanner
Research Reports
‍
Research Solutions
Reports Library
Free Resources
Simple Backtest Calculator
Simple Seasonality Calculator
The Kelly Criterion Calculator
Sentiment Geo Map
Public Research Reports
Pricing
Company
About
In the News
Testimonials
Client Success Stories
Contact
Log inLoginSign up
< BACK TO ALL REPORTS

What I'm looking at - emerging markets, utilities breadth, AAII, Taiwan

Troy Bombardia
2020-01-30

Here's what I'm looking at:


Emerging markets plunge & breadth aggregate

We've looked at various breadth stats recently, such as the "% of index members below their lower Bollinger Bands", "the % of index members with RSI < 30", and "the % of index members with MACD sell signals in the past 10 days". With Emerging Markets falling, we can create an aggregate for these 3 breadth indicators.

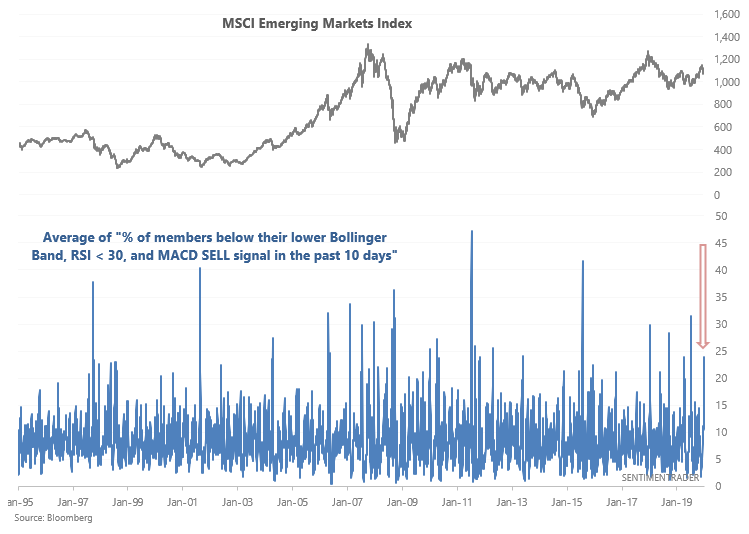
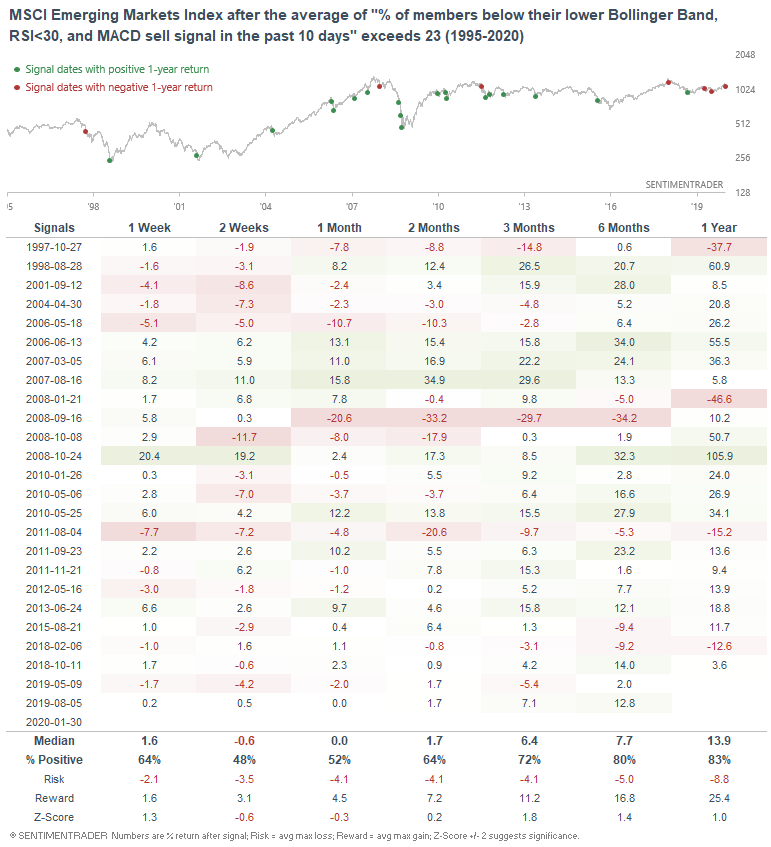
As you can see, breadth is quite weak for emerging markets. When this happened in the past, the MSCI Emerging Markets Index's returns were not significantly different from random. On the other hand, 3-12 month forward returns leaned bullish:


Utilities breadth

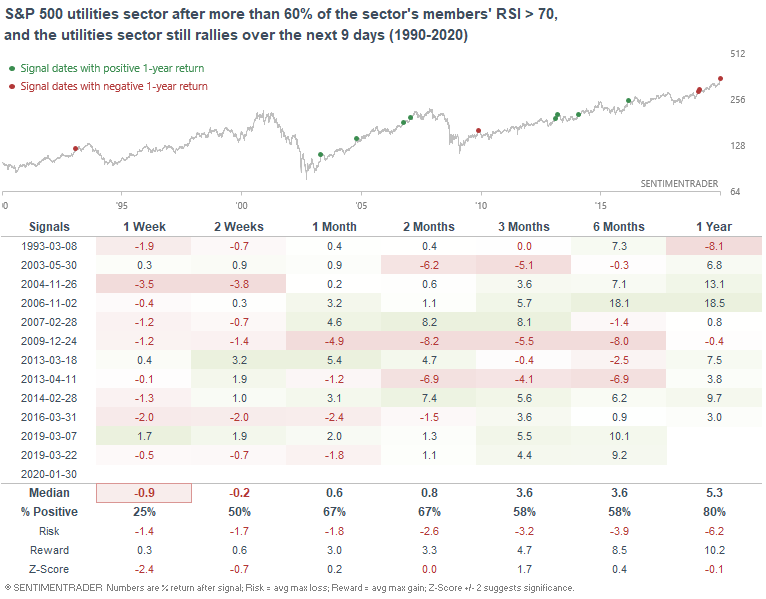
The phrase "extremes can become more extreme" is highly pertinent to utilities right now. After an extremely large number of the utilities sector's members saw RSI readings >70 (overbought), the utilities sector continues to rally:

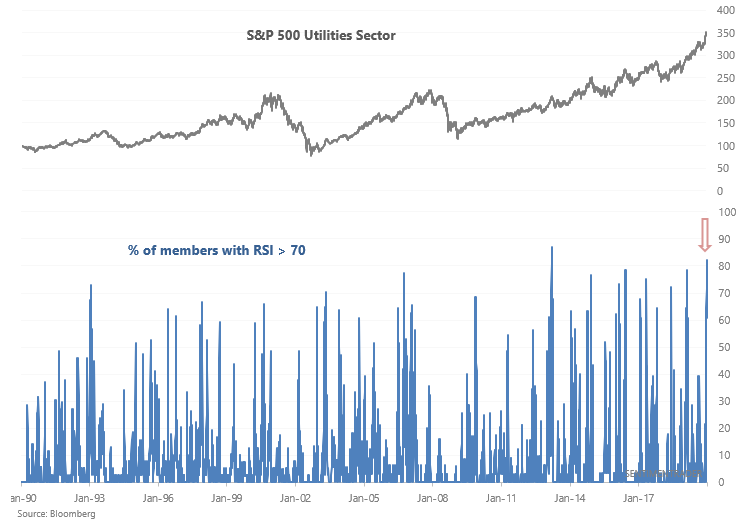
When many of the utilities sectors' stocks were overbought, yet the utilities sector still rallied over the next 9 days, the utilities sector usually faced weakness over the next week:

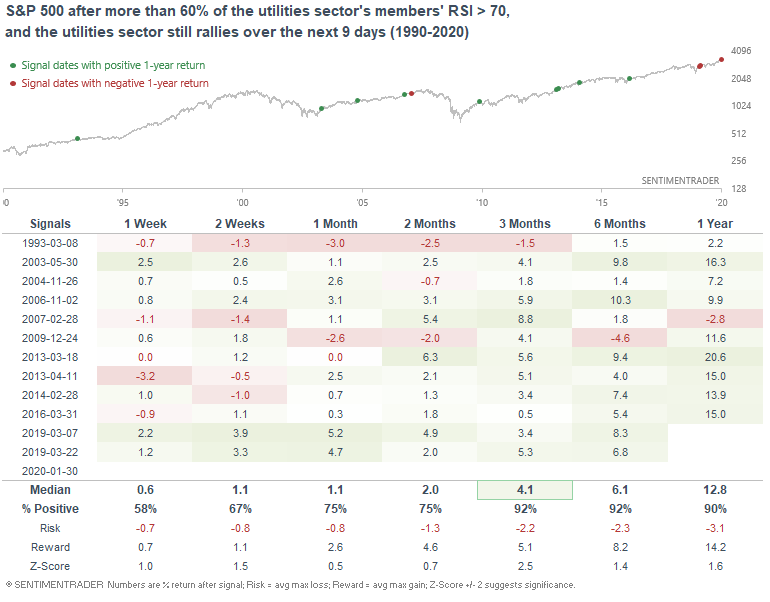
On the other hand, this was quite bullish for the broad S&P 500 over the next 3 months:


AAII

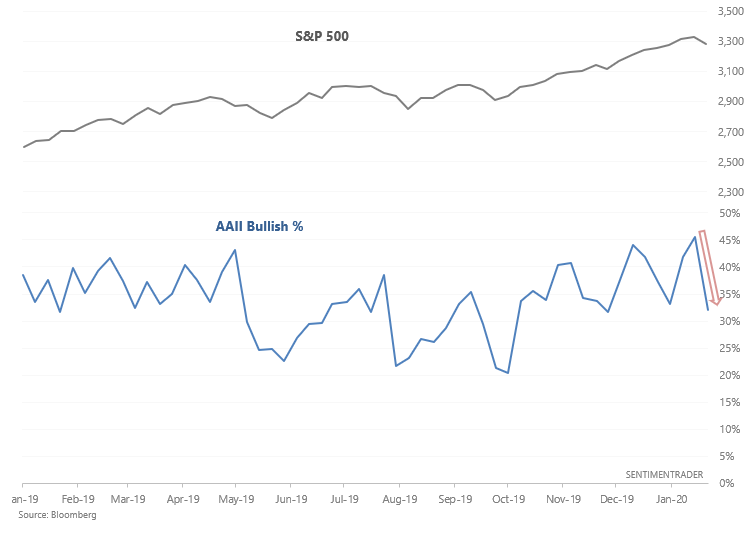
Last week saw the AAII Bullish % jump to a 1 year high. But as U.S. equities stalled this week, AAII Bullish % fell more than -13%, which is quite a strong one week slump:

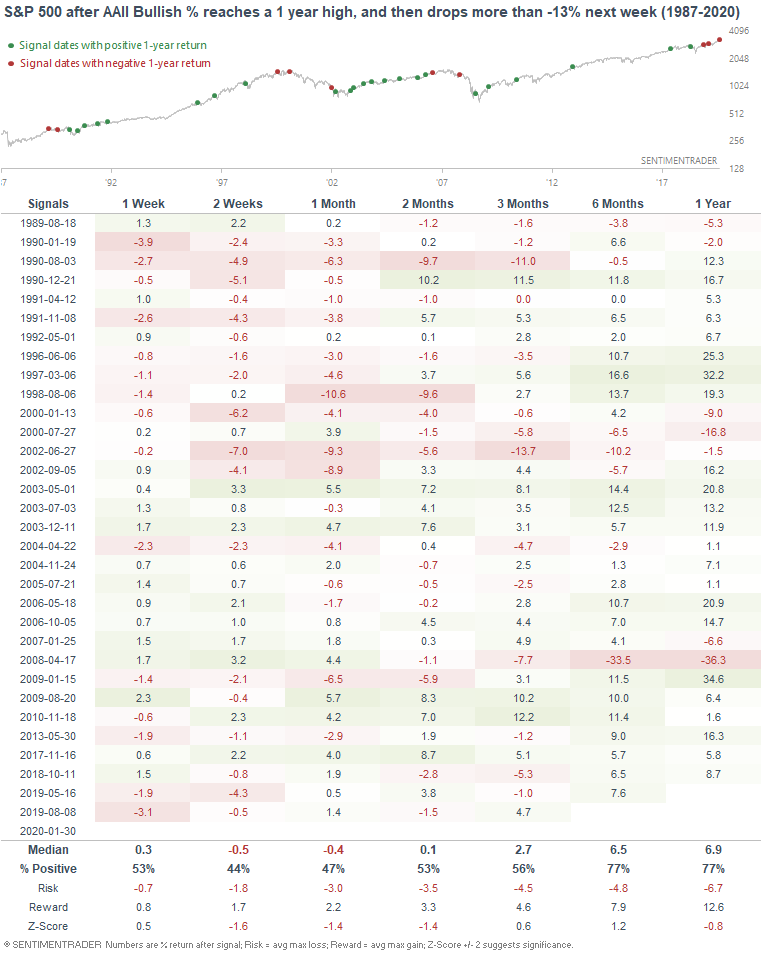
When this happened in the past, the S&P sometimes faced continued short term weakness over the next 2-4 weeks. Granted, most of the bearish cases occurred before 2003, so perhaps this isn't a significant bearish factor for the stock market anymore.


Taiwan

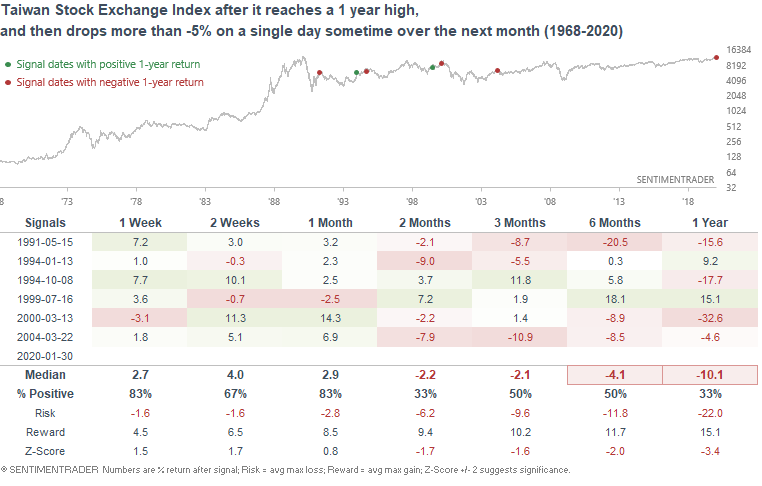
And lastly, Taiwan posted an extremely large 1 day drop on Thursday after recently reaching a multi-year high. Such large drops from all-time highs are rare:

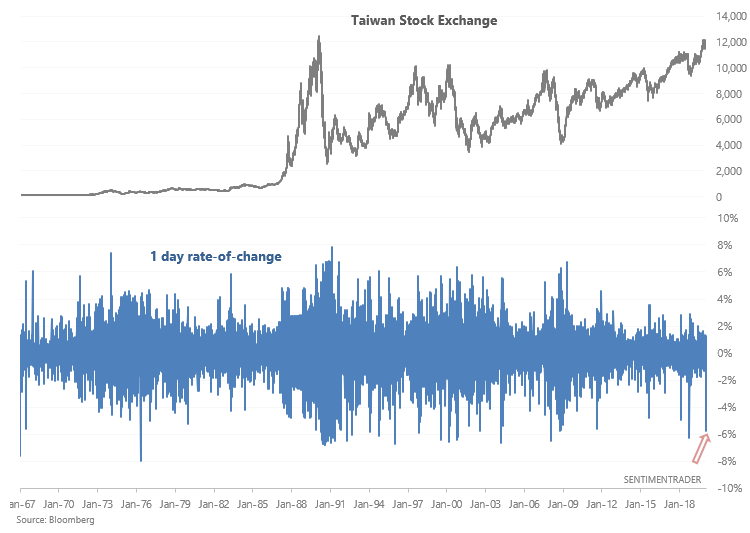
When they occurred in the past, the Taiwan Stock Exchange Index often rallied over the next few weeks:

Sorry, you don't have access to this report

Upgrade your subscription plan to get access
Go to Dasboard
PRODUCTS
SentimenTrader
Trading Tools
Indicators & Data API
‍
Strategies & Scanner
‍
Research Reports
FREE
RESOUrCES
Simple Backtest
Calculator
Simple Seasonality
Calculator
The Kelly Criterion
Calculator
Sentiment Geo Map
‍
Public Research Reports
‍
Pricing
Bundle pricing
‍
Announcements
‍
FAQ
COMPANY
‍
About
‍
In the News
‍
Testimonials
‍
Client Success Stories
CONTACT
‍
General Inquiries
‍
Media Inquiries
‍
Financial Professionals Inquiries
‍
© 2025 Sundial Capital Research Inc. All rights reserved.
Setsail Marketing
TermsPrivacyAffiliate Program
Risk Disclosure: Futures and forex trading contains substantial risk and is not for every investor. An investor could potentially lose all or more than the initial investment. Risk capital is money that can be lost without jeopardizing ones’ financial security or life style. Only risk capital should be used for trading and only those with sufficient risk capital should consider trading. Past performance is not necessarily indicative of future results.

Hypothetical Performance Disclosure: Hypothetical performance results have many inherent limitations, some of which are described below. No representation is being made that any account will or is likely to achieve profits or losses similar to those shown; in fact, there are frequently sharp differences between hypothetical performance results and the actual results subsequently achieved by any particular trading program. One of the limitations of hypothetical performance results is that they are generally prepared with the benefit of hindsight. In addition, hypothetical trading does not involve financial risk, and no hypothetical trading record can completely account for the impact of financial risk of actual trading. for example, the ability to withstand losses or to adhere to a particular trading program in spite of trading losses are material points which can also adversely affect actual trading results. There are numerous other factors related to the markets in general or to the implementation of any specific trading program which cannot be fully accounted for in the preparation of hypothetical performance results and all which can adversely affect trading results.

Testimonial Disclosure: Testimonials appearing on this website may not be representative of other clients or customers and is not a guarantee of future performance or success.