Products
SentimenTrader Trading Tools
‍
Backtest Engine
My Trading Toolkit
Correlation Analysis
Seasonality
Market Prediction
Indicators & Data API
‍
Proprietary Indicators & Charts
Market Data API
Strategies & Scanner
‍
50+ Trading Strategies
Smart Stock Scanner
Smart Option Scanner
Research Reports
‍
Research Solutions
Reports Library
Free Resources
Simple Backtest Calculator
Simple Seasonality Calculator
The Kelly Criterion Calculator
Sentiment Geo Map
Public Research Reports
Education
Sentiment Indicators
Technical Indicators
Pricing
Company
About
In the News
Testimonials
Client Success Stories
Contact
Log inLoginSign up
< BACK TO ALL REPORTS

What I'm looking at - Cass Freight Index, strength of the trend, more breadth, Put/Call

Troy Bombardia
2020-01-16

Here's what I'm looking at:


Trade war data

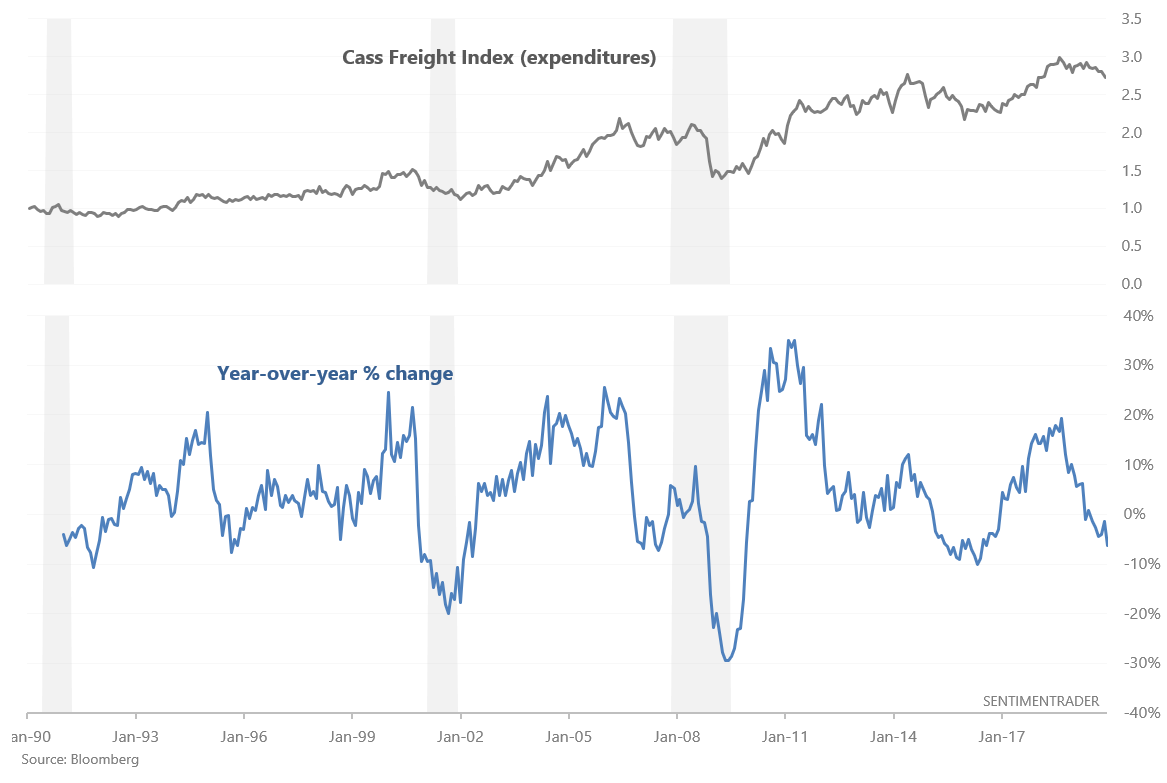
With the U.S. and China having signed a trade deal, it'll be interesting to see if manufacturing and trade-related economic data will turnaround in 2020. Thusfar it has not. The Cass Freight Index (Expenditures), which measures North American freight expenditures, has fallen more than -6% over the past year:

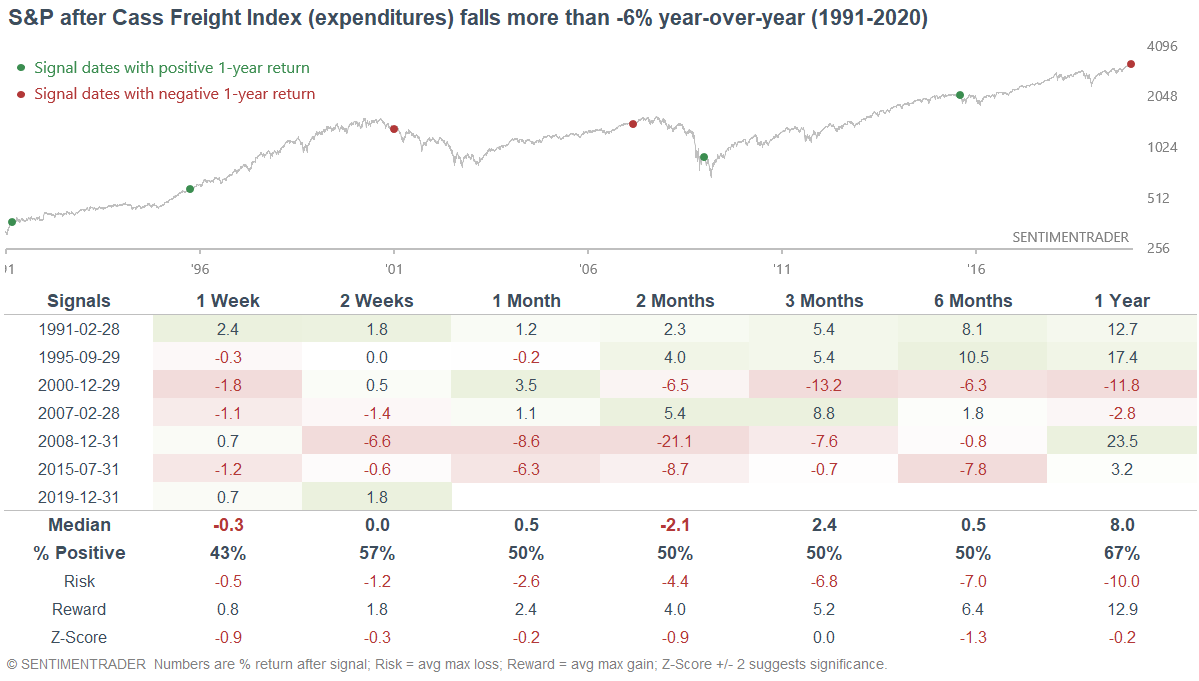
This may seem alarming, because this typically happened in an earnings recession or economic recession. However, it isn't a clear bearish sign because it can also occur towards the end of a period of economic weakness (see 1991 and 1995 cases). So while the S&P's forward returns weren't terrific, they weren't terrible either.

Overall, manufacturing and trade-related data remains weak. Perhaps this is due to the ongoing effects of the trade war. Either way, these sets of economic data are not the best leading economic indicators, hence why I am not too concerned about them.


Strength of the trend on every time frame

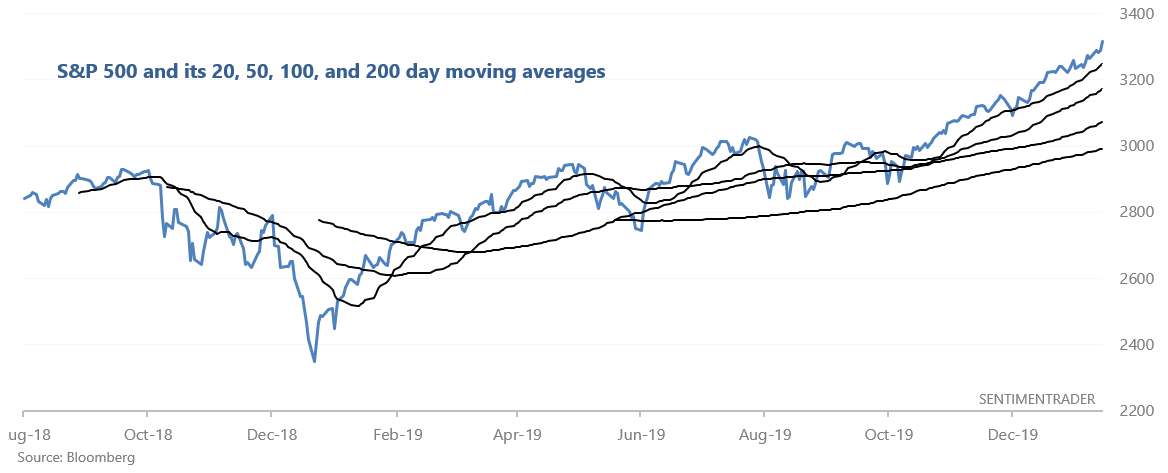
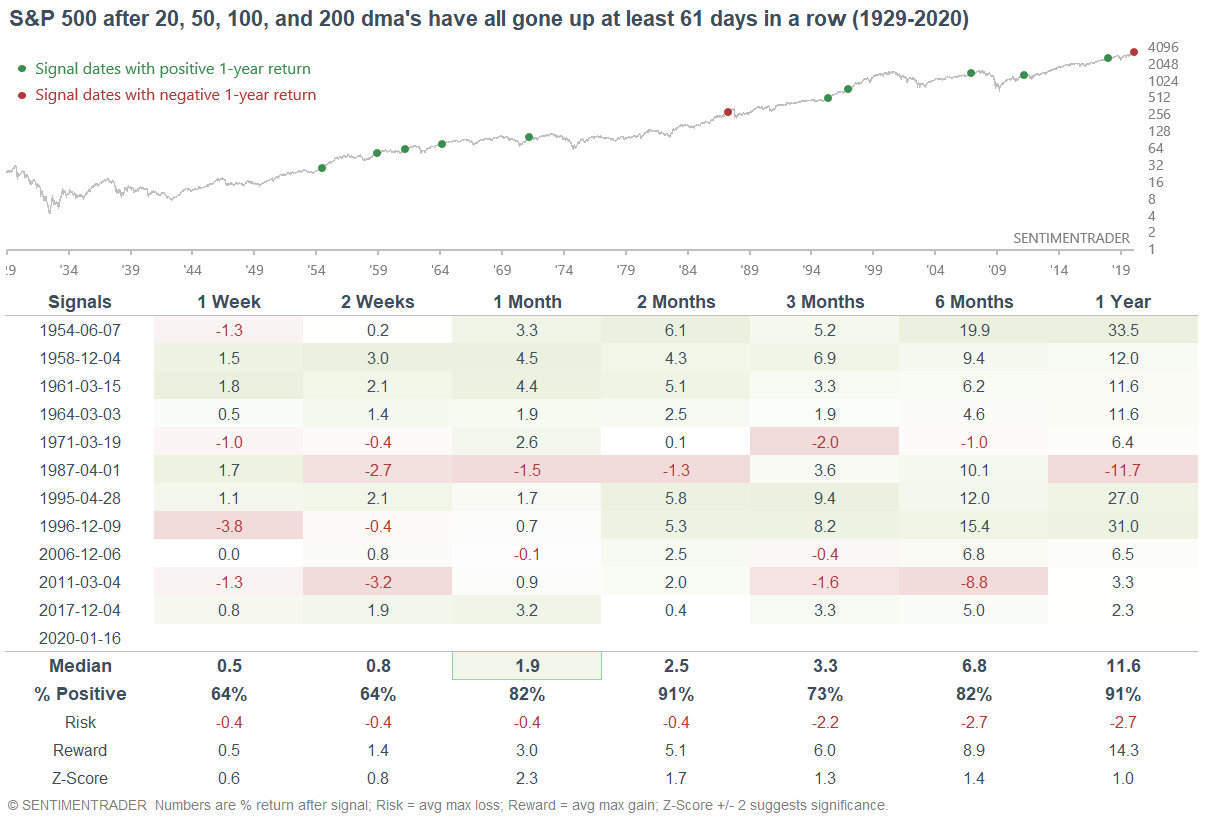
The U.S. stock market's rally over the past 3 months has not seen any meaningful pullback. As a result, various moving averages have all been consistently trending higher. For example, the S&P's 20 dma has gone up 61 days in a row, the 50 dma has gone up 67 days in a row, the 100 dma has gone up 97 days in a row, and the 200 dma has gone up 148 days in a row. All in all, it's rare for a rally to be so consistent on multiple times frames. 

When the rally was this consistent in the past, the S&P's returns over the next few months were mostly bullish. This tends to be a feature of momentum studies, which can conflict with sentiment from time to time.


Strong breadth (continued)

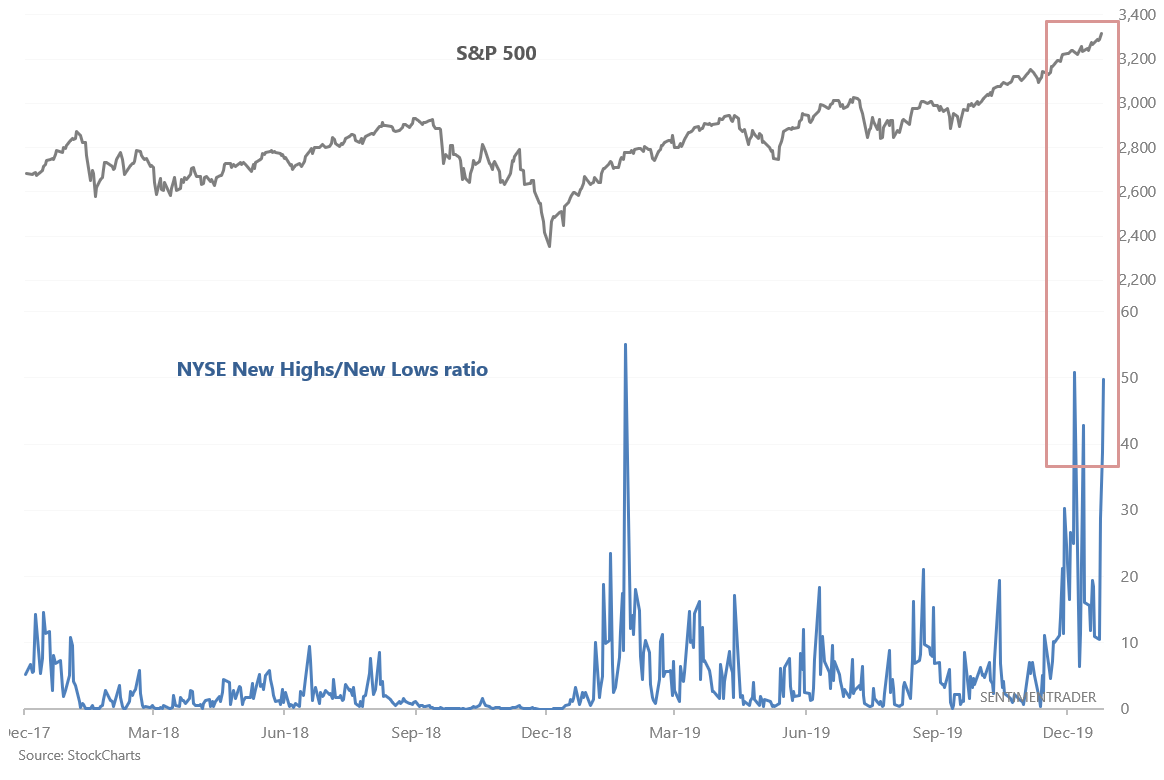
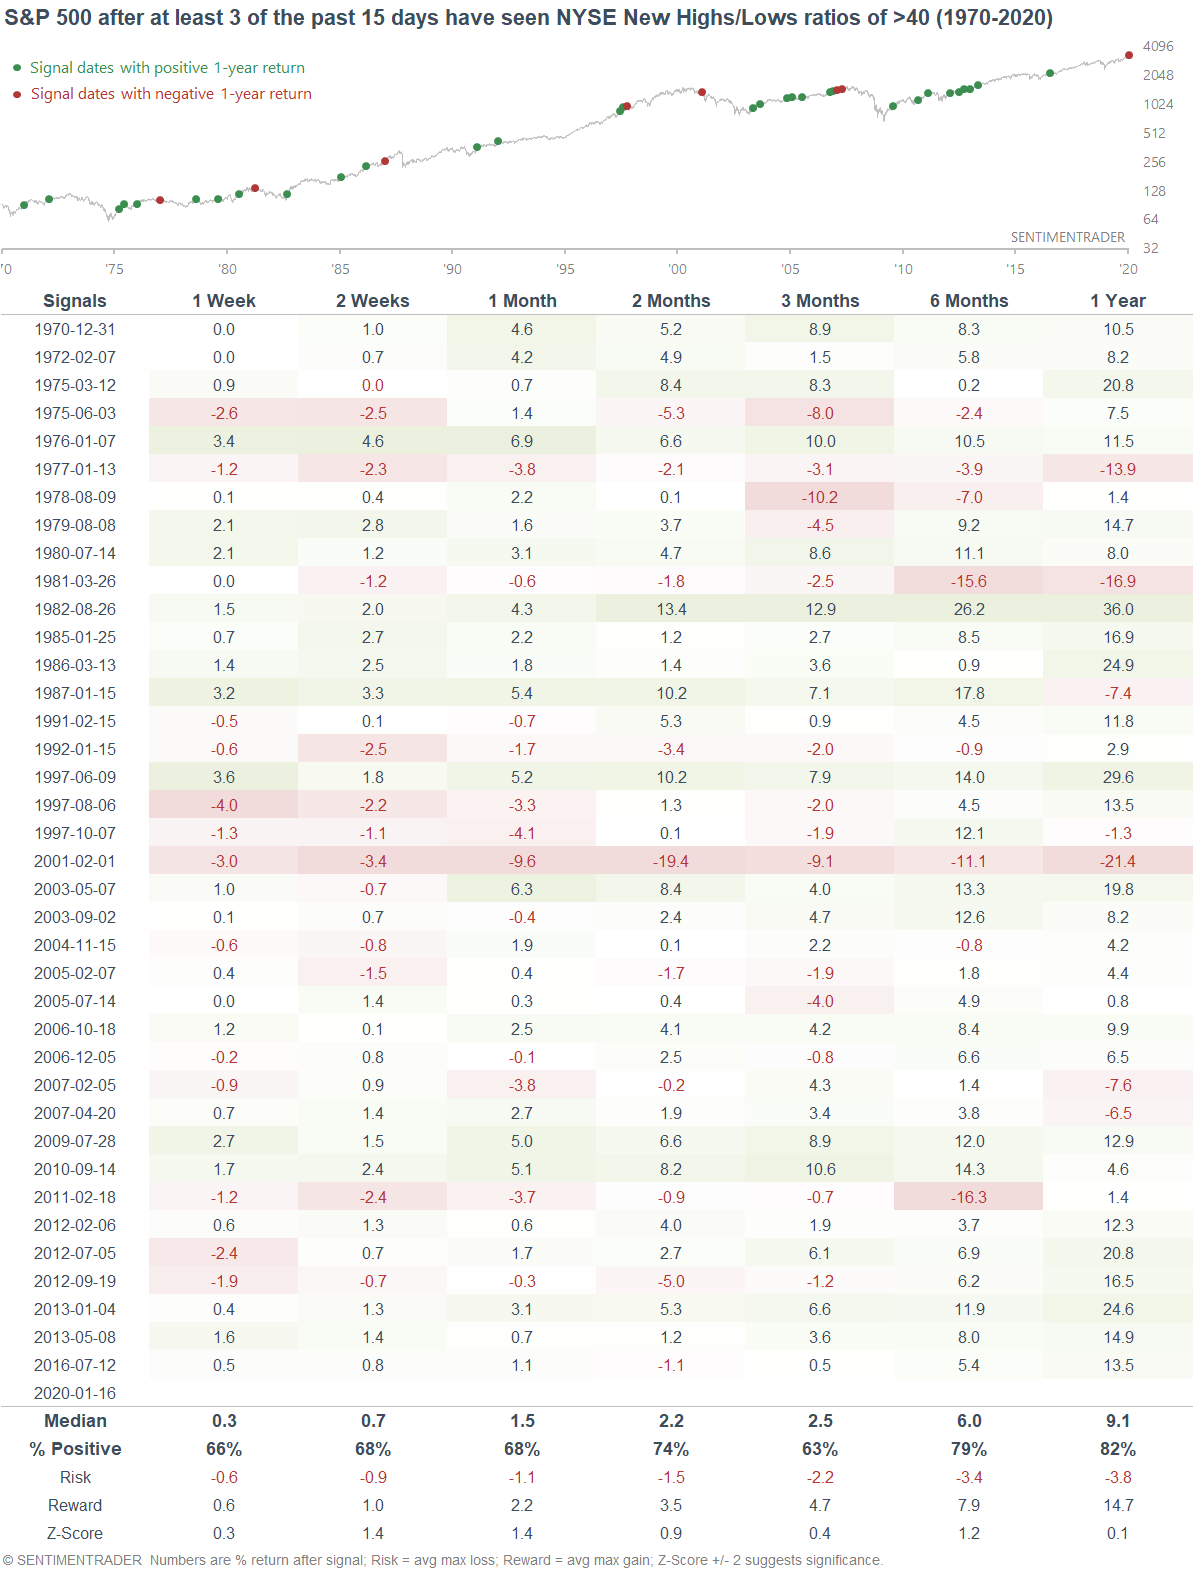
As stocks continue to jump higher, a large number of issues continue to make new 52 week highs compared to the number of issues making new 52 week lows.

When many securities continued to jump to new highs in the past, the S&P's returns over the next 6 months were more bullish than random. However, this wasn't a decisive all-clear sign though, since it did happen occasionally near market tops (particularly in the 1970s when the stock market was trending sideways for a decade).


Equity Put/Call

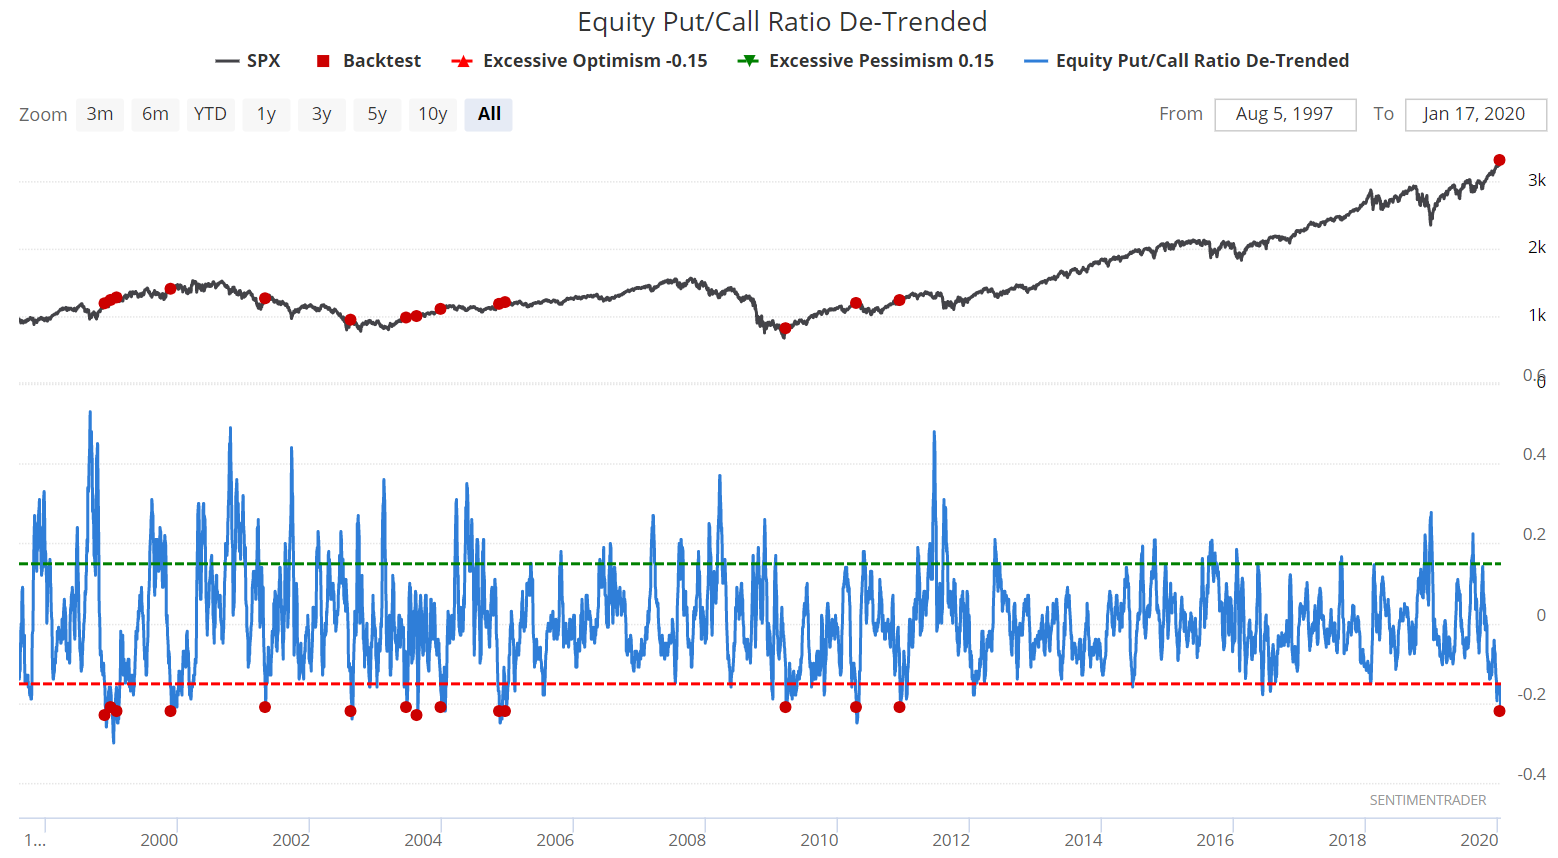
And at the risk of sounding repetitive, sentiment remains extremely optimistic. The de-trended Equity Put/Call, which compares the put/call ratio's 10 dma against its 6 month average, has now dropped below -0.21. This level was last reached almost 10 years ago in 2010:

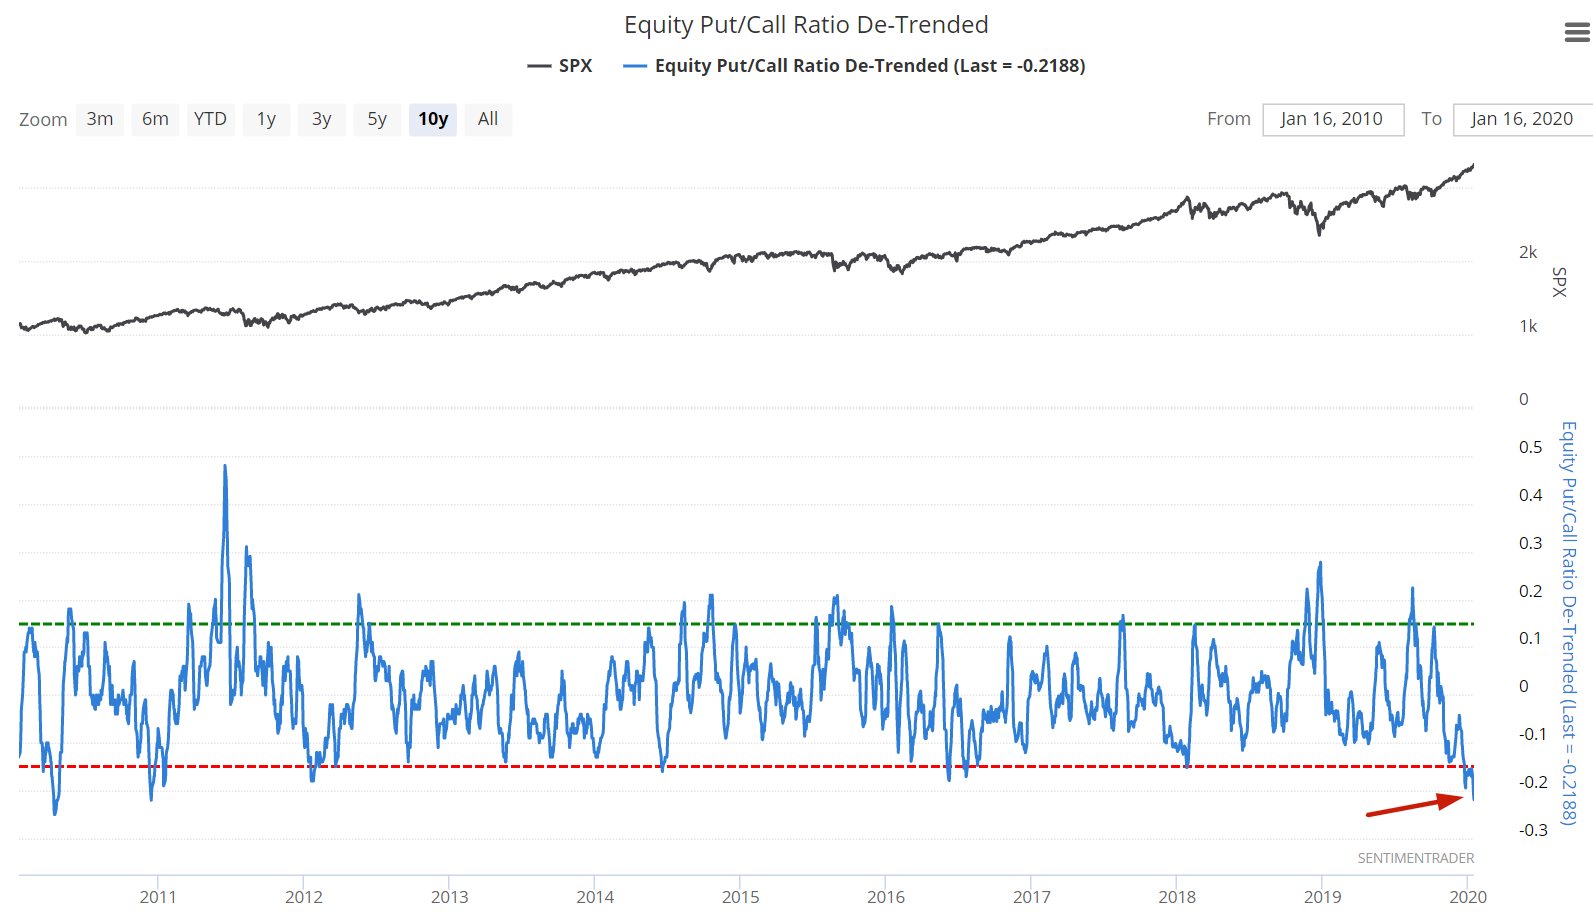
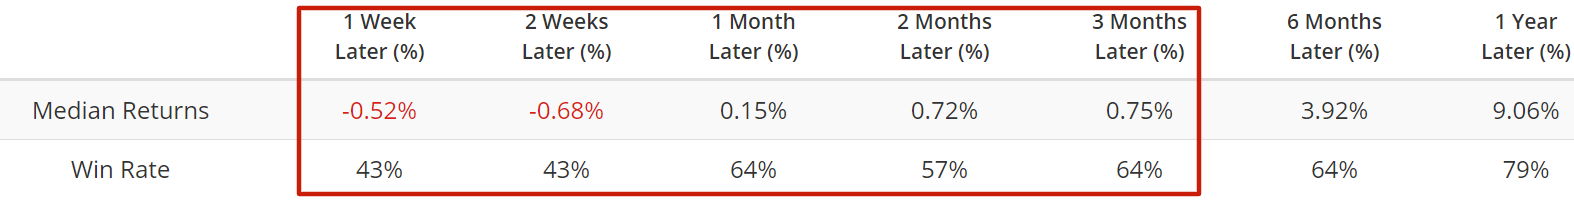
When the de-trended Equity Put/Call ratio was this low in the past, the S&P's returns over the next few weeks and months were worse than random (if we look for unique cases over a 1 month period):

PRODUCTS
SentimenTrader
Trading Tools
Indicators & Data API
‍
Strategies & Scanner
‍
Research Reports
FREE
RESOUrCES
Simple Backtest
Calculator
Simple Seasonality
Calculator
The Kelly Criterion
Calculator
Sentiment Geo Map
‍
Public Research Reports
‍
Education
Sentiment Indicators
‍
Technical Indicators
‍
Pricing
Bundle pricing
‍
FAQ
‍
Announcements
‍
COMPANY
‍
About
‍
In the News
‍
Testimonials
‍
Client Success Stories
CONTACT
‍
General Inquiries
‍
Media Inquiries
‍
Financial Professionals Inquiries
‍
© 2026 Sundial Capital Research Inc. All rights reserved.
Setsail Marketing
TermsPrivacyAffiliate Program
Risk Disclosure: The information and tools provided are for research and analytical purposes only and are not intended as investment advice. Market analysis involves uncertainty, and outcomes may differ from expectations. Users should conduct their own due diligence and consider their individual circumstances before making any financial decisions. Past performance is not necessarily indicative of future results.

Hypothetical Performance Disclosure: Hypothetical performance results have many inherent limitations, some of which are described below. No representation is being made that any account will or is likely to achieve profits or losses similar to those shown; in fact, there are frequently sharp differences between hypothetical performance results and the actual results subsequently achieved by any particular trading program. One of the limitations of hypothetical performance results is that they are generally prepared with the benefit of hindsight. In addition, hypothetical trading does not involve financial risk, and no hypothetical trading record can completely account for the impact of financial risk of actual trading. for example, the ability to withstand losses or to adhere to a particular trading program in spite of trading losses are material points which can also adversely affect actual trading results. There are numerous other factors related to the markets in general or to the implementation of any specific trading program which cannot be fully accounted for in the preparation of hypothetical performance results and all which can adversely affect trading results.

Testimonial Disclosure: Testimonials appearing on this website may not be representative of other clients or customers and is not a guarantee of future performance or success.