Data &
Technology
Research
Reports
Report Solutions
Reports Library
Actionable
Strategies
Free
Resources
Simple Backtest Calculator
Simple Seasonality Calculator
The Kelly Criterion Calculator
Sentiment Geo Map
Public Research Reports
Free Webinar
Pricing
Company
About
Meet Our Team
In the News
Testimonials
Client Success Stories
Contact
Log inLoginSign up
< BACK TO ALL REPORTS

What I'm looking at - Building Permits, VIX Put/Call, long term breadth, high yield bonds, Value vs. Growth

Troy Bombardia
2019-11-21
null

Here's what I'm looking at:


Building Permits

Building Permits made a new high for this economic expansion. Building Permits is one of 3 indicators that the Macro Index includes, and its year-over-year % change has risen to 14%: 

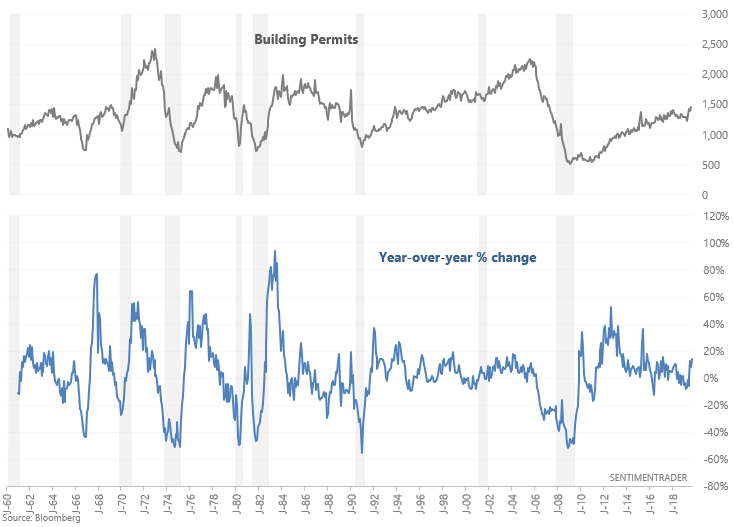
This isn't how recessions start, and it isn't usually how bear markets start. The following table demonstrates every case in which the 1 year % change rose above 14%:

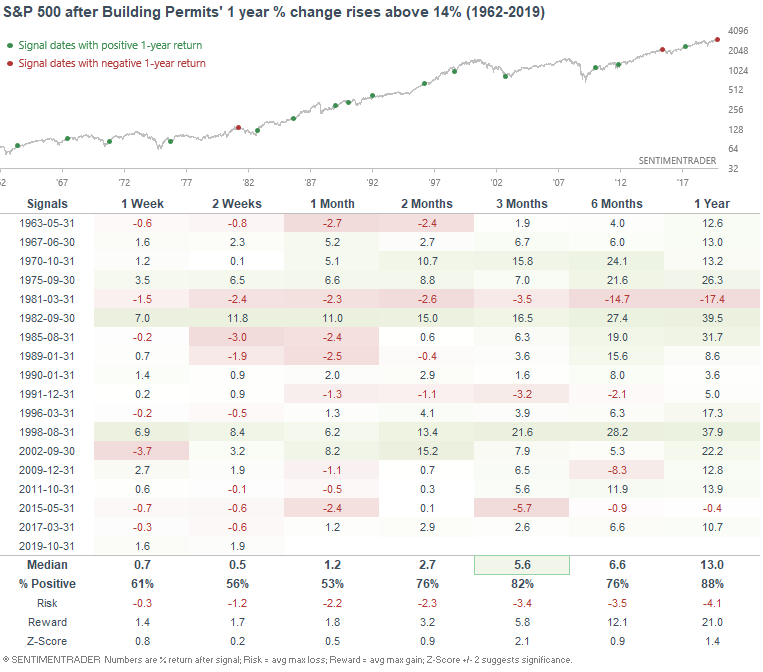
I wouldn't quite use this on a 3 month basis, but I would consider this to be bullish for stocks over a 6-12 month basis. Housing is a key leading sector of the economy.


VIX Put/Call

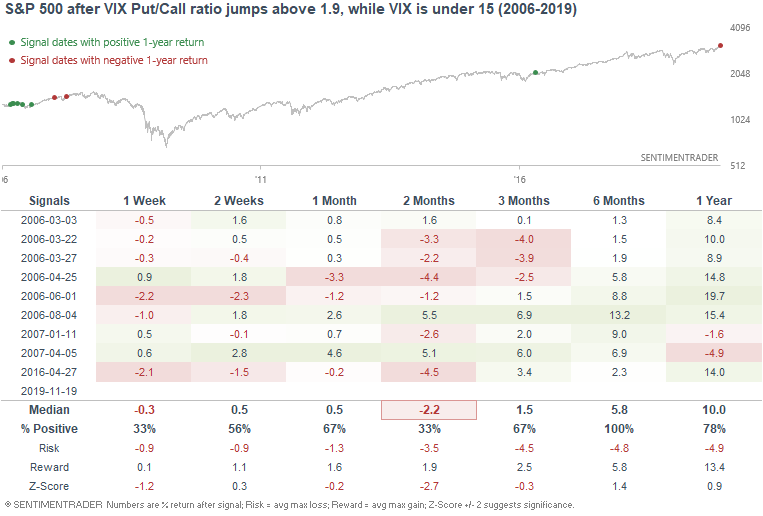
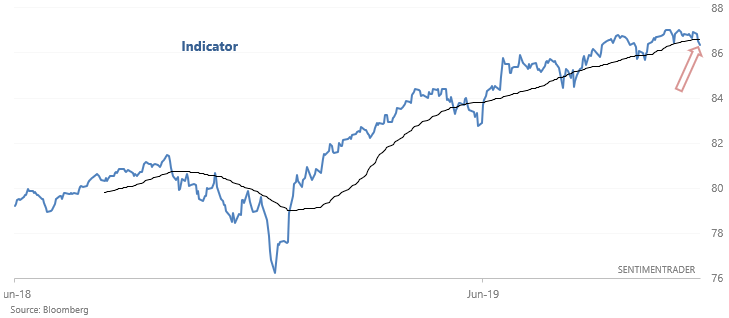
The VIX Put/Call ratio spiked on Tuesday to 1.98:

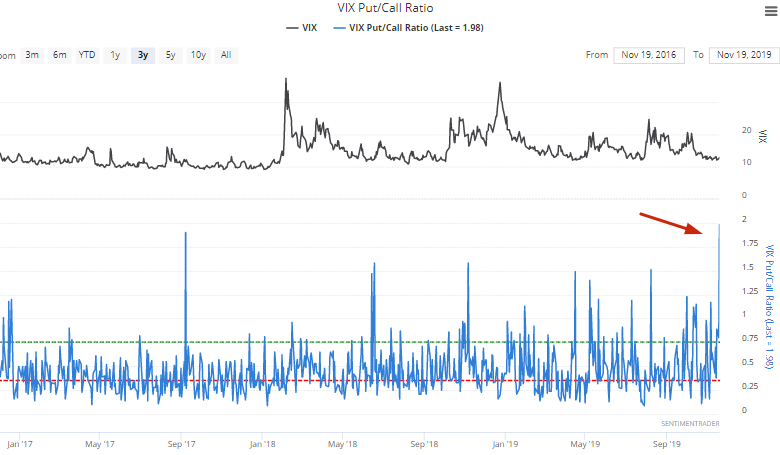
When VIX is low (e.g. under 15), this has typically been a bearish sign for the S&P 500 over the next 2 months (even when stocks are in a long term uptrend):

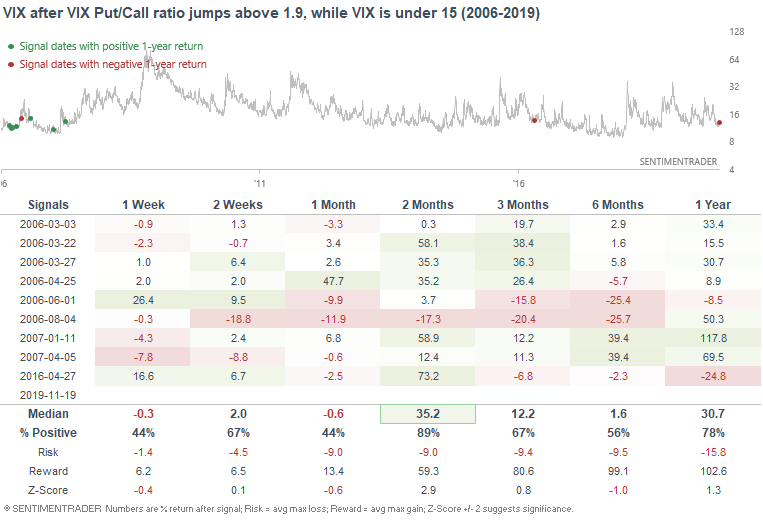
And it has typically been a bullish sign for VIX over the next 2 months:


Long term breadth

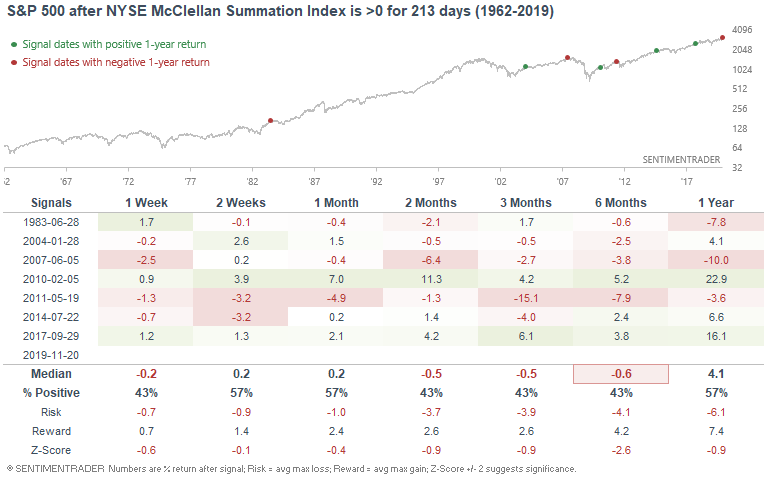
The stock market's rally has been extremely powerful this year, causing long term momentum (McClellan Summation) to consistently stay above zero. The last time such a streak existed was towards the end of 2017, just before stocks surged and then struggled over the next year:

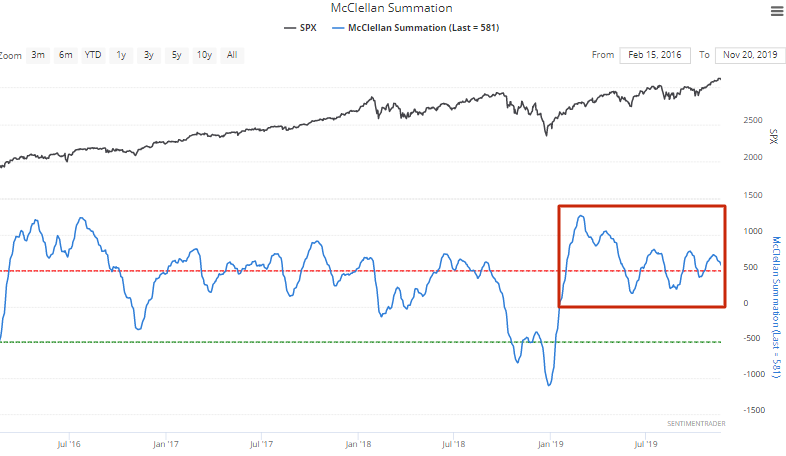
When it reached this point, things were pretty overdone:

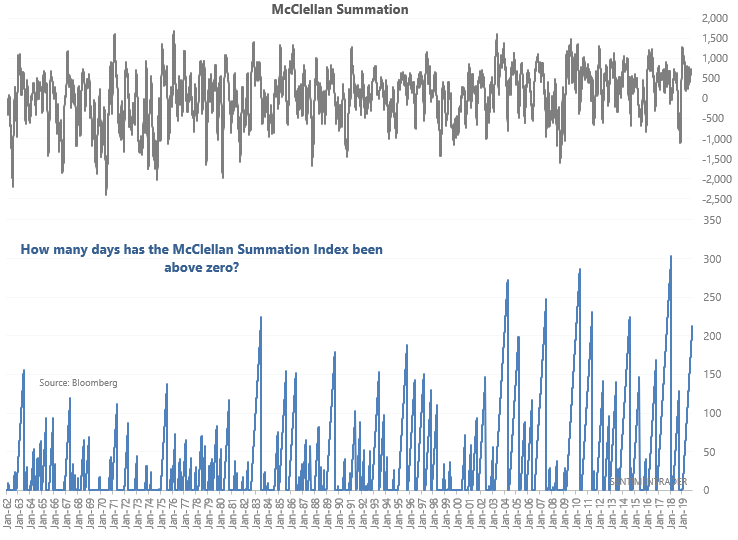
As you would expect, the stock market often struggled over the next few months. Strong rallies typically do not go on forever without taking a prolonged breather (volatility, corrections etc) along the way:


High yield bonds

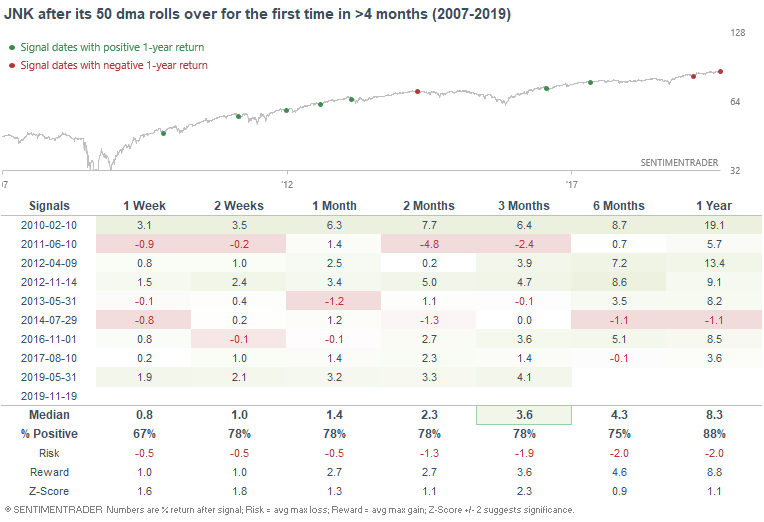
While stocks have been rallying this year, high yield bonds (along with REITs and other interest rate sensitive asset classes) have been rallying even more persistently. JNK's 50 dma had been trending up the entire year, until now:

As is typical with momentum, the first change in the trend is usually followed by a continuation of the prior trend. So perhaps high yield bonds will pullback. But more often than not, JNK tends to rally higher over the next few months:
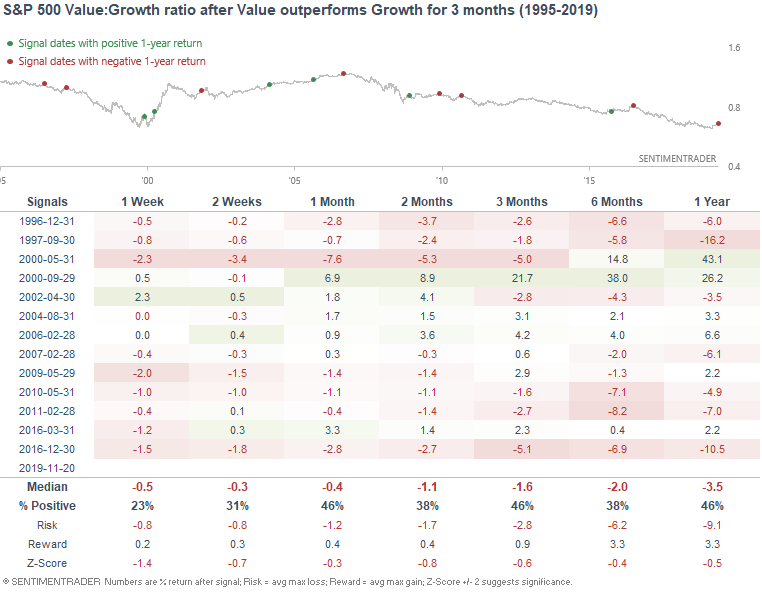

Value - Growth

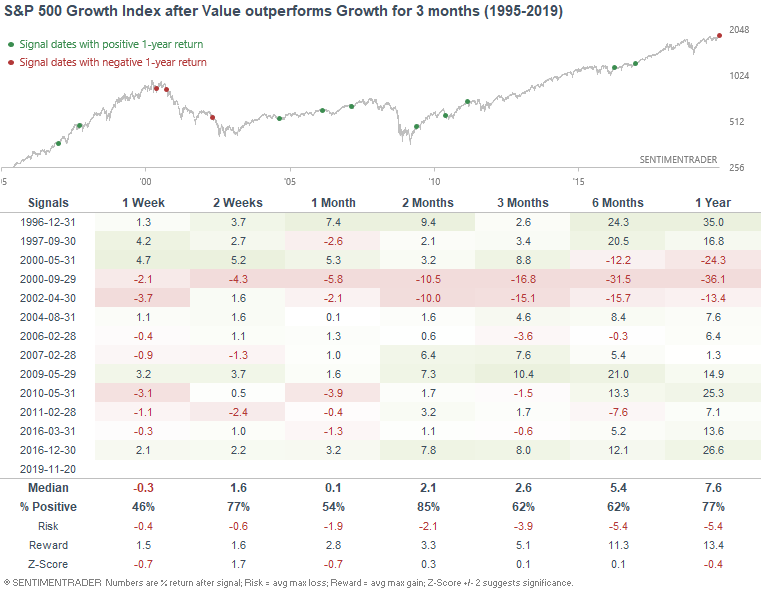
As Bloomberg TV noted, the S&P 500 Value Index is on the verge of outperforming the S&P 500 Growth Index for the 3rd month in a row:

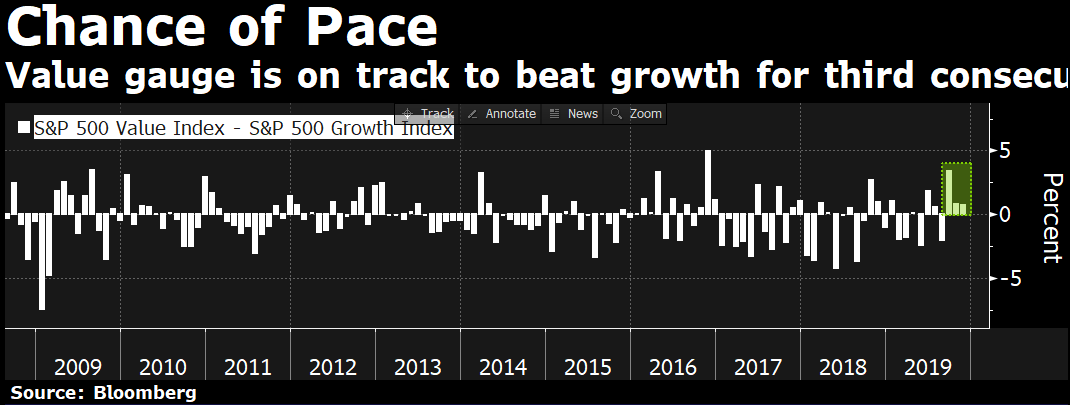
Such outperformance is almost always followed by underperformance in Value in the short term (see 1-2 weeks):

*Keep in mind that this won't be triggered until November is over.

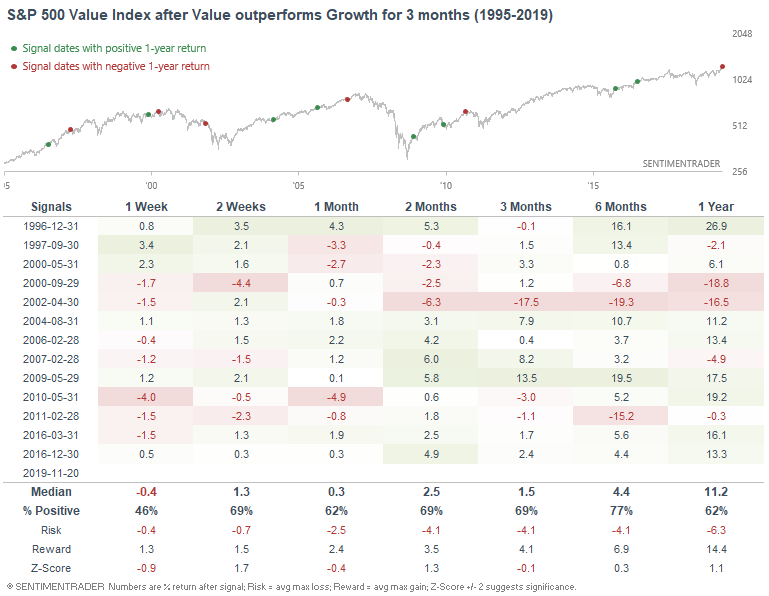
Here's what the S&P 500 Value Index did next:

Here's what the S&P 500 Growth Index did next:

Sorry, you don't have access to this report

Upgrade your subscription plan to get access
Go to Dasboard
DATA &
TECHnologies
IndicatorEdge
‍
BackTestEdge
‍
Other Tools
‍
DataEdge API
RESEARCH
reports
Research Solution
‍
Reports Library
‍
actionable
Strategies
Trading Strategies
‍
Smart Stock Scanner
‍
FREE
RESOUrCES
Simple Backtest
Calculator
Simple Seasonality
Calculator
The Kelly Criterion
Calculator
Sentiment Geo Map
‍
Public Research Reports
‍
Free Webinar
COMPANY
‍
About
‍
Meet our Team
‍
In the News
‍
Testimonials
‍
Client Success Stories
Pricing
Bundle pricing
‍
Announcements
‍
FAQ
© 2024 Sundial Capital Research Inc. All rights reserved.
Setsail Marketing
TermsPrivacyAffiliate Program
Risk Disclosure: Futures and forex trading contains substantial risk and is not for every investor. An investor could potentially lose all or more than the initial investment. Risk capital is money that can be lost without jeopardizing ones’ financial security or life style. Only risk capital should be used for trading and only those with sufficient risk capital should consider trading. Past performance is not necessarily indicative of future results.

Hypothetical Performance Disclosure: Hypothetical performance results have many inherent limitations, some of which are described below. No representation is being made that any account will or is likely to achieve profits or losses similar to those shown; in fact, there are frequently sharp differences between hypothetical performance results and the actual results subsequently achieved by any particular trading program. One of the limitations of hypothetical performance results is that they are generally prepared with the benefit of hindsight. In addition, hypothetical trading does not involve financial risk, and no hypothetical trading record can completely account for the impact of financial risk of actual trading. for example, the ability to withstand losses or to adhere to a particular trading program in spite of trading losses are material points which can also adversely affect actual trading results. There are numerous other factors related to the markets in general or to the implementation of any specific trading program which cannot be fully accounted for in the preparation of hypothetical performance results and all which can adversely affect trading results.

Testimonial Disclosure: Testimonials appearing on this website may not be representative of other clients or customers and is not a guarantee of future performance or success.