Products
SentimenTrader Trading Tools
‍
Backtest Engine
My Trading Toolkit
Correlation Analysis
Seasonality
Market Prediction
Indicators & Data API
‍
Proprietary Indicators & Charts
Market Data API
Strategies & Scanner
‍
50+ Trading Strategies
Smart Stock Scanner
Smart Option Scanner
Research Reports
‍
Research Solutions
Reports Library
Free Resources
Simple Backtest Calculator
Simple Seasonality Calculator
The Kelly Criterion Calculator
Sentiment Geo Map
Public Research Reports
Education
Sentiment Indicators
Technical Indicators
Pricing
Company
About
In the News
Testimonials
Client Success Stories
Contact
Log inLoginSign up
< BACK TO ALL REPORTS

What, if anything, are rising Treasury yields signaling

Dean Christians
2024-04-15
Treasury yields are once again breaking out across the curve amidst enduring uptrends. Historically, an expansion in new highs has signaled further upside pressure in yields over the medium term, exerting downward pressure on stocks within that timeframe.

Key points:

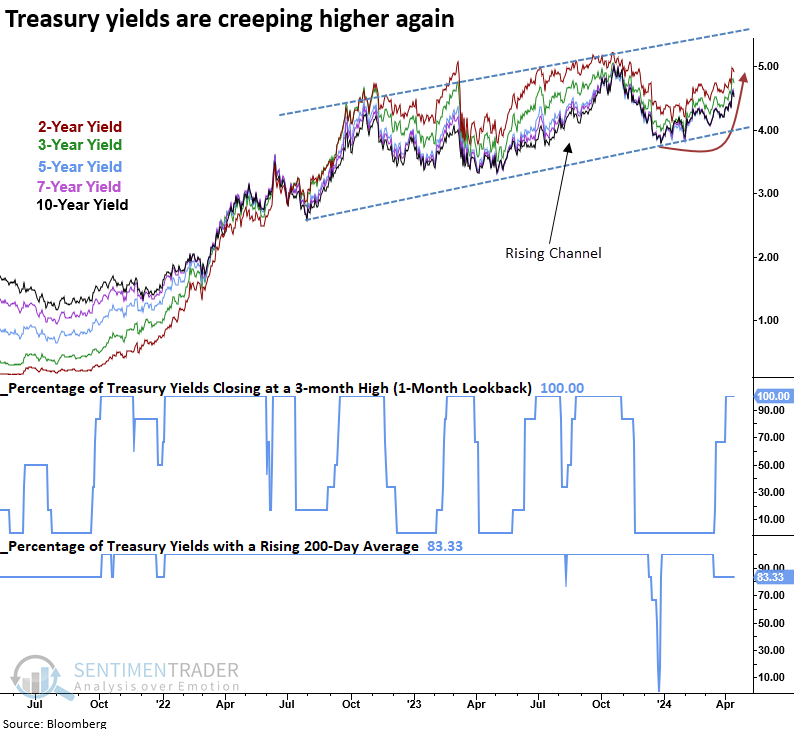
  • Every single Treasury yield, ranging from two to ten years, closed at a 3-month high
  • Similar breakouts in yields suggest interest rates could continue to creep higher
  • Stocks tended to struggle when yields across the curve break out on a medium-term basis    

Keep an eye on interest rates

After reaching a peak in autumn 2023, Treasury yields steadily declined for several months. The easing in rates spurred a surge in risk appetite, leading to a fervent rally in stocks.

With economic activity showing resilience and consumer inflation stabilizing, interest rates began to inch upwards once more, reaching a climax last week as Treasury yields spanning 2 to 10 years hit their highest levels in three months.

The previous yield breakout occurred in June 2023, one month before a peak in equity indexes, culminating in a 10% correction in the world's most benchmarked index.

Treasury yield breakouts set the stage for higher rates over the medium-term

When every single Treasury yield ranging from two to ten years closed at a three-month high, with four out of five yields exhibiting a rising 200-day average, the 10-year yield tended to rise further, especially over the ensuing three months.

After the June 2023 signal, the 10-year yield climbed 73 basis points in three months, the most significant increase over that period since 1984.

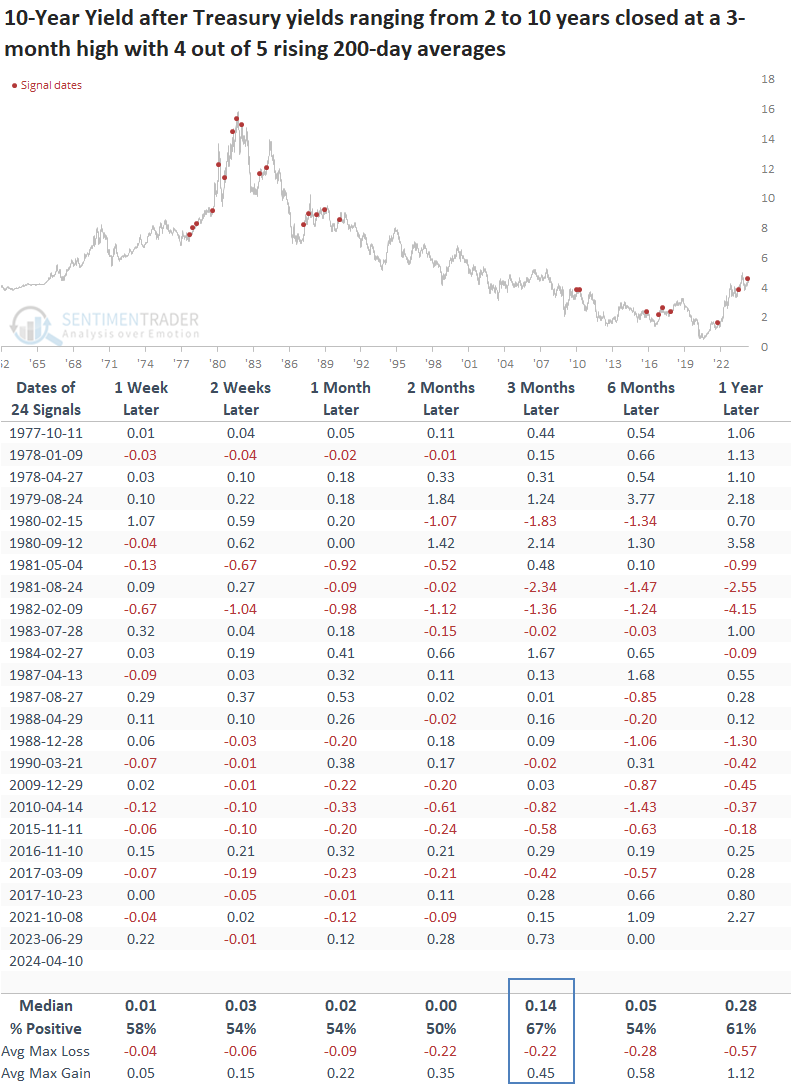
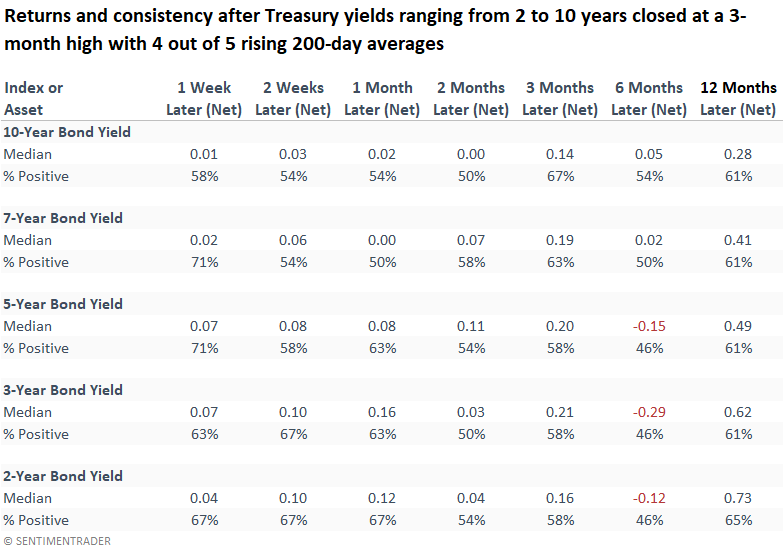
Following a breakout in Treasury yields, it was customary to observe additional upside follow-through in rates across the entire curve over a medium-term horizon.

With rates potentially drifting higher, stocks could struggle 

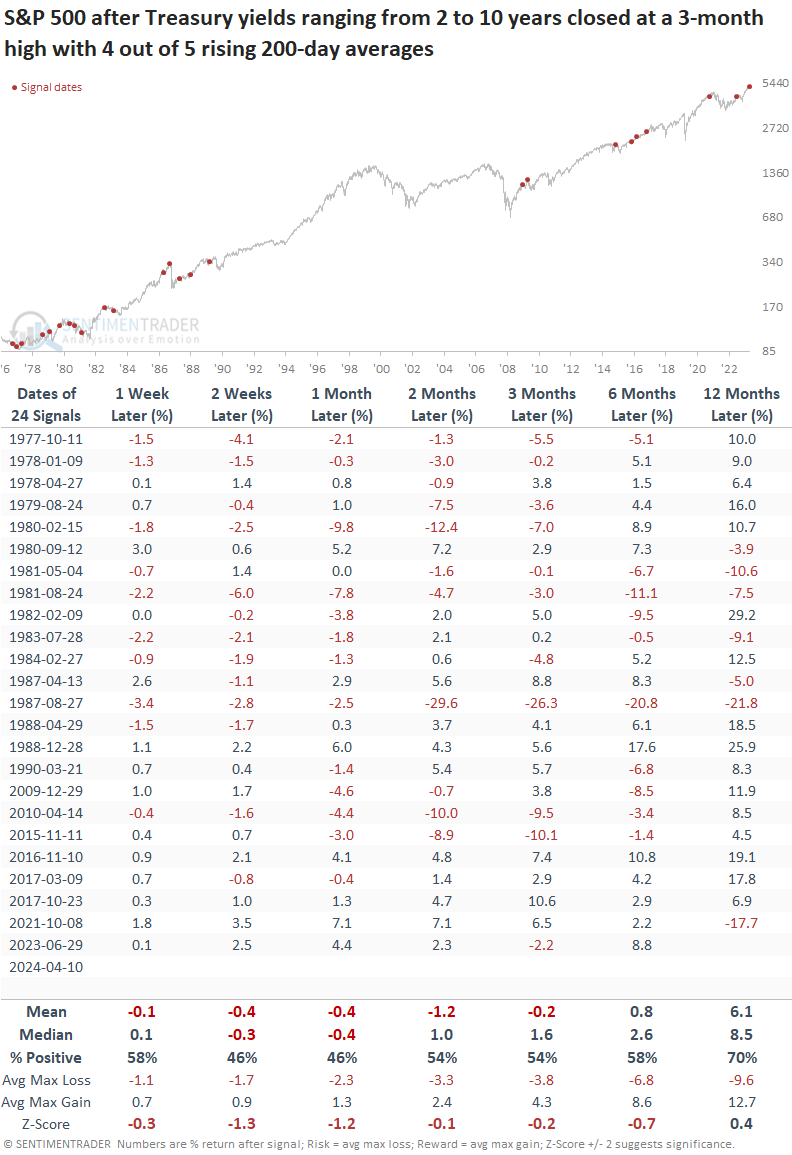
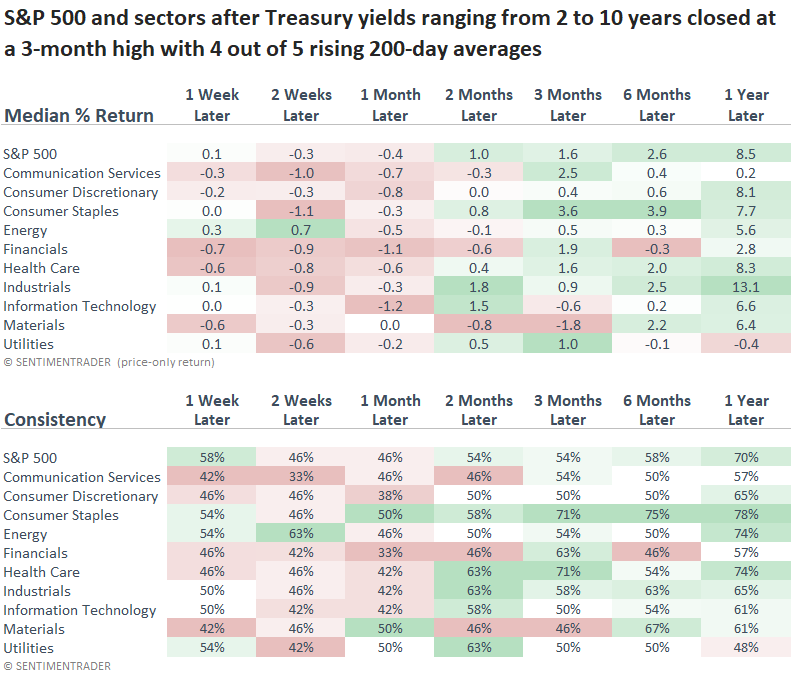
With interest rates showing a propensity to rise further over the medium term after similar breakouts, history suggests the S&P 500 could struggle over that same time frame. 

Following the June 2023 signal, the S&P 500 continued its upward trajectory for another month. However, investors eventually heeded the warning sign from rates, leading to a 10% correction in the world's most benchmarked index. 

Consumer Staples, a defensive sector, outperformed all other groups over the subsequent three months. Once stocks adjusted to the higher rate environment, often a sign of improving economic activity, Industrials outpaced all other groups a year later.

Bond Strategies

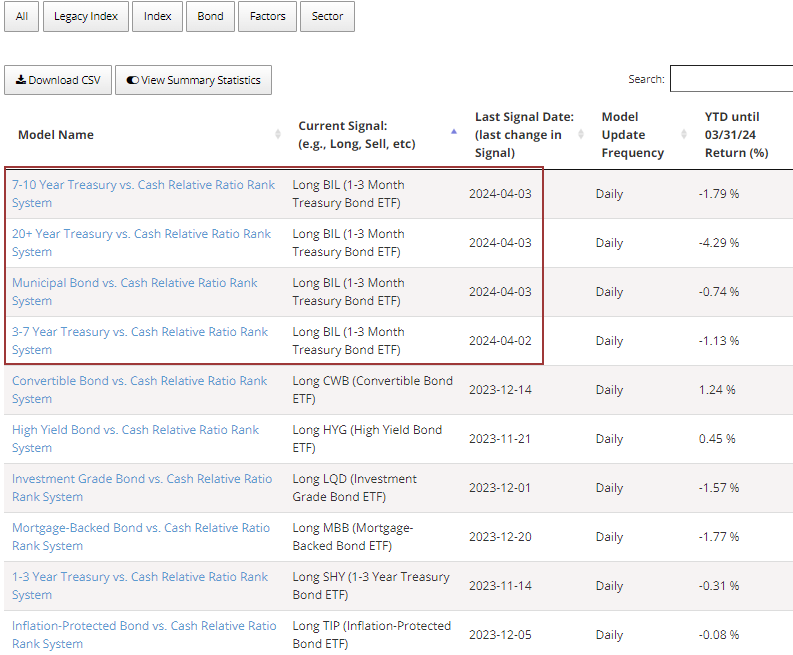
In a recent research report, I highlighted that the 3 to 7-year Treasury relative strength strategy had rotated to cash. Since that publication, several other models have shifted in favor of a cash proxy instead of bonds. If the interest rate environment turns more hostile, cash could once again be king.

What the research tells us...

Treasury yields across the curve have drifted higher, culminating in an interest rate breakout, all within long-term uptrends in yields. Whether due to a resilient economy, a stabilization in consumer prices, or a combination of both, it's nearly impossible to pinpoint the exact cause. We'll leave the guessing game to others. What we do know based on historical data is that after similar breakouts, yields could rise over the medium term, pressuring stocks. As we've stated several times, equity indexes rarely go up in a straight line. Usually, it is two steps forward followed by one zag sideways or down, a perfectly typical scenario in bull markets.

PRODUCTS
SentimenTrader
Trading Tools
Indicators & Data API
‍
Strategies & Scanner
‍
Research Reports
FREE
RESOUrCES
Simple Backtest
Calculator
Simple Seasonality
Calculator
The Kelly Criterion
Calculator
Sentiment Geo Map
‍
Public Research Reports
‍
Education
Sentiment Indicators
‍
Technical Indicators
‍
Pricing
Bundle pricing
‍
FAQ
‍
Announcements
‍
COMPANY
‍
About
‍
In the News
‍
Testimonials
‍
Client Success Stories
CONTACT
‍
General Inquiries
‍
Media Inquiries
‍
Financial Professionals Inquiries
‍
© 2026 Sundial Capital Research Inc. All rights reserved.
Setsail Marketing
TermsPrivacyAffiliate Program
Risk Disclosure: The information and tools provided are for research and analytical purposes only and are not intended as investment advice. Market analysis involves uncertainty, and outcomes may differ from expectations. Users should conduct their own due diligence and consider their individual circumstances before making any financial decisions. Past performance is not necessarily indicative of future results.

Hypothetical Performance Disclosure: Hypothetical performance results have many inherent limitations, some of which are described below. No representation is being made that any account will or is likely to achieve profits or losses similar to those shown; in fact, there are frequently sharp differences between hypothetical performance results and the actual results subsequently achieved by any particular trading program. One of the limitations of hypothetical performance results is that they are generally prepared with the benefit of hindsight. In addition, hypothetical trading does not involve financial risk, and no hypothetical trading record can completely account for the impact of financial risk of actual trading. for example, the ability to withstand losses or to adhere to a particular trading program in spite of trading losses are material points which can also adversely affect actual trading results. There are numerous other factors related to the markets in general or to the implementation of any specific trading program which cannot be fully accounted for in the preparation of hypothetical performance results and all which can adversely affect trading results.

Testimonial Disclosure: Testimonials appearing on this website may not be representative of other clients or customers and is not a guarantee of future performance or success.