
What, if any, message does a new two-year low in the 3-year Treasury yield signal

Key points:
- The 3-year Treasury yield closed at a two-year low for the first time since registering a two-year high
- Comparable breakdowns in the 3-year Treasury yield preceded additional downside pressure in yields
- Stocks were higher from six to twelve months later, while commodities struggled
A Treasury yield, sensitive to central bank policy, falls to a two-year low
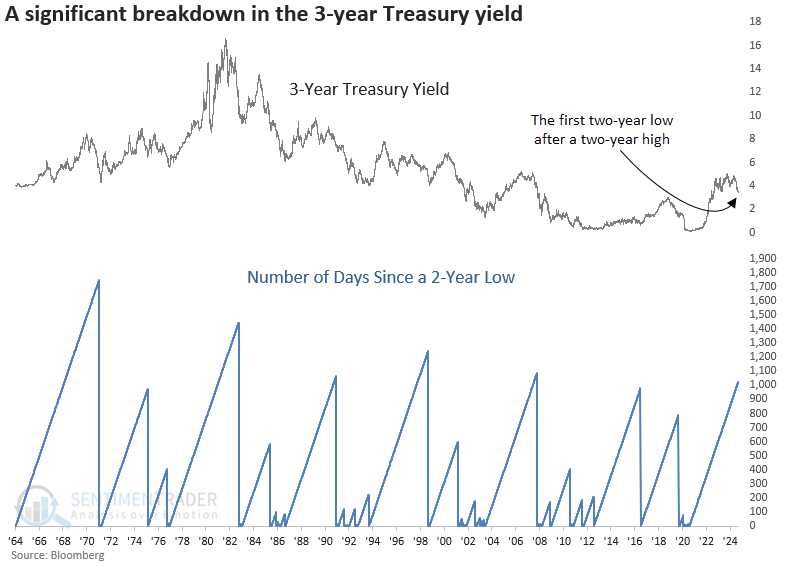
I prefer the 3-year Treasury yield over the 2-year yield because it offers a more extensive historical perspective that captures a broader portion of the last secular rise in yields, even though analysts commonly use the 2-year yield in yield curve analysis or to show that the Fed is out of sync with market expectations regarding rates.
On Tuesday, the 3-year Treasury yield fell to a new two-year low, marking its first drop to this level after reaching a two-year high and ending the 6th longest winning streak in history without a multi-year low.
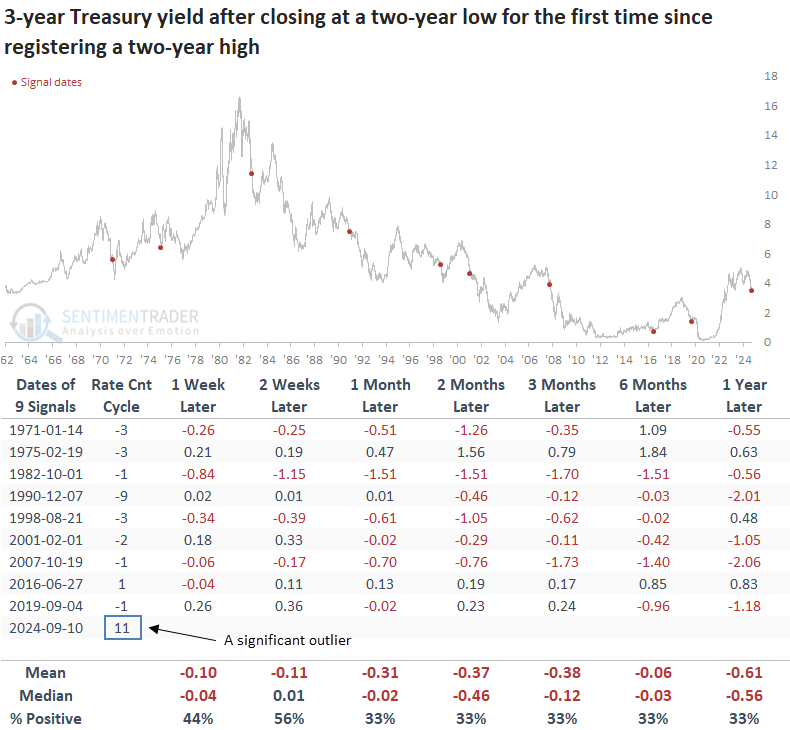
Similar declines in the 3-year Treasury yield were followed by additional downside
When the 3-year Treasury yield reached a two-year low for the first time following a two-year high, the short-term Treasury yield fell 67% of the time from one to twelve months later.
In eight of the last nine instances, the Federal Reserve cut its target rate before the two-year low in the 3-year Treasury yield. The exception was in 2016, when the Fed initiated its first rate hike in a cycle that eventually saw nine increases, making that year's yield rise a poor comparison.
With the 3-year Treasury yield falling to a two-year low as 11 interest rate hikes from the Federal Reserve remain in place, it begs the question: Is the Federal Reserve behind the curve?
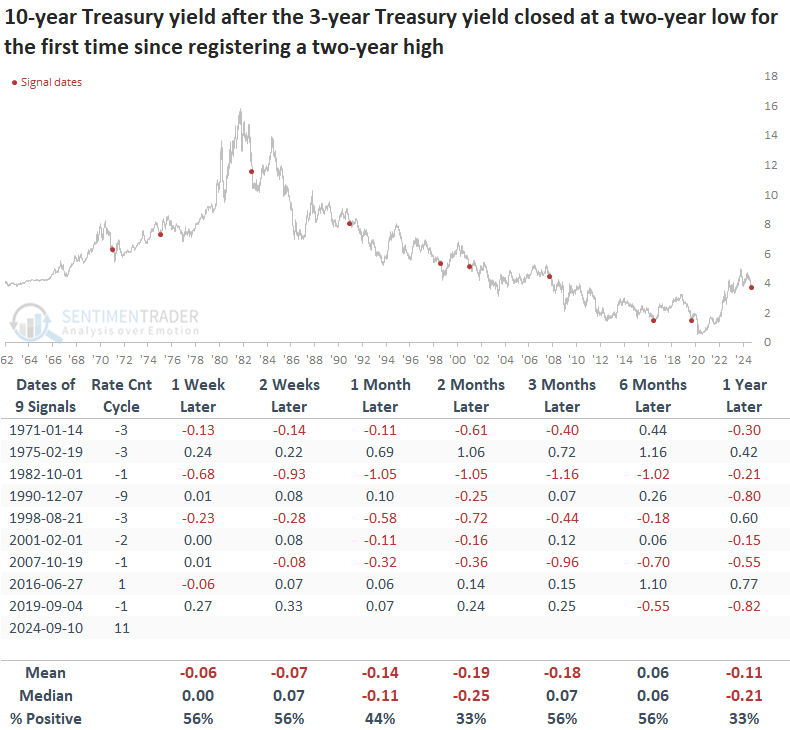
Although the 10-year Treasury yield was lower 67% of the time over the following year, the downward trajectory for the benchmark yield did not follow a consistent path like the 3-year Treasury.
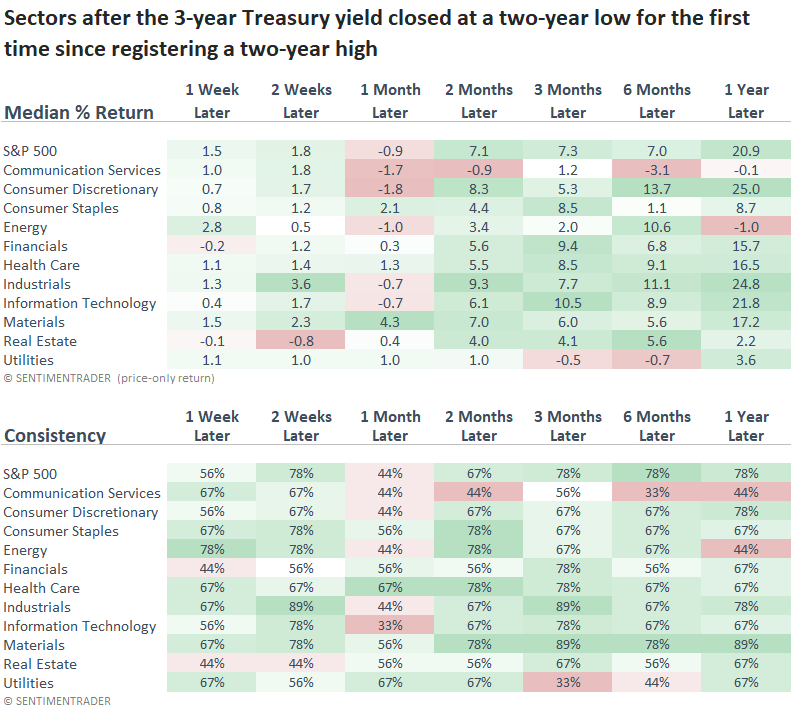
What about stocks?
Over the subsequent month, the S&P 500 and many cyclical sectors delivered lackluster returns, whereas defensive groups displayed gains, a scenario we are observing again now. However, six to twelve months later, the cyclical sectors reversed, taking the lead over defensive stocks.
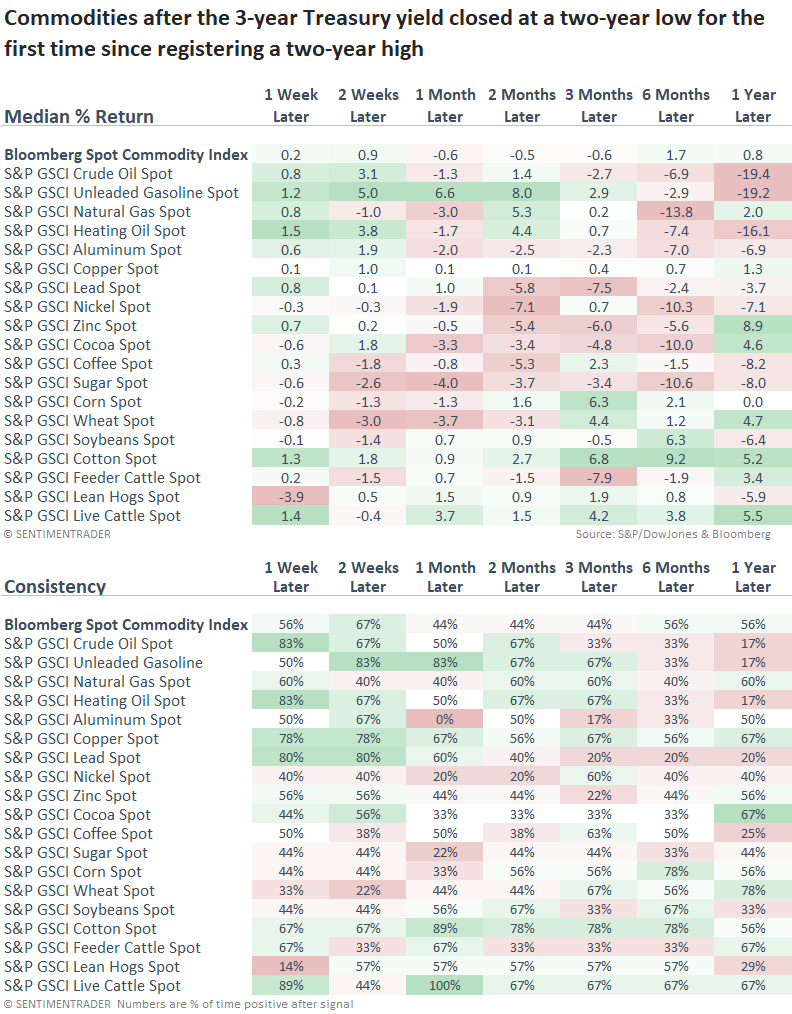
What about Commodities?
While most commodities will generally trend up or down based on individual supply and demand dynamics, some, like energy and industrial metals, can be influenced by the overall business cycle.
Following similar two-year lows in the 3-year Treasury, energy and industrial metal commodities displayed muted to negative returns over medium and long-term horizons.
Although gold is not included in the commodity table, an assessment of the precious metal did not provide a bullish or bearish edge. So, if you hold gold, the trend is your friend.
What the research tells us...
Treasury yields across the curve continue to drift lower, with the 3-year yield closing at a new two-year low, the first instance following a multi-year high. Similar breakdowns in the 3-year yield suggest it, and the 10-year yield can go lower over the subsequent year, albeit the outlook was more compelling for the short-dated Treasury. While the breakdown in the 3-year yield might raise concerns regarding economic conditions, it had a minimal impact on stocks other than a month-long consolidation. From six to twelve months later, the S&P 500 and cyclical-oriented sectors shined, most likely benefitting from a more favorable yield environment. Commodities within energy and industrial metals were weak. However, given the bullish outlook on stocks, non-economic factors must have exerted downward pressure on commodities, similar to China's impact of late.