
What history tells us about the month of September

Key points:
- September is the only month that has a negative average and median return over the last 106 years
- However, the complicating factor is that results can vary widely from year to year
- September in mid-term election years has shown worse-than-average results
- September tends to show early strength followed by significant weakness
September has historically been the weakest month for stocks
The old adage states that "In the long run, the stock market goes up." Overall, it's hard to argue with that statement. Still, the month of September has shown itself to be problematic at times. As September 2026 looms, should we be concerned? Let's consider the history.
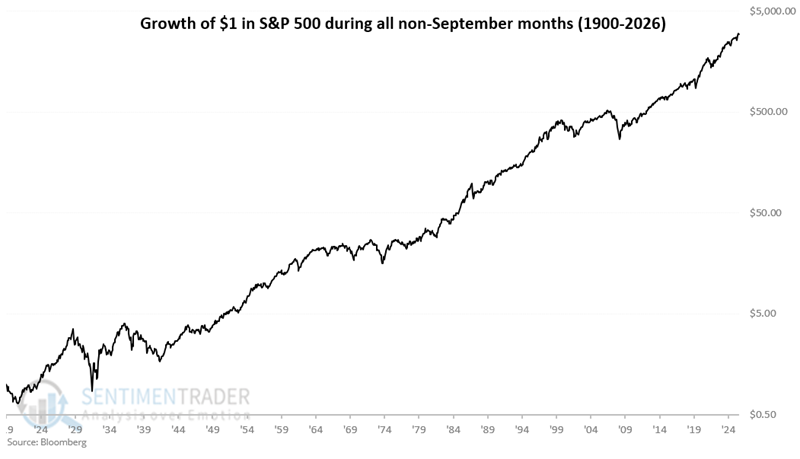
The chart below shows the hypothetical growth of $1 invested in the S&P 500 Index during all months EXCEPT September, starting in January 1920. While the results are by no means a straight-line advance, the lower-left-upper-right nature of the equity curve buttresses the adage above.
On the other hand, the chart below shows the hypothetical growth of $1 invested in the S&P 500 Index only during the month of September, also starting in 1920. Notice anything different versus the chart above?