
What History Suggests after Seven Straight Up Months

Key points
- The S&P 500 registered its seventh consecutive higher monthly close at the end of November
- Knee-jerk reaction would suggest that the best is behind us and that a pullback (or worse) may be in order
- The historical results, however, suggest strong potential for a continued - albeit less torrid - advance
The stock market has been on a tear
By rallying during the week of Thanksgiving, the S&P 500 Index managed to eke out a gain for the month of November. By doing so, the S&P 500 stretched its consecutive month winning streak to a rare seventh straight month.
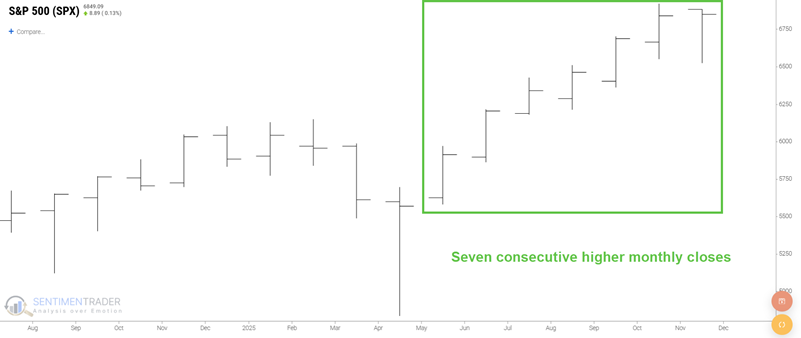
Since 1950, this is only the 17th seven-month winning streak for the index. Since everyone knows that the stock market goes up and down, the reflexive knee-jerk reaction for many individuals will be to assume that after a seven-month run sporting a total gain of 23%, the stock market is due to "cool off." And in fact, to an extent (as we will see momentarily), that is likely true. However, those who believe a meaningful decline is imminent may be surprised by the historical results following previous seven-month runs.
The history of the previous seven month runs is a bit surprising
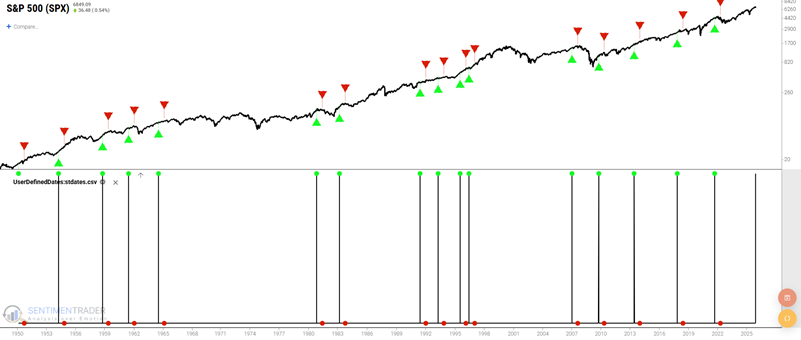
The green up arrows in the chart below highlight all 16 earlier instances where the S&P 500 closed higher for seven consecutive months. The red down arrows represent seven months after the signal dates.
The table below summarizes the results for a seven-month holding period following seven consecutive months of gains for the S&P 500.
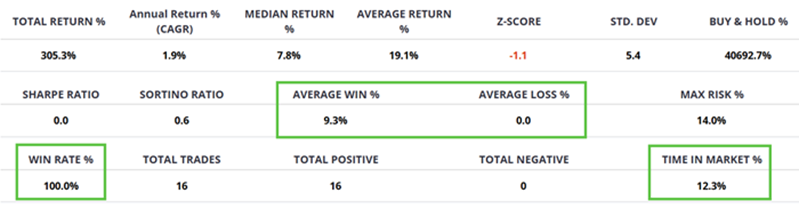
Note that this "strategy" was only in the stock market 12.3% of the time over the past 75 years. Nevertheless, the S&P 500 was higher seven months later following all sixteen previous signals.
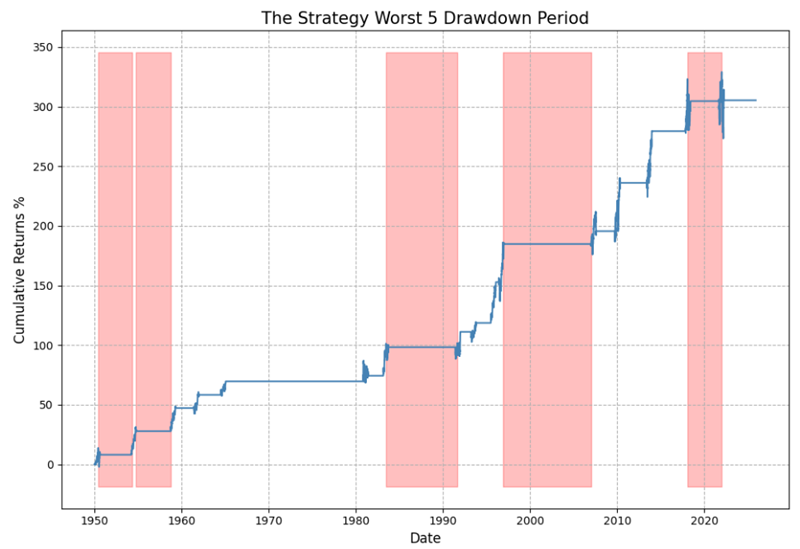
The chart below illustrates the hypothetical equity curve achieved by purchasing the S&P 500 Index following each signal and holding for seven months. While overall results can vary widely from signal to signal, the equity curve itself exhibits the "Lower Left to Upper Right" (I call it LLUR) look that I prefer to see. The primary takeaway is the lack of significant price pullbacks that one might instinctively expect to see after such a prolonged advance. Does this mean that investors can expect "smooth sailing" between now and the end of June 2026? Not necessarily. It just means that there is no need to give in to reflexive fear after a big run-up.
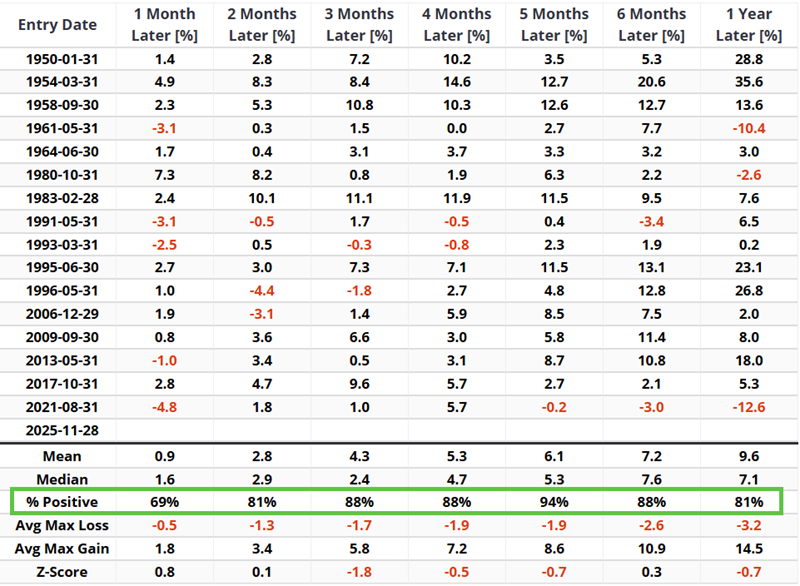
The table below summarizes the S&P 500's performance using our standard timeframes.
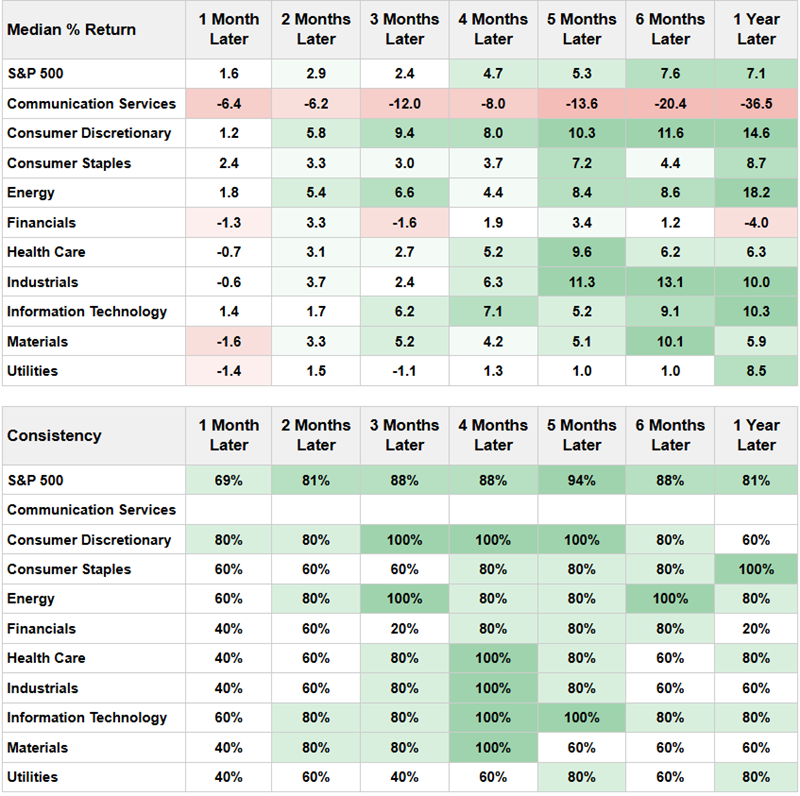
The table below summarizes S&P 500 Sector performance following previous signals.
So why did we focus on a seven-month holding period earlier? With the admitted benefit of hindsight, we see in the table below that the S&P 500 showed a seven-month gain after all previous sixteen seven-month runs. The average gain was 9.3% and the median gain was 7.8%.
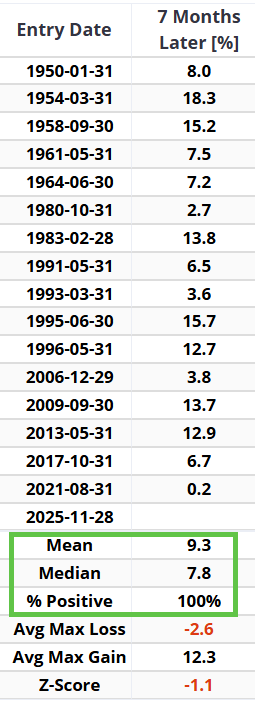
As a frame of reference, all seven-month periods since 1950 have seen the S&P 500 advance 73% of the time, with an average return of +5.3% and a median return of +5.9%.
A word about risk and how to use this information
The apparent implication of the data above is that an investor can buy and hold an S&P 500 Index fund for seven months and then sell at a profit. But that is not what an investor should take away. The reality is that no strategy, system, or indicator is ever guaranteed to be correct "the next time around." The message here is not "buy it and forget it for seven months." The real message is more of "a historical anomaly that adds some weight to the favorable side of the weight of the evidence ledger." Nothing more, nothing less.
Another consideration is the amount of downside volatility an investor is willing to tolerate in a trade. The table below displays the maximum decline for the S&P 500 from the date of the signal through the next seven months.
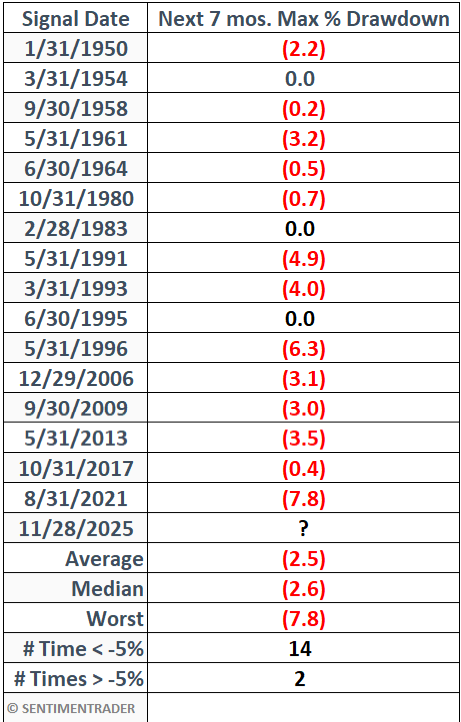
Nothing that has happened in the past guarantees that the stock market will not experience a significant drawdown in the months ahead. That said, note that the two worst drawdowns from the signal date entry price were -7.8% following the August 2021 signal, and -6.3% following the May 1996 signal. All other signals experienced no more than a -5% open decline during the first seven months after the signal.
This suggests the potential to buy an S&P 500 Index fund and set a stop-loss roughly 8% below the entry price.
What the research tells us…
The data detailed above illustrates the importance of recognizing momentum in the stock market. A natural reaction to the stock market rising for seven straight months is to expect "the other shoe to drop." However, this is also an illustration of the importance of objectively quantifying data rather than relying on subjective gut instinct. The results detailed above in no way guarantee that the S&P 500 will be higher at the end of June 2026 than it ended in November 2025, nor that a drawdown of greater than 7.8% cannot occur. They do, however, suggest that investors continue to give the bullish case the benefit of the doubt for a while longer.