
What history says about the recent decline in the PMI Index

Key points
- The recent trend in the PMI Manufacturing Index (PMI) is once again setting off narrative alarms of gloom and doom for the economy and the stock market
- Historical stock market performance is sending a different message
The latest trend in the PMI
The ISM PMI Manufacturing Index is widely viewed as an essential piece of economic information.
Per www.Investopedia.com:
The PMI Manufacturing Index (PMI) is an index of the prevailing direction of economic trends in the manufacturing and service sectors. It consists of a diffusion index that summarizes whether market conditions are expanding, staying the same, or contracting as viewed by purchasing managers. The purpose of the PMI is to provide information about current and future business conditions to company decision-makers, analysts, and investors.
According to the general narrative, sharp declines and/or low readings in the PMI indicate economic weakness and, in many cases, recession. And there is some truth to this. However - and more importantly for investors - the stock market is a discounting mechanism that looks about nine months down the road. This has important implications that many investors miss.
The PMI 3-month average versus the stock market
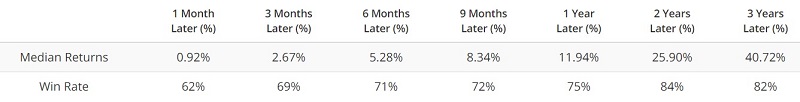
The chart below denotes with a red dot, every time the 3-month PMI moving average was above 47. The table below summarizes S&P 500 Index performance following all greater than 47 readings.
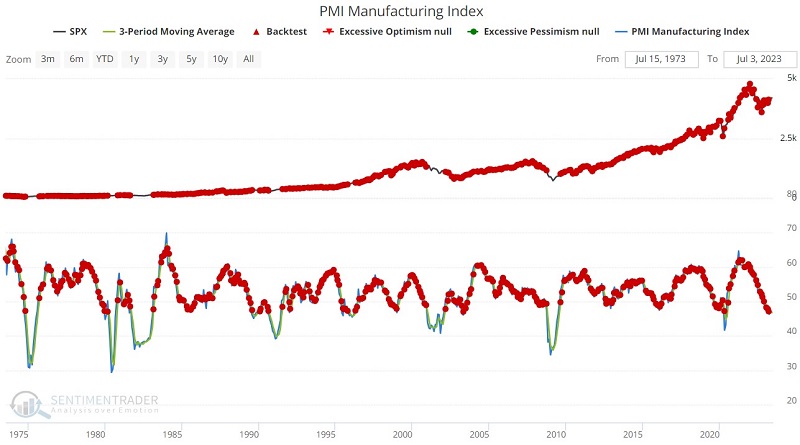
The chart below denotes with a red dot, every time the 3-month PMI moving average was at or below 47. The table summarizes S&P 500 Index performance following all readings below 47.
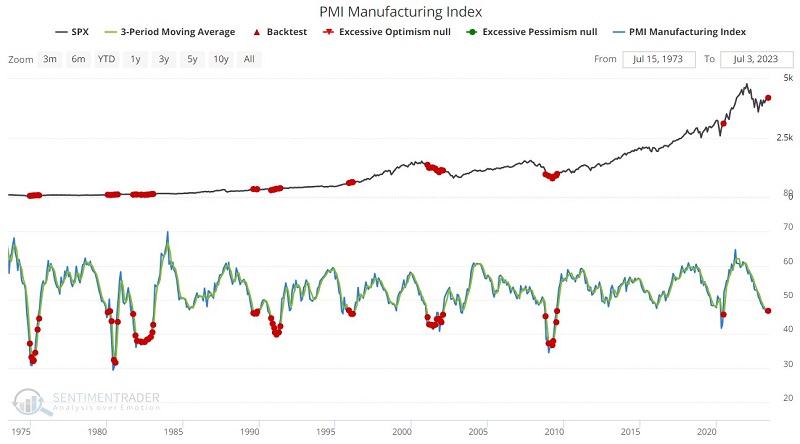

The obvious - and counterintuitive - thing to note is that stock market performance has been better following low readings than following higher readings. To highlight one notable example, one-year returns improve from 11.94% to 18.85%, and the one-year Win Rate improves from 75% to 83%.
Two things to note for traders:
- A drop by the 3-month average below 47 does not necessarily constitute a "buy" signal, and this information is not intended as a "trading system"
- The primary point is to highlight the danger of falling for the standard "Oh my God; the PMI is falling/low, all hope is lost" narrative that typically accompanies such readings
PMI as a bullish confirmation
One more potential use for the PMI Index is as a bullish confirmation tool. The chart below denotes with a red dot, every time the 3-month PMI moving average crossed from below to back above 47. The table summarizes S&P 500 Index performance following all occurrences. The critical thing to note is the high Win Rate across time periods.
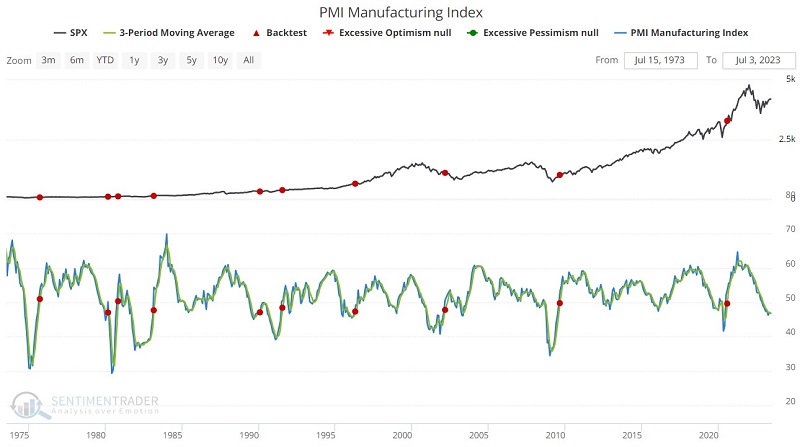
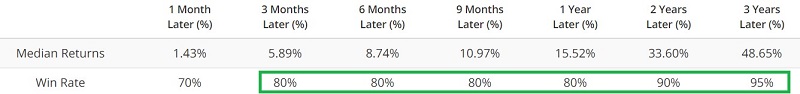
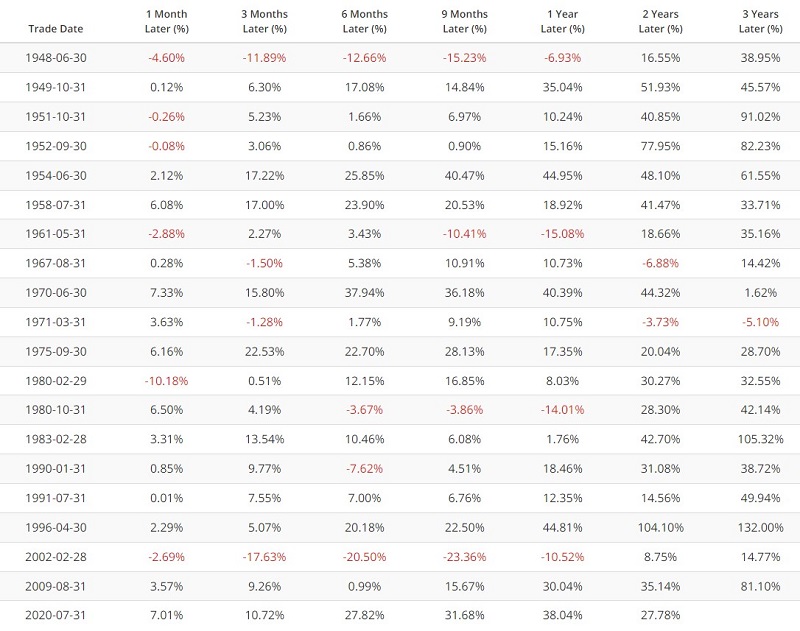
The table below displays performance results following each "3-month average cross above 47" signal. 1961, 1980, and 2002 all saw failed signals. So this is by no means an infallible indicator. Still, as a "weight of the evidence" bullish confirmation tool, this simple measure seems to have some value.
What the research tells us…
It is worth repeating that the actions of the PMI Index are best thought of not as an automatic buy or sell signal but as a significant "weight of the evidence." Also, history suggests that it is also essential - and tough psychologically - to treat it primarily as a contrarian indicator. High PMI readings indicate economic strength, and low readings indicate the opposite. However, the fact that the stock market is a discounting mechanism gets lost in the narrative. Typically, by the time the PMI reaches a nadir, the stock market has already launched a new bull market.
Can the economy and the stock market get worse from here? Absolutely, they could. Is this what the recent decline in the PMI Index portends? History suggests that the answer to that question is "probably not."