Products
SentimenTrader Trading Tools
‍
Backtest Engine
My Trading Toolkit
Correlation Analysis
Seasonality
Market Prediction
Indicators & Data API
‍
Proprietary Indicators & Charts
Market Data API
Strategies & Scanner
‍
50+ Trading Strategies
Smart Stock Scanner
Smart Option Scanner
Research Reports
‍
Research Solutions
Reports Library
Free Resources
Simple Backtest Calculator
Simple Seasonality Calculator
The Kelly Criterion Calculator
Sentiment Geo Map
Public Research Reports
Education
Sentiment Indicators
Technical Indicators
Pricing
Company
About
In the News
Testimonials
Client Success Stories
Contact
Log inLoginSign up
< BACK TO ALL REPORTS

What Happens When Oil Recovers From A Plunge

Jason Goepfert
2019-04-05
null

A crude recovery

As markets sold off in December, crude oil futures fell more than 30% below the 200-day average, one of the largest deviations since their inception in 1986. This week, they made a complete recovery, now trading above the 200-day.

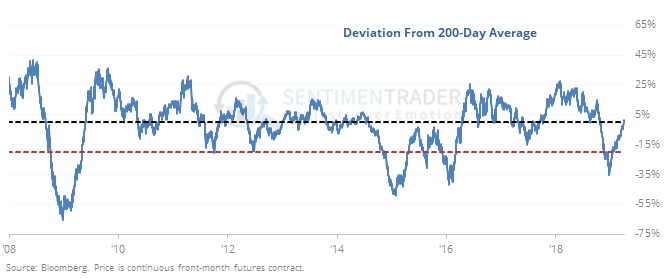
Other times the commodity recovered from such a severe decline from its average, it continued to gain.

Energy stocks also tended to benefit from these recoveries in oil, with the S&P 500 Energy Sector showing positive returns across most time frames.

Survey says…buy!

Near the end of December, pessimism was hitting its practical maximum in some of our indicators and models, including the AIM Model of surveys. It has fully recovered since then, and will rise to 80% this week, the highest since early 2018.

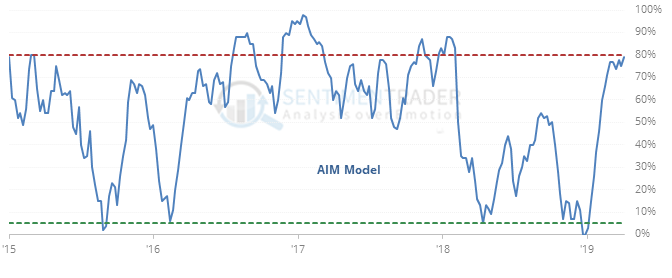
Like many other studies that look at a fully cycle of sentiment, this one shows relatively weak returns in the medium-term, but fairly strong ones longer-term.

Good times

More than 200 junk bonds set a 52-week high than set a 52-week low this week, the most in two years. Since the recovery from the financial crisis, the high-low differential has been this positive on only 40 total days. According to the Backtest Engine, funds like HYG struggled a bit over the next couple of weeks.

Optimistic money managers

According to the NAAIM survey of active investment managers, the average manager is more than 90% exposed to stocks. This is not your typical contrary survey, though. When managers were more than 90% for the first time in at least four months, two months later the S&P 500 was higher 6 out of 6 times.

This post was an abridged version of our previous day's Daily Report. For full access, sign up for a 30-day free trial now.

PRODUCTS
SentimenTrader
Trading Tools
Indicators & Data API
‍
Strategies & Scanner
‍
Research Reports
FREE
RESOUrCES
Simple Backtest
Calculator
Simple Seasonality
Calculator
The Kelly Criterion
Calculator
Sentiment Geo Map
‍
Public Research Reports
‍
Education
Sentiment Indicators
‍
Technical Indicators
‍
Pricing
Bundle pricing
‍
FAQ
‍
Announcements
‍
COMPANY
‍
About
‍
In the News
‍
Testimonials
‍
Client Success Stories
CONTACT
‍
General Inquiries
‍
Media Inquiries
‍
Financial Professionals Inquiries
‍
© 2026 Sundial Capital Research Inc. All rights reserved.
Setsail Marketing
TermsPrivacyAffiliate Program
Risk Disclosure: The information and tools provided are for research and analytical purposes only and are not intended as investment advice. Market analysis involves uncertainty, and outcomes may differ from expectations. Users should conduct their own due diligence and consider their individual circumstances before making any financial decisions. Past performance is not necessarily indicative of future results.

Hypothetical Performance Disclosure: Hypothetical performance results have many inherent limitations, some of which are described below. No representation is being made that any account will or is likely to achieve profits or losses similar to those shown; in fact, there are frequently sharp differences between hypothetical performance results and the actual results subsequently achieved by any particular trading program. One of the limitations of hypothetical performance results is that they are generally prepared with the benefit of hindsight. In addition, hypothetical trading does not involve financial risk, and no hypothetical trading record can completely account for the impact of financial risk of actual trading. for example, the ability to withstand losses or to adhere to a particular trading program in spite of trading losses are material points which can also adversely affect actual trading results. There are numerous other factors related to the markets in general or to the implementation of any specific trading program which cannot be fully accounted for in the preparation of hypothetical performance results and all which can adversely affect trading results.

Testimonial Disclosure: Testimonials appearing on this website may not be representative of other clients or customers and is not a guarantee of future performance or success.