
What happens when Gold hasn't made a new high in 270 trading days

Gold has failed to register a new closing high in 270 trading days as of the close on 8/24/21. There's nothing special about that value; it just happens to be what I noticed when I was reviewing a scan that shows me the number of days since a high for 100s of securities.
Let's conduct a study to assess the forward return outlook for Gold when the metal has failed to register a new high in 270 trading days.
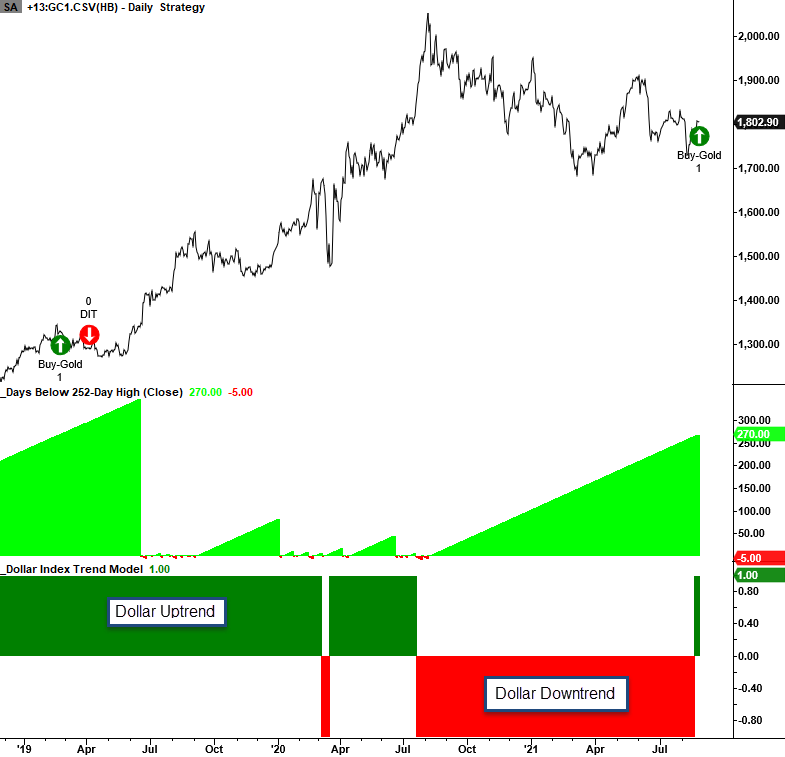
CURRENT DAY CHART
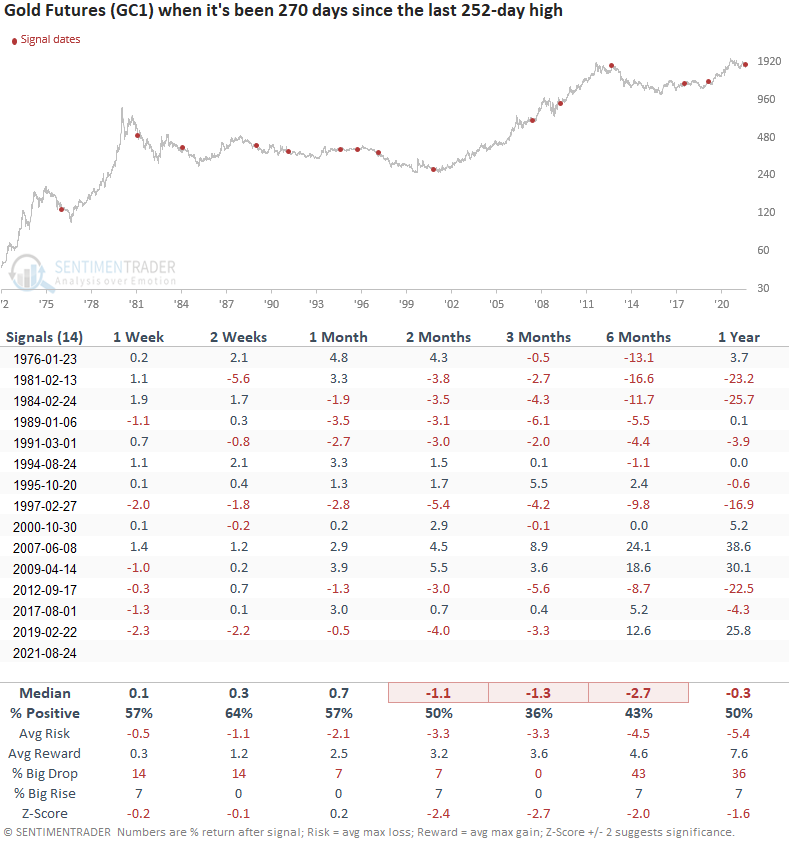
HOW THE SIGNALS PERFORMED
Returns look weak, especially on an intermediate-term basis.
Let's now add a new condition to the study. In a note last week, I shared the trend-following model that I use to determine whether the Dollar Index is in an uptrend or a downtrend. So, let's keep the 270 trading day study, but break them out and view them according to the underlying trend in the Dollar Index.
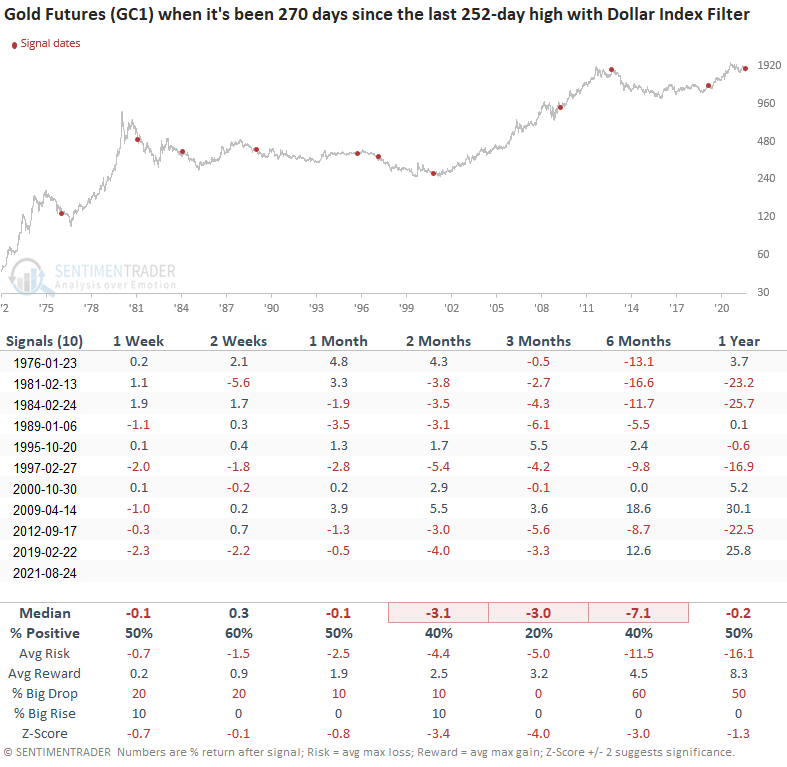
HOW THE SIGNALS PERFORMED - POSITIVE DOLLAR INDEX TREND
Gold returns look weak, especially in the 3-month window. The commodity will struggle when the Dollar Index is in an uptrend.
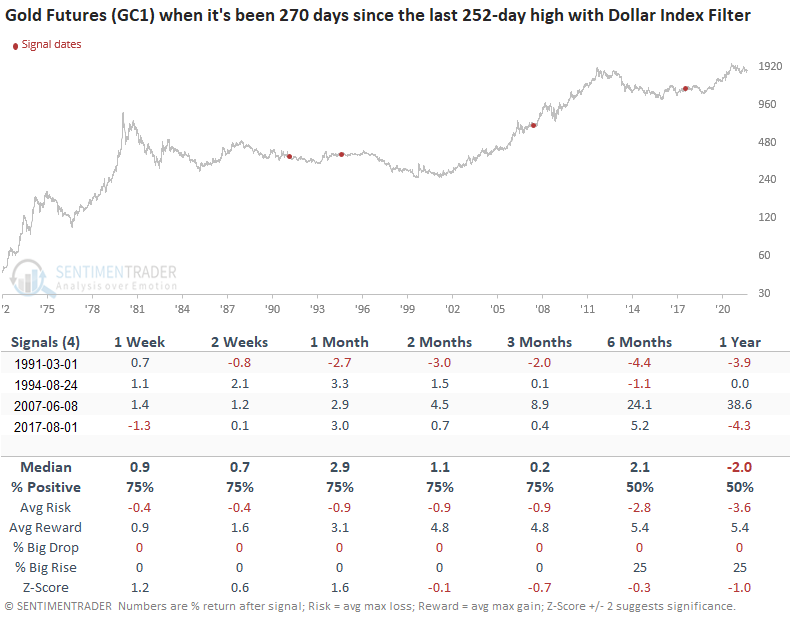
HOW THE SIGNALS PERFORMED - NEGATIVE DOLLAR INDEX TREND
While the sample size is small, returns look good on a short to intermediate-term basis. The Dollar Index trend is an essential must-watch indicator when trading or investing in Gold.
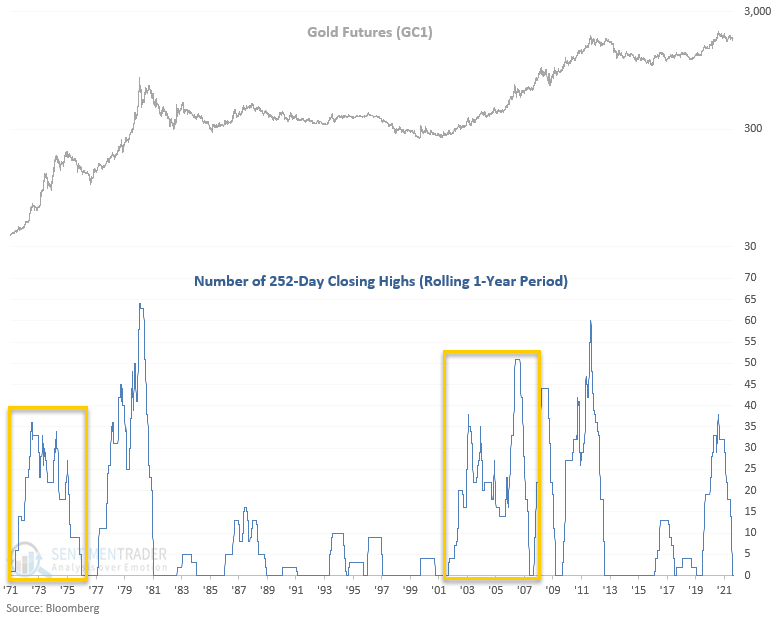
NEW HIGH COUNT CHART
Generally speaking, in the initial stages of a new bull market, the rolling 252-day high count should sustain itself at a high level for an extended period. Consolidations are brief as dip buyers continually step in and drive the given market to a new high. As an example, the 1-year rolling high count for the S&P 500 recently hit 69 days. A level of that magnitude is only found in strong uptrends.
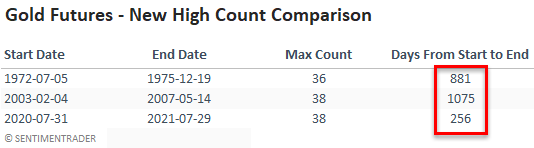
The following table shows the stark difference between the current gold environment and the last two secular bull markets. The rolling count only took 256 days to go from 38 to 0. So, the current environment took 1-year to go from the max count to zero, whereas the other two instances took 3 to 4 years.
Gold remains in the penalty box for me as the Dollar Index trend is unfriendly. More importantly, the metal cannot sustain a series of new highs, which indicates a downtrend versus an uptrend.