
What Five Straight Down Weeks Means - and Does Not Mean

Key points:
- The week ending March 27th marked the fifth consecutive weekly decline for the S&P 500 Index
- While bullish momentum has a history of portending more upside, unfavorable momentum's message is much less clear
- At the very least, this recent extended decline should cause investors to moderate their expectations for stocks in the months ahead
The S&P 500 closes lower for the 5th straight week
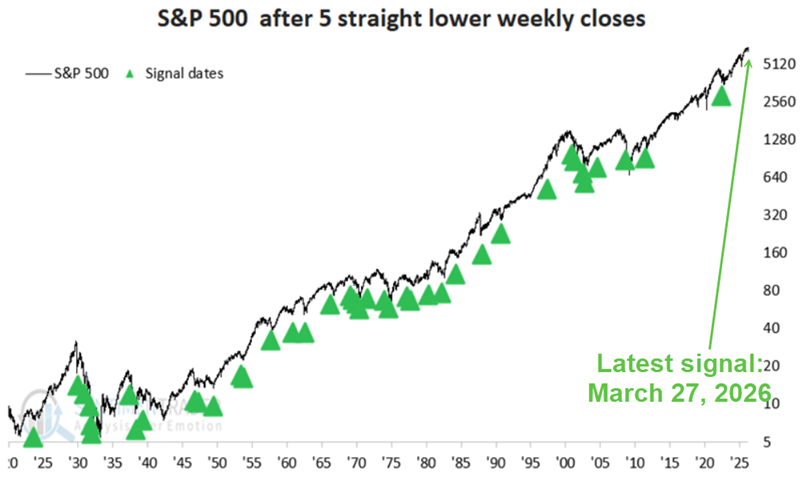
On March 27th, the S&P 500 registered its fifth consecutive lower weekly close. Such extended declines often trigger talk of the market being "oversold" and "due for a bounce." And in some cases, that proves to be accurate. But the full history is much muddier.
The chart below marks in green all the times since 1921 when the S&P 500 first registered its fifth consecutive down week.
So how has the S&P 500 performed following previous 5-week declines? It's a mixed bag, and results have varied widely from instance to instance. But overall, the results have been uninspiring and well below average. The table below summarizes S&P 500 performance following each of the previous 5-week declines.