
What does the indicator show about the current state of the SPX?

Key Points:
- Copper / Gold Relative Ratio Rank has reached a reading of 100
- NYSE Advance/Decline Line and SPX hit all-time highs simultaneously
- SPX performance following the AAII Bull Ratio hitting a 52-week high
Copper/Gold Relative Ratio Rank Indicator
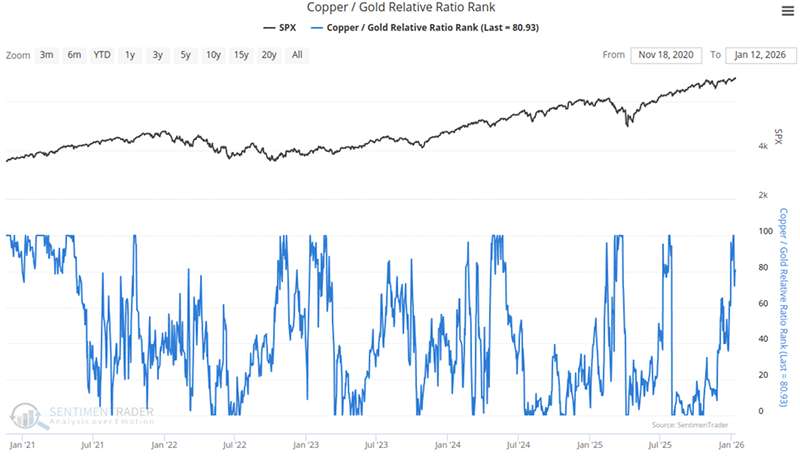
The chart below shows the Copper/Gold Relative Ratio Rank over the past several decades.
The Copper/Gold Relative Ratio Rank reflects the relative position of this ratio over the past four months. A higher reading of the ratio signals risk-seeking behavior among investors, while a lower reading points to risk-averse behavior.
One practical application of this metric is to monitor periods when it reaches extreme levels. As shown in the chart below, this indicator hit a reading of 100 last week.
The table below summarizes the subsequent performance of the S&P 500 Index following this signal.
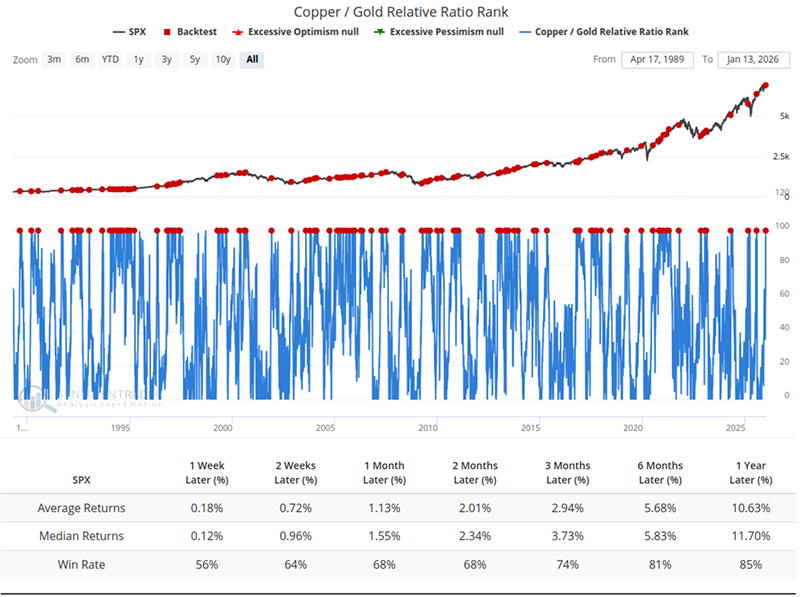
In the short term, this signal fails to deliver precise market timing, with a win rate of nearly 50% and negligible returns. Over an extended time horizon, however, the improved win rate and return profile both reinforce a continued bullish outlook for the market ahead.
SPY and NYSE Advance/Decline Line Hit New Highs Simultaneously
The SPY New High Percentage Indicator and the NYSE Advance/Decline Line are key gauges of market breadth.
We have seen the NYSE Advance/Decline Line set an all-time high, which indicates that the underlying uptrend momentum has expanded well beyond large-cap stocks to the broader market universe.
The data in the chart below illustrates the forward performance of the SPX after both the index and this indicator hit all-time highs concurrently.Related Backtest Click Here.
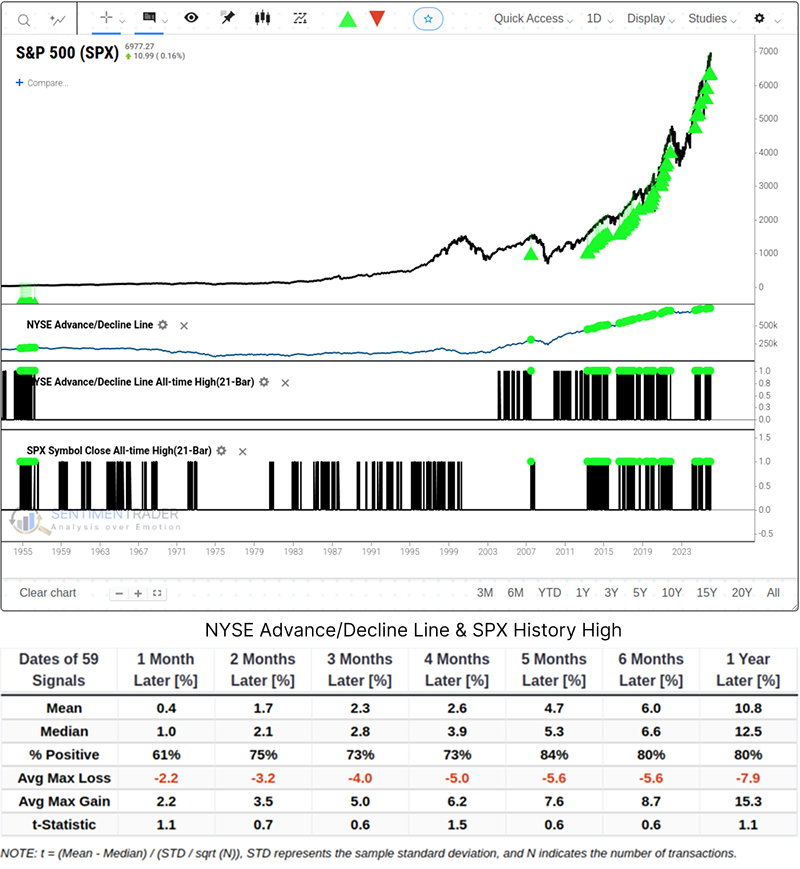
Similar to the aforementioned indicator, the short-term market reaction yields unremarkable results: investors should brace for an intraday pullback of -2.2%, with a modest final gain of just 0.4%. This is a clear reminder to temper short-term expectations, while broad market participation provides sustained upside momentum for the medium to long term.
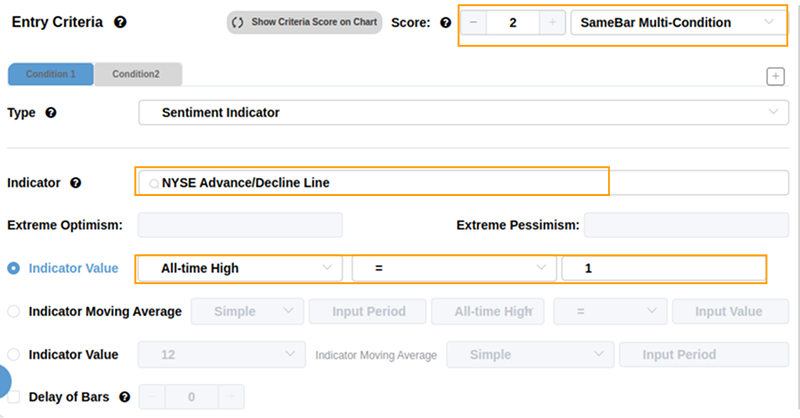
You can create a backtest with identical conditions in our BacktestEdge by following these steps:
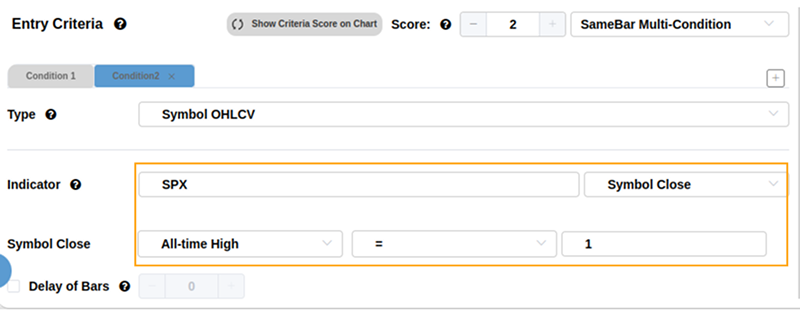
A Sharp Reversal in AAII Sentiment
Given the dichotomous signals in the market right now, let us examine two additional sentiment-based indicators.
Data from the American Association of Individual Investors (AAII Bears) reveals a notable shift in investor psychology. Bearish sentiment has fallen from over 49% to below 30% within an 8-week period.
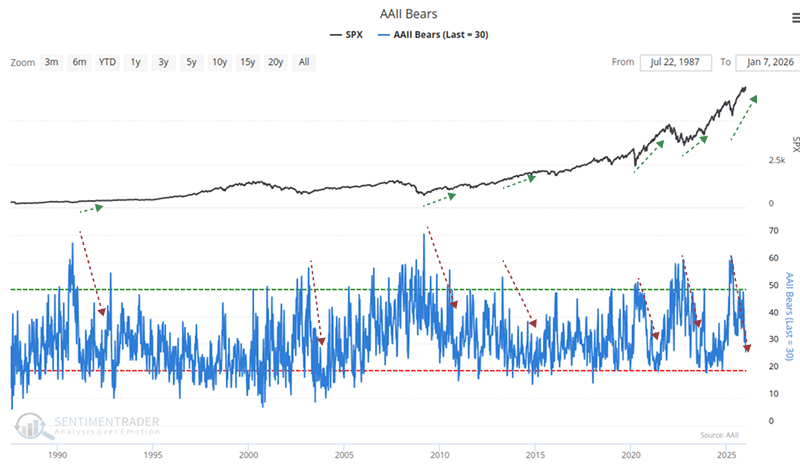
Correspondingly, the AAII Bull Ratio has hit a 52-week high. The chart below outlines the forward return performance of the SPX following such signals.Related Backtest Click Here.
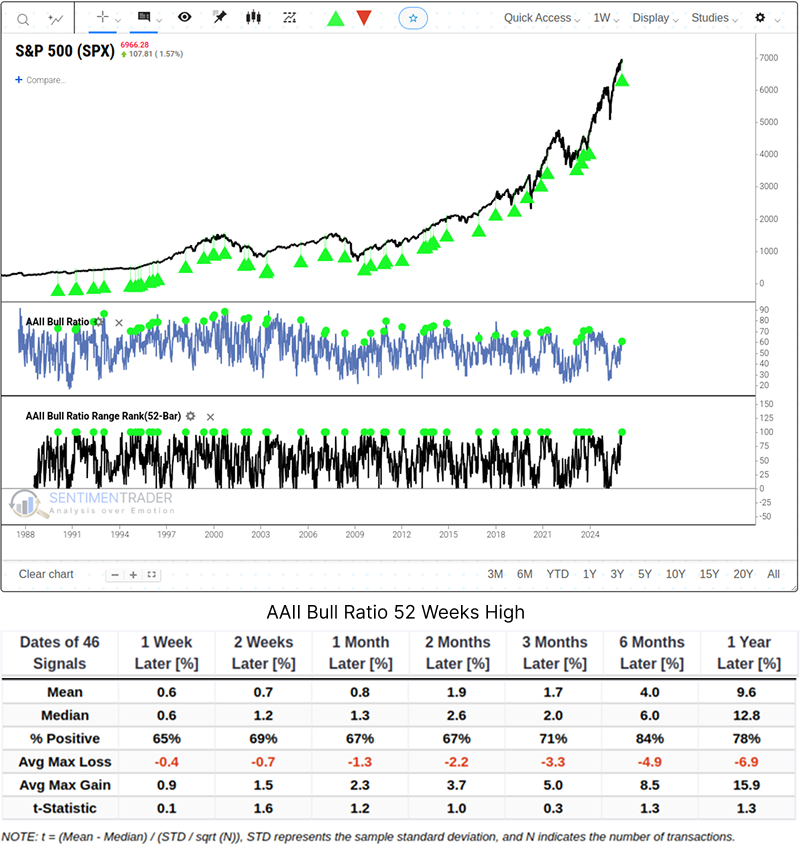
Does this guarantee the stock price will rise over the next year? Absolutely not. No historical backtest can ensure future performance. That said, the results above add material weight to the evidence supporting a long-term bullish thesis.
Another sentiment-linked metric is the PE/VIX Spread. This gauge measures the relationship between the price-to-earnings ratio (PE) and the Volatility Index (VIX), specifically tracking the spread between the S&P 500's forward PE ratio and the VIX. A higher spread indicates investors are willing to assign premium valuations to equities without the headwind of elevated volatility-a condition that typically erodes forward returns. Conversely, an extremely low spread means investors may price in excessive equity volatility expectations while underappreciating potential forward earnings.
Currently, the 4-month Relative Strength Rank (RSR) of the 50-day moving average for the PE/VIX Spread stands above 80. This signals a market state of elevated valuations paired with low fear, widely known as being Priced for Perfection. When investors pay premium prices for stocks and refuse to hedge against downside risk (reflected by a low VIX), even minor bearish catalysts can trigger outsized market volatility.Related Backtest Click Here.
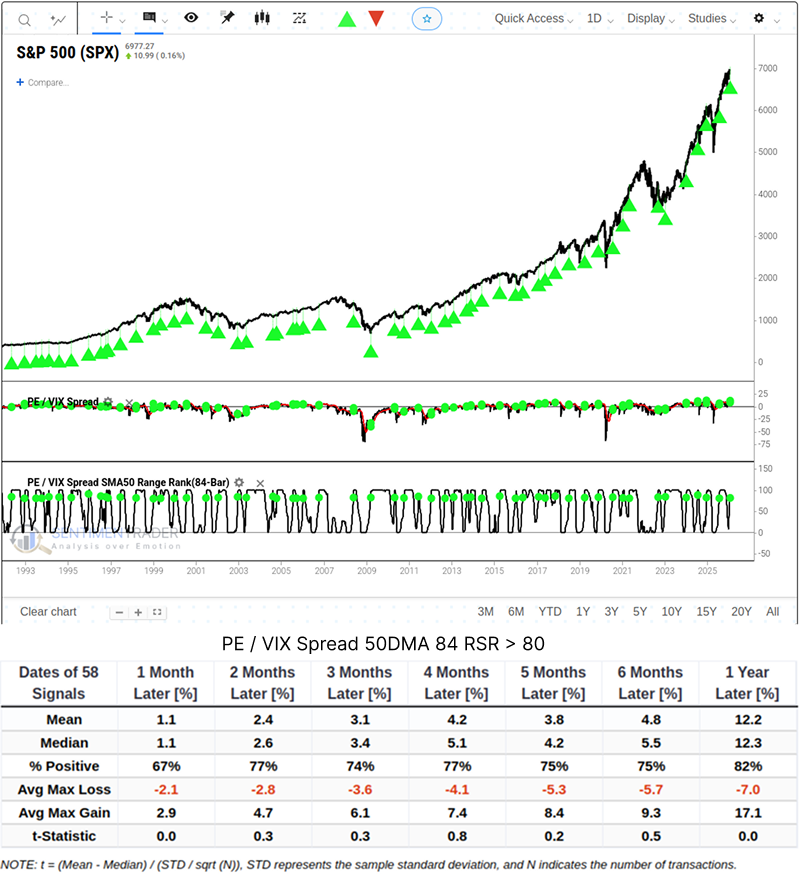
Historical data for this signal shows that for investors to capture the potential 12.2% return, they must be prepared to weather a sharp drawdown of approximately 7% at any point during the holding period-an unavoidable tradeoff for the upside potential, given the embedded risks.
What the Research Tells Us...
Since the launch of the current rally, we have witnessed a steady reinforcement of bullish momentum across a broad range of market indicators. Historical backtest data continues to build a compelling case for the ongoing uptrend. At the same time, the latest readings from sentiment and valuation metrics offer a critical reminder to investors. Ride the trend, but do not fall in love with it.
This dynamic ultimately encourages investors to embrace the trend while enforcing strict risk controls. Follow the trend-but avoid blind confidence in the illusion of persistent short-term calm.