
What comes after "The Summer Rally"

Key points
- The S&P 500 rallied over 25% off the April 2025 low
- The stock market recently completed the so-called "Summer Rally" period
- Investors may be wise to temper expectations between late July and mid-October
The stock market faltered, then rallied sharply
The stock market was doing well in 2025, and then the "Tariff Tantrum" in April caused a massive market plunge. Following a seriously oversold situation and a massive spike in bearish sentiment, the S&P 500 then rallied 25.8% off of its April low.
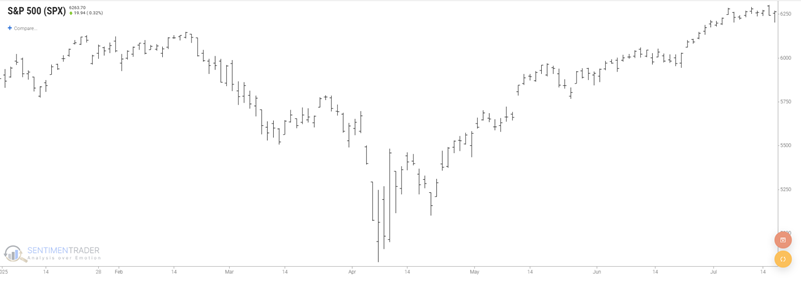
During the recent "Summer Rally" period (the last three trading days of June plus the first nine trading days of July), the S&P rallied a respectable +2.9%. So now what?
At this point, most sentiment indicators point to a majority of bulls in the market. This does not guarantee an imminent or immediate market decline, but combined with the seasonality pattern detailed below, it suggests that investors might want to temper their expectations in the months directly ahead.
Will the S&P 5000 experience the "Post Summer Rally" doldrums?
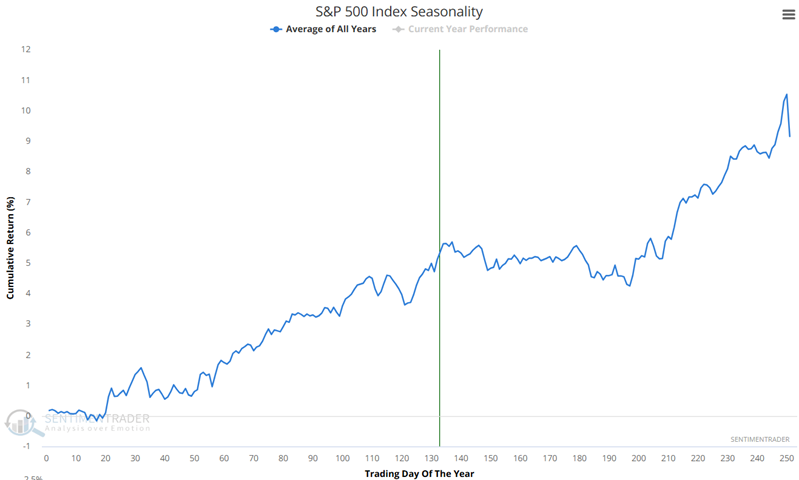
The chart below displays the Annual Seasonal Trend for the S&P 500 index.
The chart below adds S&P price action so far for 2025.
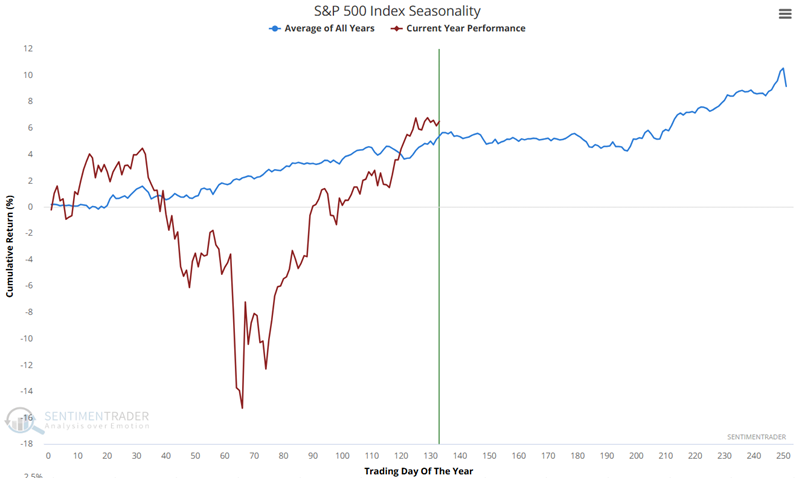
Ultimately, price action is about where it is, on average, at this point in the year. Obviously, the April sell-off was "beyond average", but the subsequent rally got things back on track.
That's the good news. The potential bad news appears in the chart below.
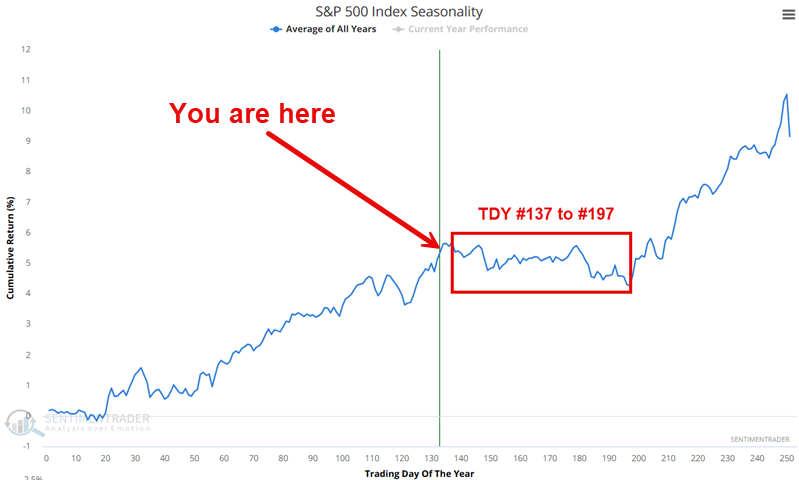
The chart above notes that the period extending from Trading Day of the Year (TDY) #137 through TDY #197 has, on average, shown some very uninspiring results. For 2025, this period extends from the close on 2025-07-22 through 2025-10-15.
So, is the stock market "doomed" to flounder and decline during this period? Not at all. Results can vary greatly year-to-year. Still, the main point is that investors who have become strongly bullish during the post-April sell-off lows may be wise to temper their enthusiasm for a while.
The Post-Summer Rally results
The chart below displays the hypothetical growth of $1 invested in the S&P 500 only from TDY #137 through TY #197 every year starting in 1985.
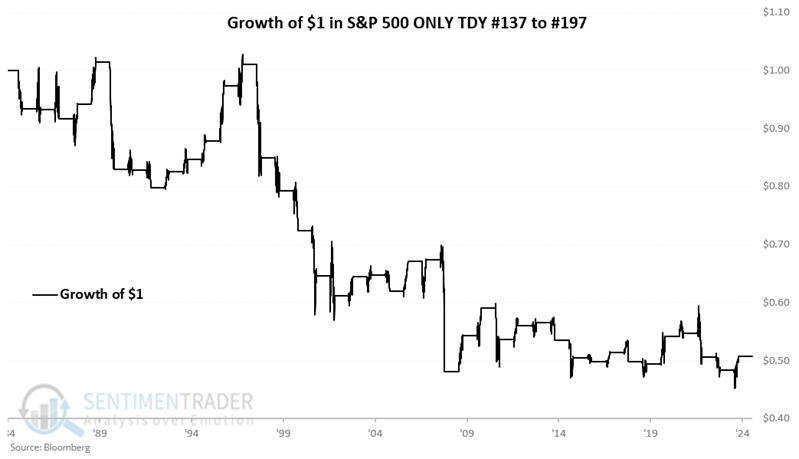
As I said, uninspiring. For the record, the S&P 500 has lost a cumulative 49% during this period since 1985. The table below summarizes the results.
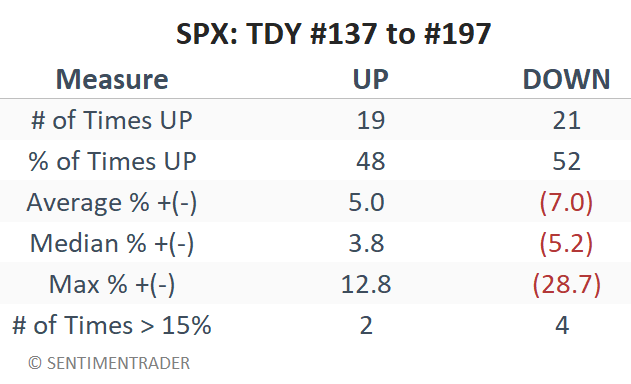
The 48% Win Rate suggests that whether the stock market gains or loses during this period is essentially a coin flip (well below average, as the stock market typically would gain roughly 70% of the time over any 60-trading-day period). Also, I'd like to point out that the average and median declines significantly outpace the average and median gains during this period.
What the research tells us…
Is the stock market doomed to enter a bear market over the next several months? Not likely, and that is not the implication intended from the data detailed above. The real purpose is to remind investors that even the best bull markets experience periods of sideways to lower action. This is particularly true after a sharp rally has pulled a majority of investors into the bullish camp. The net result: Short-term traders might consider taking some profits or tightening trailing stops. Longer-term investors who have enjoyed counting their gains in the last several months might adjust their expectations to avoid being triggered to "do something" (unwarranted) if the stock market drags in the months ahead.