
What a week in the Hang Seng

Key points:
- The Hang Seng index of Chinese stocks shows a dramatic change in price and breadth characteristics
- Several indicators of breadth have hit multi-decade records
- Similar behavior preceded mixed returns, with a qualified suggestion of further upside in the month(s) ahead
From hated to not
Since China had once again become the most hated market in the world in February, they've surged, purged, and then surged again. All of a sudden, they went from uninvestable to must-have. Once again, with feeling - people are funny! Efficient markets, LOL.
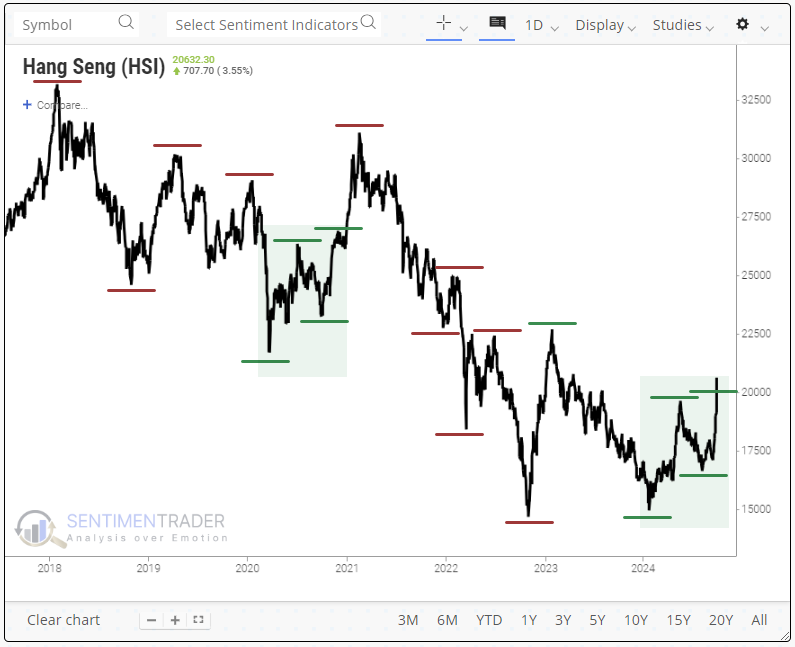
As a result of the breakout above the spring highs, market indexes like the Hang Seng have a pattern of higher highs and higher lows for only the second time in six years. The other higher-high breakout in late 2020 preceded a multi-week consolidation phase and then an extension of the breakout. Chinese stocks tend to exhibit this kind of get-me-in, get-me-out behavior.
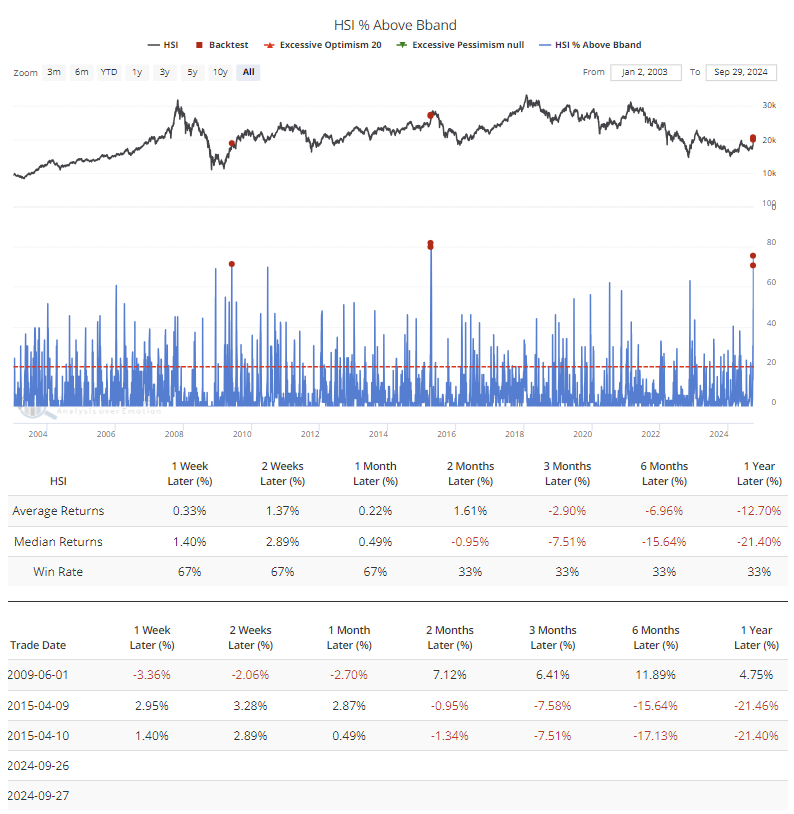
The surge in the indexes was driven by across-the-board buying. For only the third time in more than twenty years, more than 70% of stocks in the Hang Seng traded above their volatility-driven Bollinger Bands. The first instance led to an immediate pullback and then rally extension; the second did the opposite, so we can glean nothing from that.
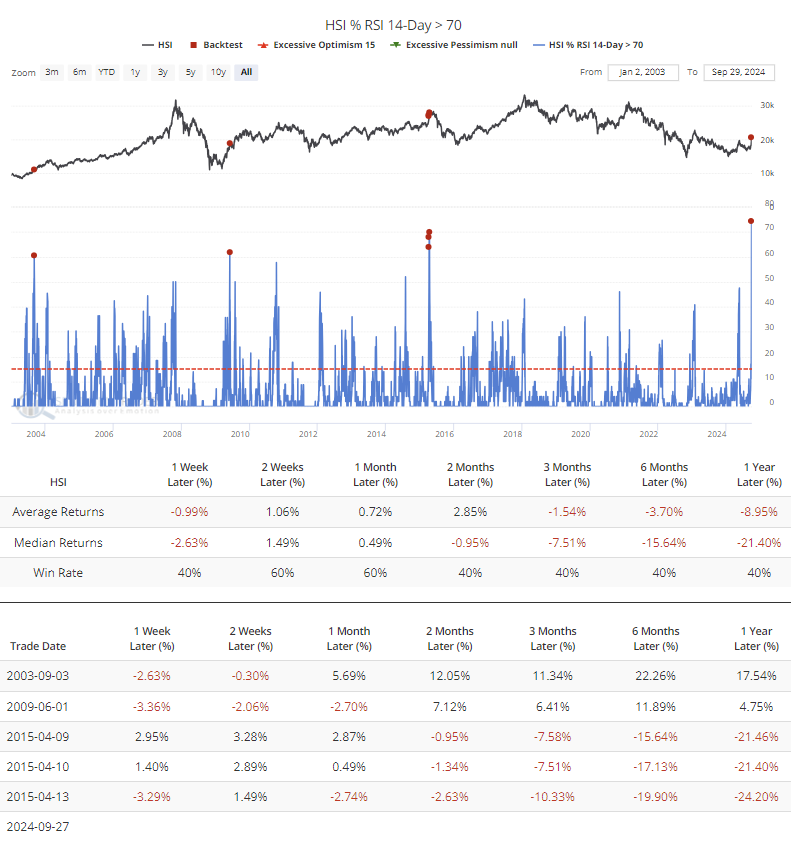
It's the same scenario when looking at the surge in stocks that reached an overbought condition. The current reading is the highest in history, but if we look at readings above 60%, we can see that each instance showed a positive return in the months ahead (the first two signals) or the short-term (the latter signals). Again, it was inconsistent.
A longer-term look herd mentality
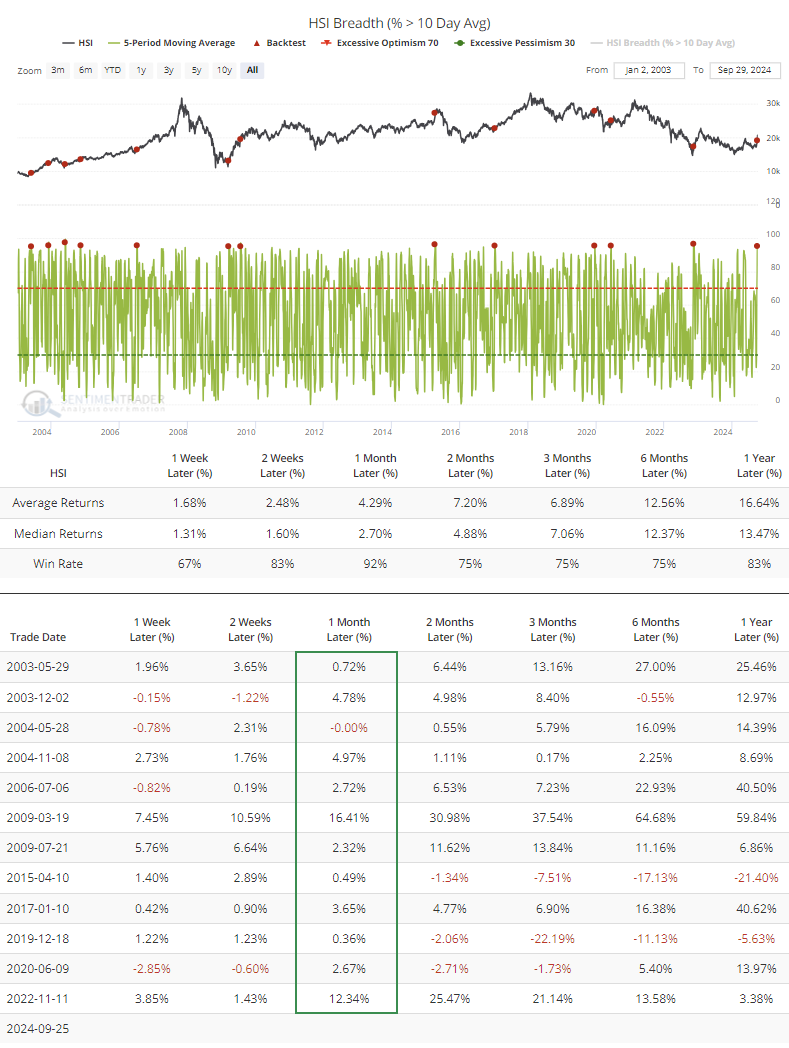
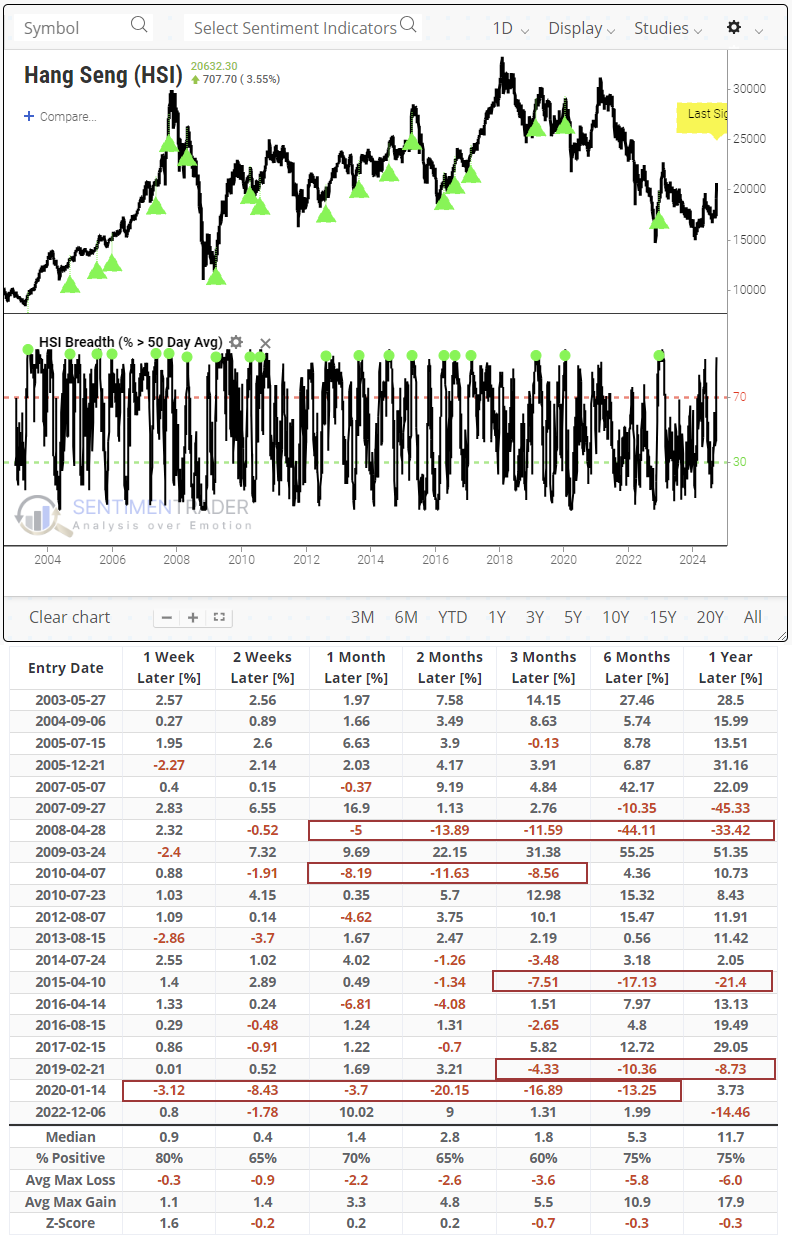
Perhaps we can get some better information by looking at longer time series. An average of more than 95% of stocks in the index were trading above their 10-day average during the week, the 2nd-most in four years. The only reading that exceeded the current one was the initial push from the November 2022 panic.
In the month following other 5-day breadth surges, the Hang Seng continued to rally essentially every time.
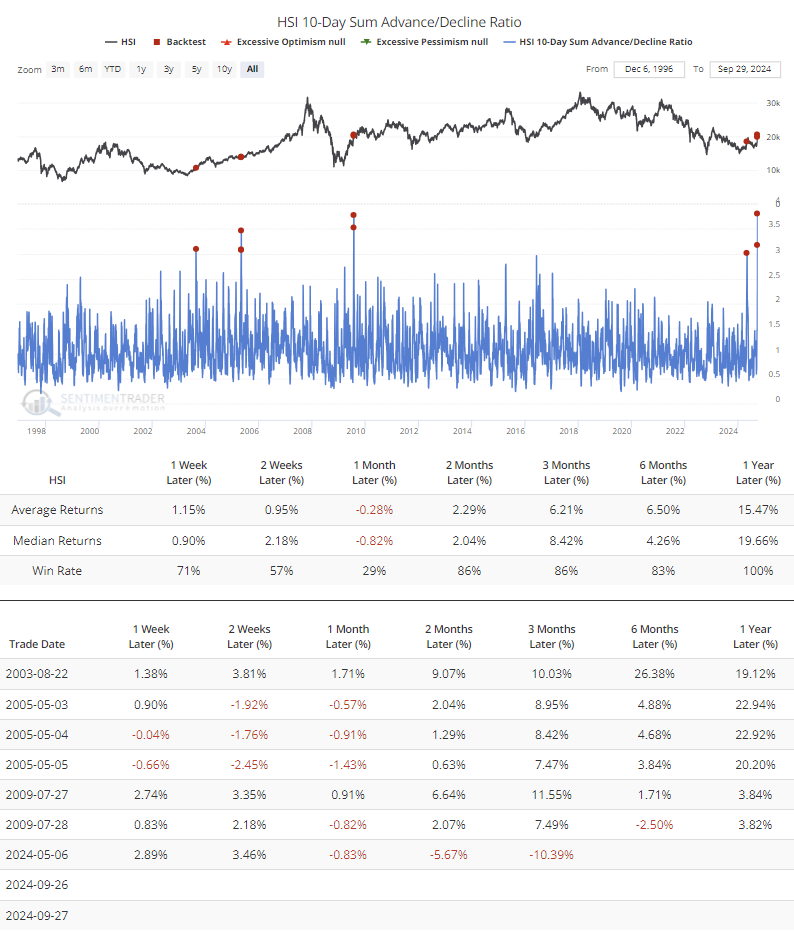
Extending the time frame a little longer, there were more than three advancing stocks for every decliner during the past two weeks, again the highest in 25 years. Other times the ratio exceeded three-to-one, the Hang Seng struggled with gains over the next month, but the losses were small and preceded gains in the weeks and months after that.
The exception was the last one in May, which saw the index rise over the next two weeks and then fall into the multi-month pullback that just ended.
Lengthening the time frame still further, the percentage of stocks trading above their 50-day moving average cycled from below 15% to above 95%. Again, the only precedent in the past four years was during the kick-off from the November 2022 panic selling, which led to double-digit gains over the next month.
Five failures among the signals occurred when the Hang Seng witnessed meaningful and protracted losses in the months ahead, but that means there were fifteen signals that either didn't see any losses or dips that were relatively minor and/or quickly erased.
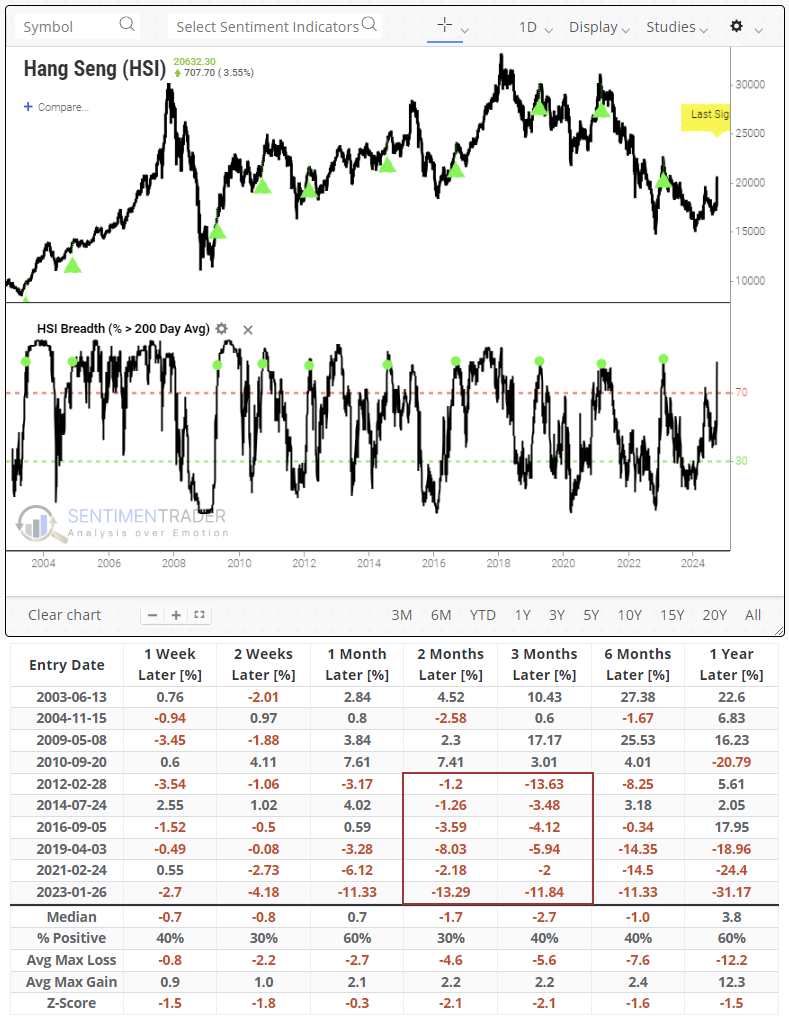
On a still-longer time frame, the percentage of stocks above their 200-day averages cycled from fewer than 15% to more than 85%. Because these equities have had difficulty maintaining long-term upside momentum, future returns were bleak on average. The last six signals led to losses over the next 2-3 months.
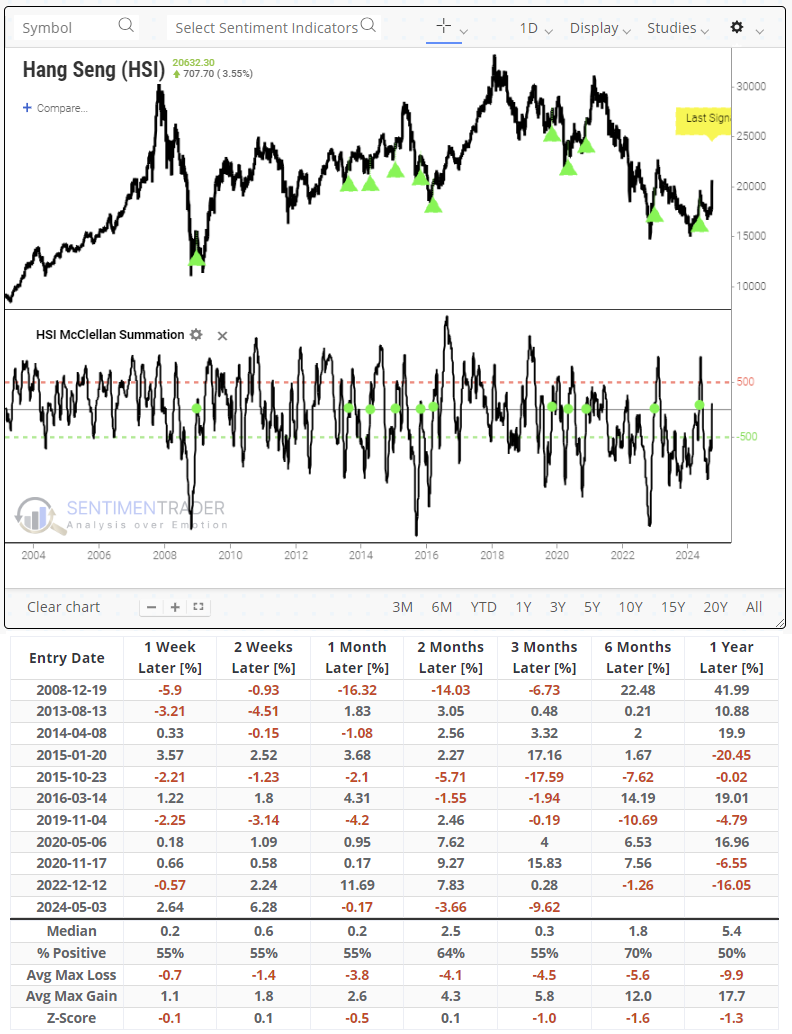
On a similarly long time frame, the McClellan Summation Index has cycled from below -1250 to above 0. Unlike most global equity indices, the Hang Seng does not show particularly favorable returns when the Summation Index is above zero relative to when it's below.
The Hang Seng shows mixed returns when the Summation Index cycles like this. There is no particular pattern to the returns, though every one since the pandemic has led to further gains over the next couple of weeks.
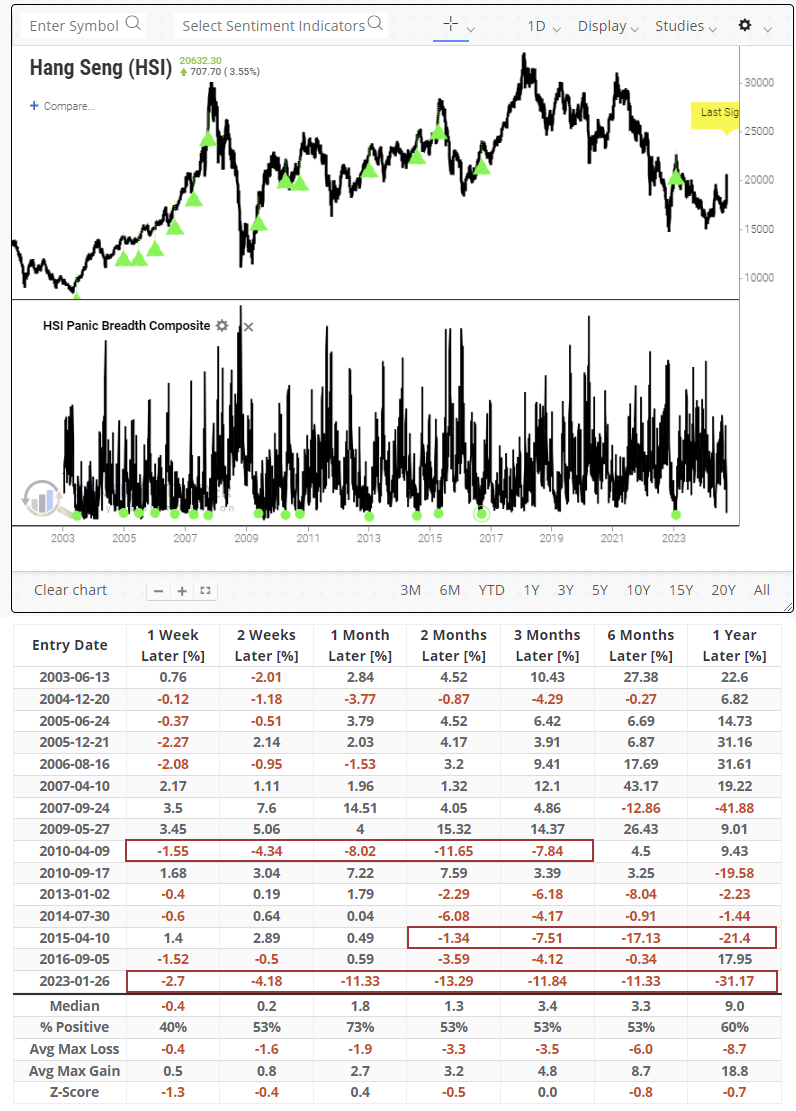
Putting it all together, the Panic Breadth Composite cycled from above 40 to below 3.55. This composite includes many of the indicators noted above, with high readings suggesting panic and low readings the opposite.
Two of the fifteen precedents were outright failures. One other signal led to a short-term pop and then double-digit losses in the months afterward. The others mostly led to gains, with some smallish losses on some time frames.
What the research tells us...
Chinese stocks are a different breed, as we've outlined many times. No matter which index we use, that market does not adhere to many of the behaviors we see in other developed or developing markets. The most likely reason is that unlike the U.S. market, which institutional and passive investors dominate, the Chinese market is much more leveraged to hot money types. That makes it more prone to boom-and-bust cycles, with no discernible pattern in the returns.
Our research during the periodic panics over the last couple of years showed a high likelihood of higher prices over a multi-year time frame, and that remains the case. Most of the Chinese stock indexes show a pattern of higher highs and higher lows, and sentiment has turned for the better. The stocks are still cheap on an absolute and relative basis, even after their week-long surge, but holders should recognize the risk of sharp and sizable pullbacks along the way.