Products
SentimenTrader Trading Tools
‍
Backtest Engine
My Trading Toolkit
Correlation Analysis
Seasonality
Market Prediction
Indicators & Data API
‍
Proprietary Indicators & Charts
Market Data API
Strategies & Scanner
‍
50+ Trading Strategies
Smart Stock Scanner
Smart Option Scanner
Research Reports
‍
Research Solutions
Reports Library
Free Resources
Simple Backtest Calculator
Simple Seasonality Calculator
The Kelly Criterion Calculator
Sentiment Geo Map
Public Research Reports
Education
Sentiment Indicators
Technical Indicators
Pricing
Company
About
In the News
Testimonials
Client Success Stories
Contact
Log inLoginSign up
< BACK TO ALL REPORTS

What A Steeper Curve Really Means

Jason Goepfert
2019-06-07
null

Curve steepens

Investors are fairly obsessed with the yield curve and its potential message for all markets. The widely watched spread between 2- and 10-year Treasuries neared inversion but has quickly reversed and hit its highest level in 6 months.

What A Steeper Curve Really Means

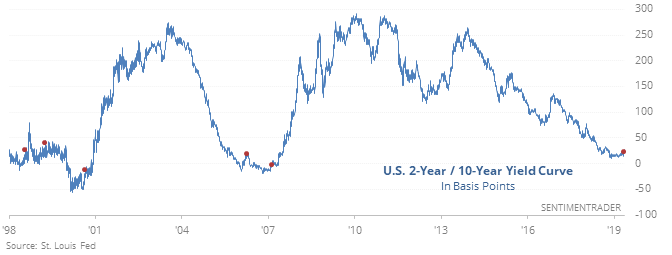
The steepening is often what causes trouble, but when this curve has gone from less than 25 basis points to a 6-month high since 1977, returns in stocks (and bonds) were not consistently different than random.

When we look at the S&P’s returns over the next year, they were higher after 11 of the 13 signals. Risk was relatively high, though, so the reward-to-risk ratio was barely 2-to-1, which isn’t very impressive.

First week of pessimism

For the first time in four months, and after an extremely high reading in April, the AIM Model is showing that sentiment surveys are showing a little pessimism.

What A Steeper Curve Really Means

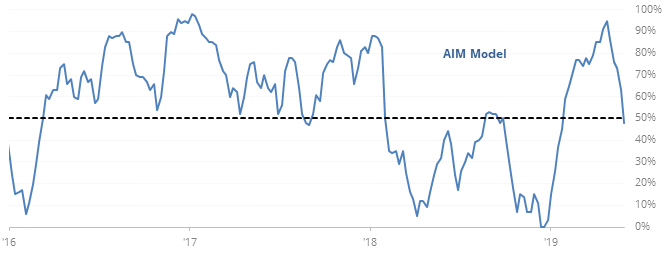
The first reading in multiple months tends to lead to rebounds, and not a further slide in pessimism. Only one of the signals led to a loss of more than 6.0% at any point during the next six months (in 2011) while all but two led to gains of more than that at some point within those same six-month windows.

Anxious, again

The low-volatility stocks within the S&P 500 hit a new high on Wednesday while the high-beta ones are holding more than 10% below their own high. This triggered in February as well, and we can see from the February 14 report that the low-volatility ones tended to keep winning relative to the high-beta ones.

Another outflow

According to Lipper, investors pulled another $12.2 billion from equity mutual funds and ETFs this week. That’s more than $58 billion in the past 6 weeks, exceeding all 6-week periods in 17 years except for last December. It’s more than 0.5% of all fund assets.

This post was an abridged version of our previous day's Daily Report. For full access, sign up for a 30-day free trial now.

PRODUCTS
SentimenTrader
Trading Tools
Indicators & Data API
‍
Strategies & Scanner
‍
Research Reports
FREE
RESOUrCES
Simple Backtest
Calculator
Simple Seasonality
Calculator
The Kelly Criterion
Calculator
Sentiment Geo Map
‍
Public Research Reports
‍
Education
Sentiment Indicators
‍
Technical Indicators
‍
Pricing
Bundle pricing
‍
FAQ
‍
Announcements
‍
COMPANY
‍
About
‍
In the News
‍
Testimonials
‍
Client Success Stories
CONTACT
‍
General Inquiries
‍
Media Inquiries
‍
Financial Professionals Inquiries
‍
© 2026 Sundial Capital Research Inc. All rights reserved.
Setsail Marketing
TermsPrivacyAffiliate Program
Risk Disclosure: The information and tools provided are for research and analytical purposes only and are not intended as investment advice. Market analysis involves uncertainty, and outcomes may differ from expectations. Users should conduct their own due diligence and consider their individual circumstances before making any financial decisions. Past performance is not necessarily indicative of future results.

Hypothetical Performance Disclosure: Hypothetical performance results have many inherent limitations, some of which are described below. No representation is being made that any account will or is likely to achieve profits or losses similar to those shown; in fact, there are frequently sharp differences between hypothetical performance results and the actual results subsequently achieved by any particular trading program. One of the limitations of hypothetical performance results is that they are generally prepared with the benefit of hindsight. In addition, hypothetical trading does not involve financial risk, and no hypothetical trading record can completely account for the impact of financial risk of actual trading. for example, the ability to withstand losses or to adhere to a particular trading program in spite of trading losses are material points which can also adversely affect actual trading results. There are numerous other factors related to the markets in general or to the implementation of any specific trading program which cannot be fully accounted for in the preparation of hypothetical performance results and all which can adversely affect trading results.

Testimonial Disclosure: Testimonials appearing on this website may not be representative of other clients or customers and is not a guarantee of future performance or success.