
What a massive 1-day VIX spike implies for stocks

Key Points:
- The VIX Index is often referred to as the "Fear Gauge" as large increases in the index reflect fearful behavior
- When most people think of VIX "spikes," they think of up moves that last for weeks or even months
- But shorter-term spikes can also indicate an excess of fear - which in theory should be bullish for stocks on a contrarian basis
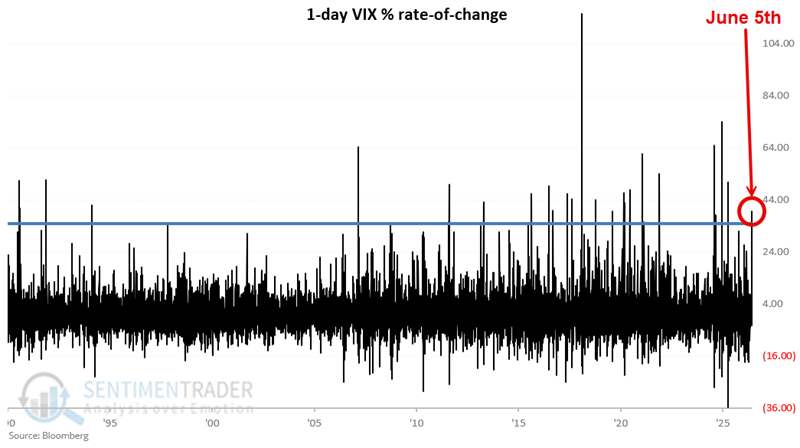
- The VIX Index experienced a 1-day percentage gain of 39.7% on June 5th
- The history of significant 1-day VIX spikes skews to the bullish side
Huge 1-day VIX spikes highlight excessive investor fear
The VIX measures the implied volatility (i.e., estimated future volatility) of near-term at-the-money SPX (S&P 500) index options. If the SPX moves significantly, new strike prices are used to calculate the VIX. Since there is a skew to options prices and implied volatility changes with the strikes, the VIX will typically rise when the market drops and fall when the market rises. This is not always the case, but the correlation is clear.
The common interpretation of VIX movements is that the VIX will rise when fear or uncertainty does, since there will be a greater demand for put options. Conversely, when the market is rising, that typically creates complacency on the part of traders, and the VIX will fall as the demand for put options decreases.
While the range within which the VIX tend