
What a bottom might look like

Key Points
- Mid-term election years have a history of forming significant buying opportunities and rallying in the fourth quarter
- The Nasdaq Hi/Low Logic Index typically gives a particular alert either late in a bear market or early in a new bull market
- A "spike" in the Equity Risk Premium does not accompany every bear market bottom - but when one does occur, it almost always proves to be a significant signal for bulls
- There are no magic numbers on the VIX - that said, a spike above 45 and a subsequent drop back below has marked many bear market bottoms
Mid-Term Year Seasonality
As I highlighted in this article, mid-term election years tend to have something of a split personality - the first nine months can be hit or miss, and the last three months tend to be a big hit. This seems like a good time to invoke:
Jay's Trading Maxim #220: The essential commodities in a mid-term election year are patience and a reasonable cash position.
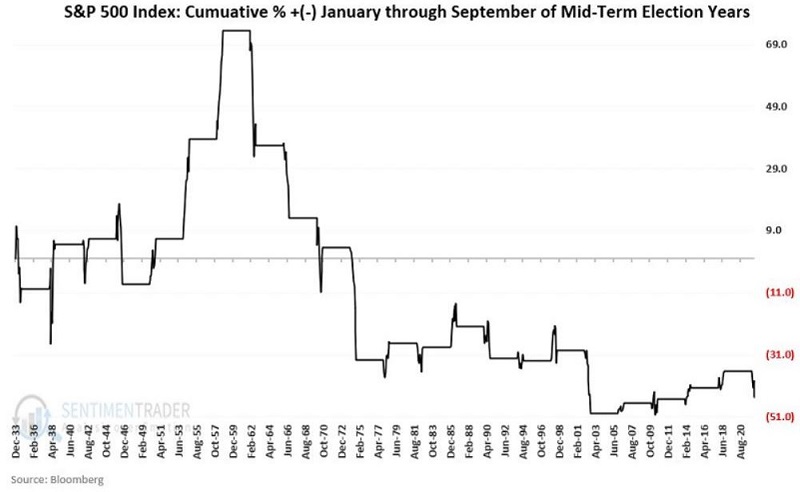
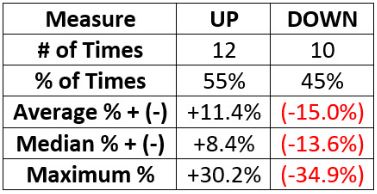
The charts and table below tell the mid-term tale reasonably well. The first nine months of mid-term years:
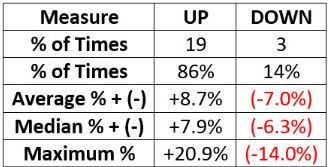
The last three months of mid-term years:
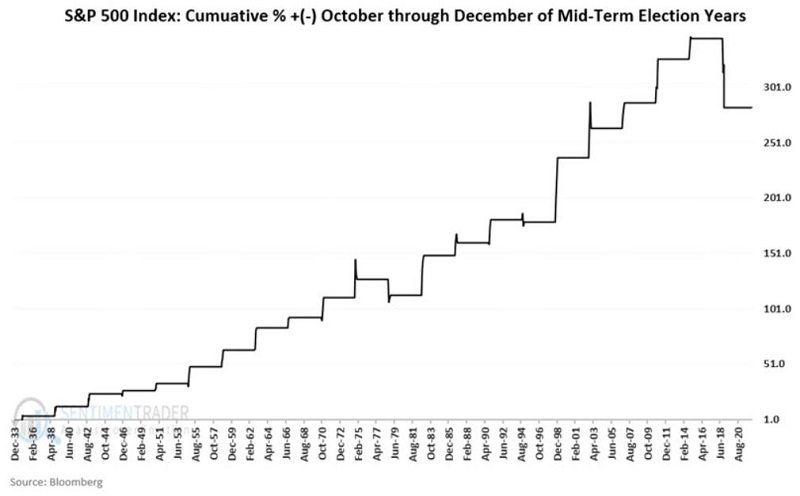
This historical tendency suggests that investors be patient and unemotional and look for a buying opportunity sometime between now and the end of September.
Nasdaq High/Low Logic Index
True bear market bottoms are almost invariably marked by the number of stocks making new lows overwhelming the number of new highs. To some extent, that has already happened. But the Nasdaq High/Low Logic Index usually (though importantly - not always, and sometimes a bit early) gives a specific alert before the onset of a new bull market.
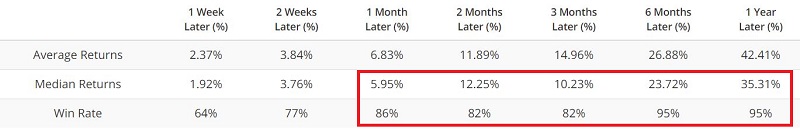
The chart below displays those times when the 10-day average of the Nasdaq Hi/Lo Logic Index was below 0.30, and the table shows a summary of performance results.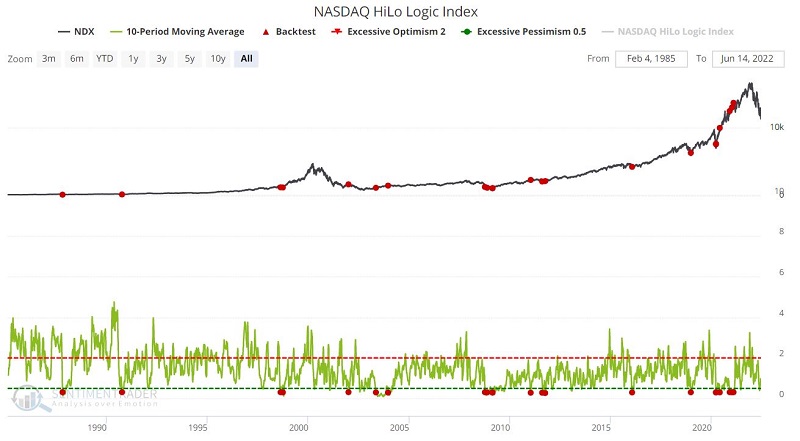
Equity Risk Premium
The Equity Risk Premium indicator shows the earnings yield on the S&P 500 minus the interest rate on 10-year Treasury notes. The higher the risk premium, the more attractive stocks are relative to bonds. This value tends to "spike" as a significant stock market low approaches.
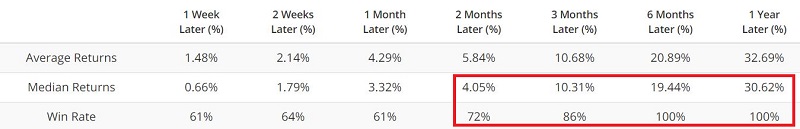
The chart below displays those times when the Equity Risk Premium crossed above 5, and the table shows a summary of performance results.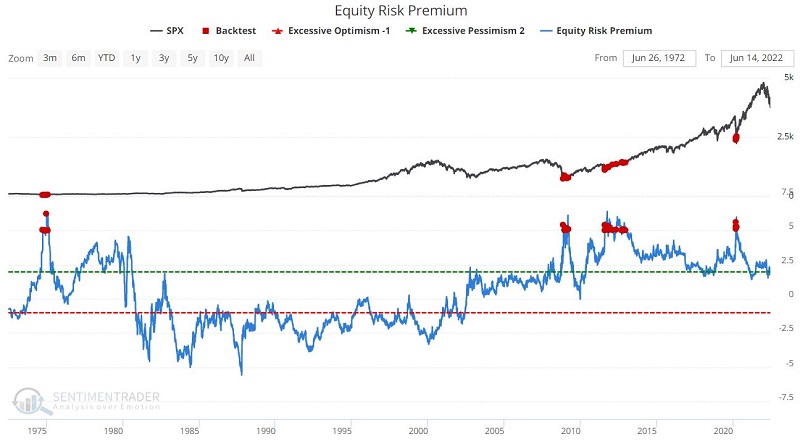
The lack of a spike above five does NOT mean the market hasn't bottomed - as not such a spike marks every bottom. But it is still worth monitoring this indicator because if such a spike does occur, it will likely highlight a significant buying opportunity.
VIX
The VIX measures the implied volatility (i.e., estimated future volatility) of near-term at-the-money SPX (S&P 500) index options (click here for an excellent overview of options by the CBOE).
The common interpretation of VIX movements is that the VIX will rise when fear or uncertainty does since there will be greater demand for put options. Conversely, when the market is rising, that typically creates complacency on the part of traders, and the VIX will fall as the demand for put options decreases.
There isn't a "magic number" for VIX, but we will pretend there is for the moment. True market panics have typically seen VIX cross above 45. However, sometimes a cross above 45 marks the beginning to middle stage of a waterfall decline leading up to a market bottom (i.e., the classic "trying to catch a falling safe" scenario). The chart below highlights those times when VIX crossed back below 45 for the first time in a month. Note that we will use the Nasdaq 100 Index (NDX) for performance results since it tends to rally more strongly than the S&P 500 Index in the early stages of a bull run.
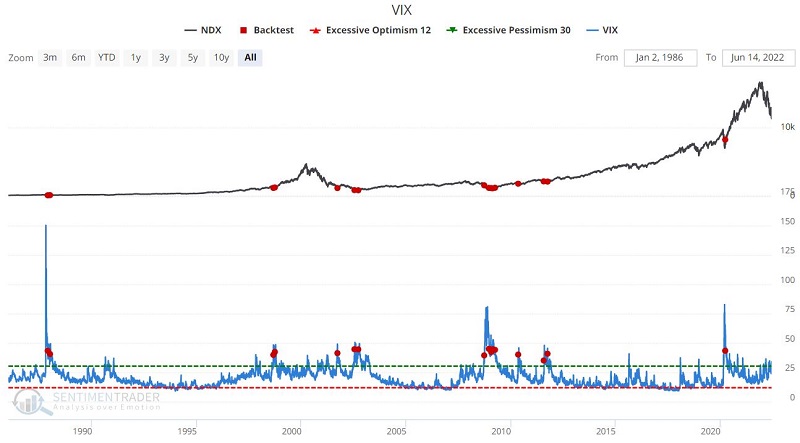
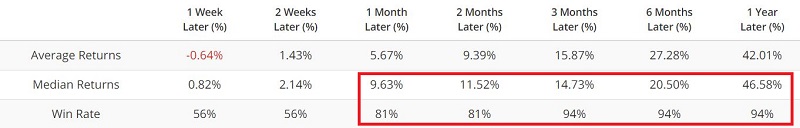
The table below displays a summary of NDX performance results following a drop by VIX below 45 (1st time in a month).
What the research tells us…
There is no guarantee that the stock market will follow the long-term mid-term election year seasonal trend and form a bottom sometime between now and September. However, if the market does stage another down leg, investors may be wise to keep a close eye on the indicators detailed above for signs of a meaningful market bottom.