
TradingEdge: Initial signs of a recovery, even with weak breadth and bad economic data

This is a recap of the most notable research published during the week. News flow continues to be horrid, but stocks responded in a "less bad" way, at least on the surface. Overall, signs of a recovery are isolated and tepid.
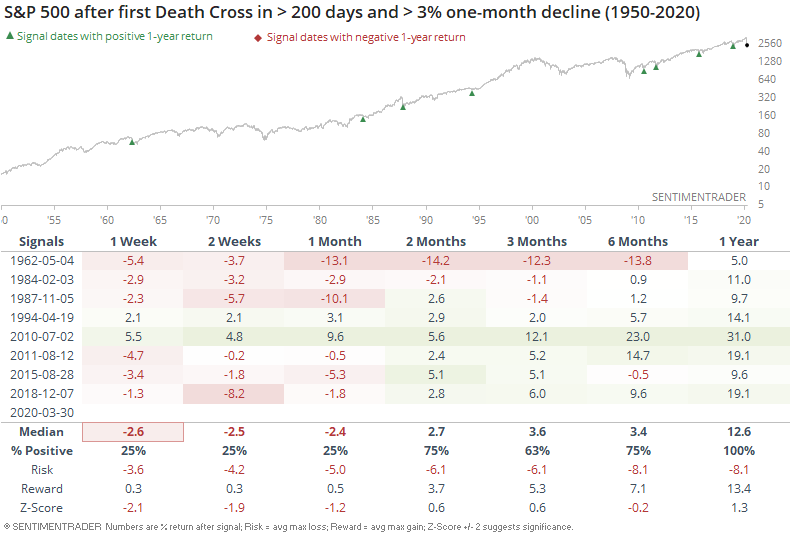
A technical sell signal
To start off the week, stocks suffered a technical sell signal. This kind of thing tends to get a lot of mainstream financial media attention because it sounds ominous, but the Death Cross has not been a consistently good reason to expect further losses. That's especially the case when they trigger due to quick, sharp downside moves, and especially since 1950.
While the short-term was iffy, and often preceded a testing phase of the initial low, the S&P was higher a year later each time.
Signs of recovery
Even with that sell signal, stocks had been recovering. The "market" is not just stocks, though, and there has been a lot of tumult under the surface. Outside of stocks, there haven't been too many compelling signs of an all-clear recovery.
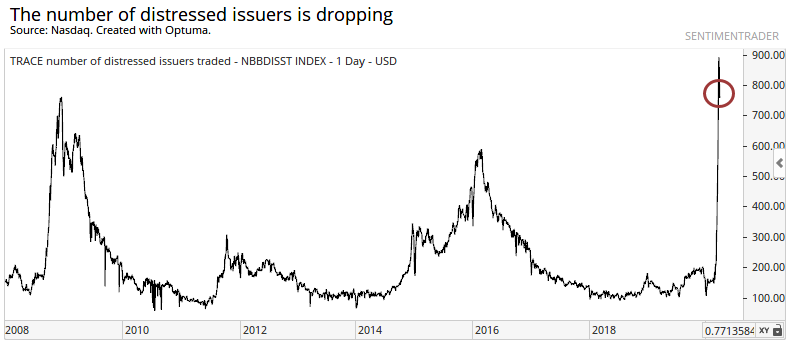
There are still a record number of bonds considered distressed. These signs of distress need to ease more than they have, and even late in the week, their recovery has not been conclusive.
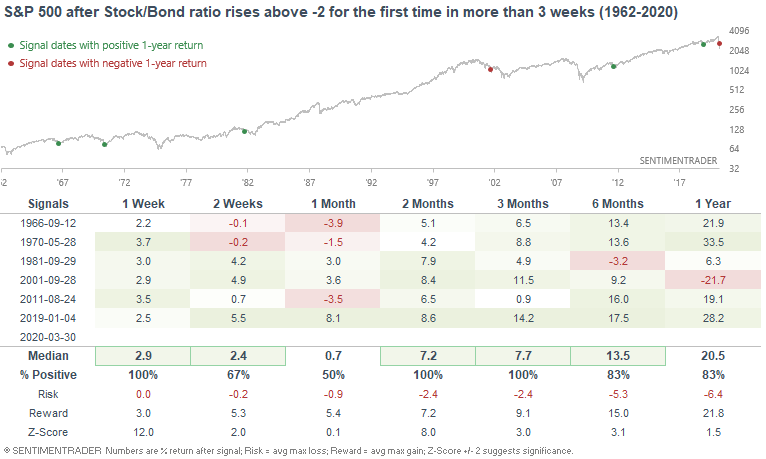
Still, between the two major markets - stocks and bonds - it's possible that the March moves were so extreme that it created an inflection point. Many of our indicators hit a historic extreme and have started to recover, like the ratio between stocks and bonds.
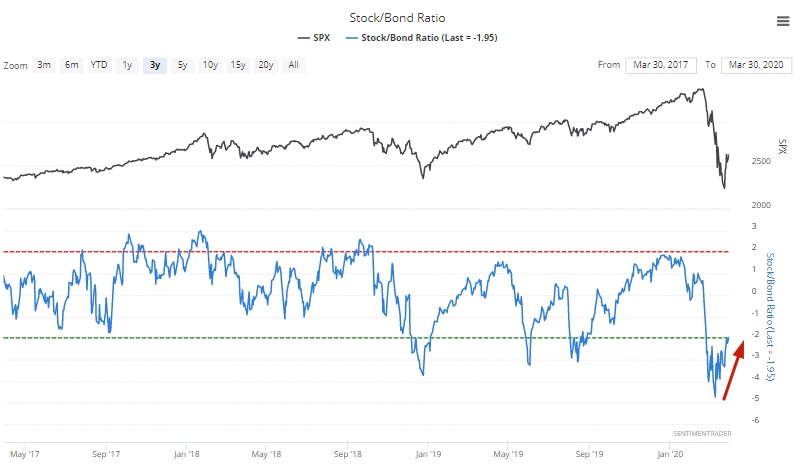
When that ratio has been extremely stretched and then showed signs of recovery, stocks tended to keep going.
For many stocks within the S&P 500 and other indexes, the recovery has been enough (and lasted long enough) that a record number of them have triggered buy signals in the MACD indicator.
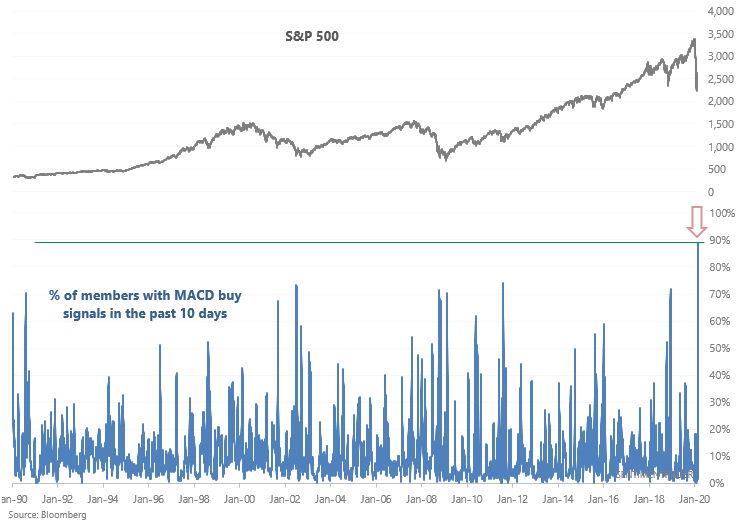
While not a perfect signal, other times there was a thrust like this after a major decline, it tended to signal that the worst was over.
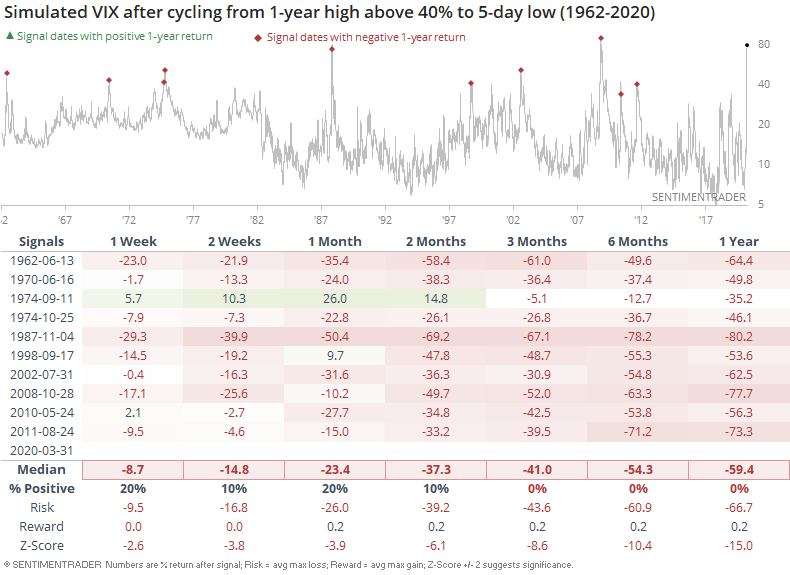
Volatility has been starting to calm down after what was a record stretch by some measures. A simulated VIX indicator has moved to a 1-week low after spiking higher. That has led to consistently lower volatility.
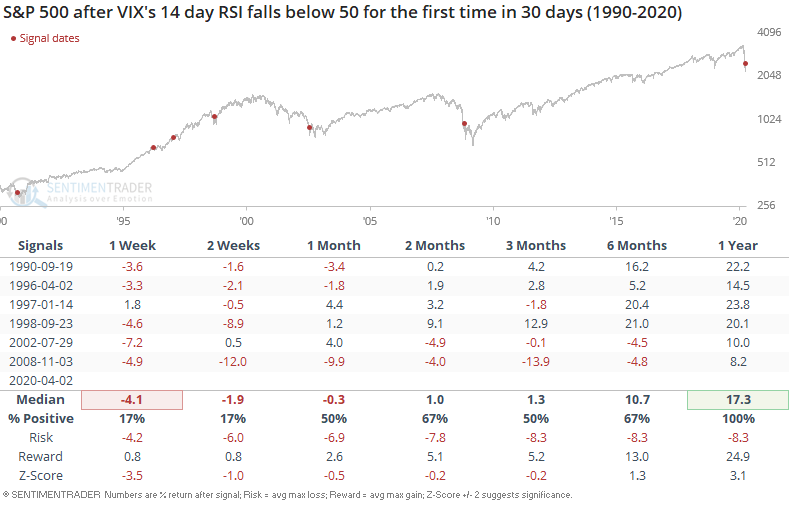
The actual VIX is coming down, too. Its Relative Strength Index has dropped below 50 for the first time in well over a month. That often led to a quick rebound in volatility, but long-term recovery in stocks.
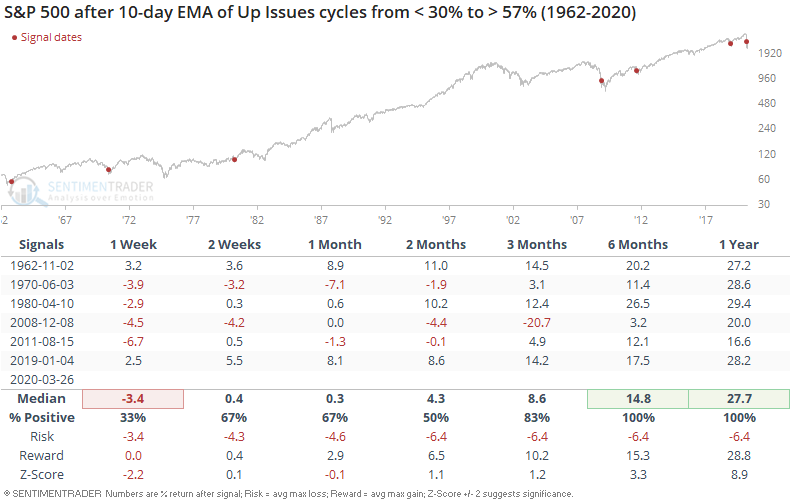
A thrust, but breadth still weak
Even though the recovery in the indexes has been impressive, last week's breadth thrust was confined to essentially a 3-day period. While that wasn't enough to technically trigger a Zweig Breadth Thrust, the fact that it originated from such a low level is important.
Even though there has been weak participation on some of the up days lately, that, too, hasn't been much of a warning.
Pricing in the worst
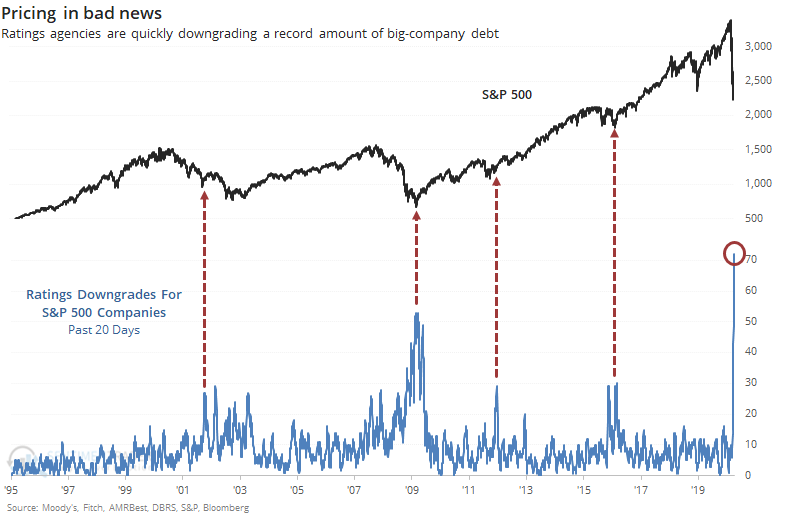
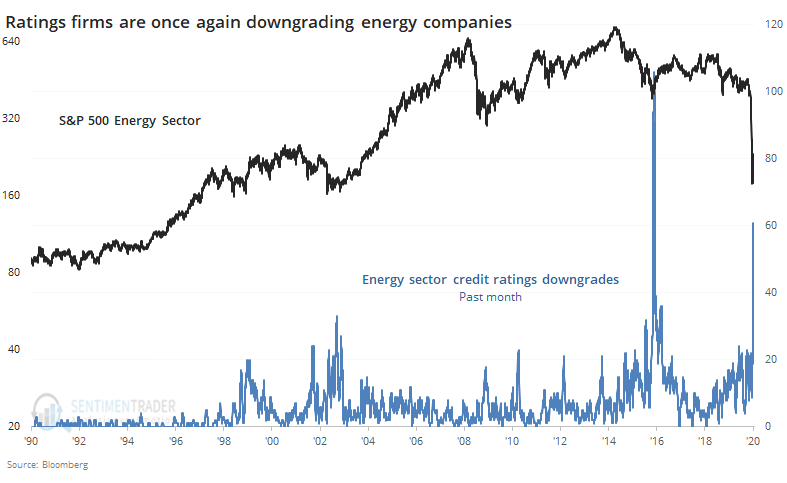
Now that some of the disastrous economic consequences are starting to be reflected in the data, and the major ratings agencies are doing something they absolutely loathe to do - downgrade the debt of their best customers.
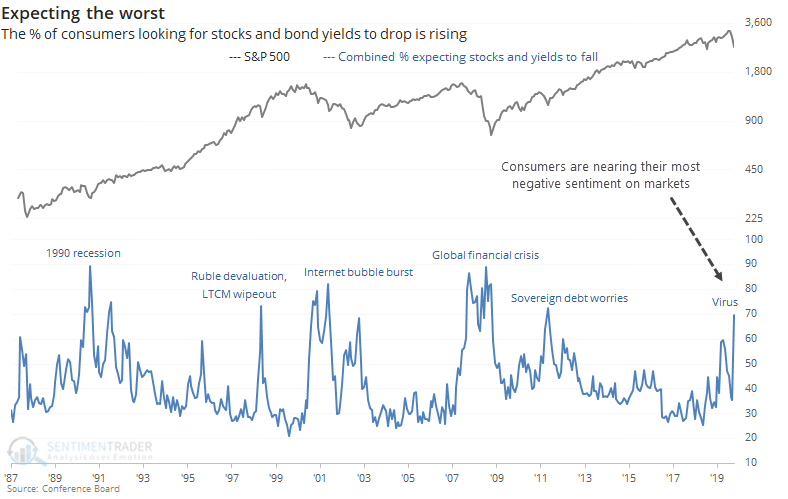
All of the bad news has been hitting consumer confidence. There has been a big jump in those expecting stocks (and bond yields) to fall.
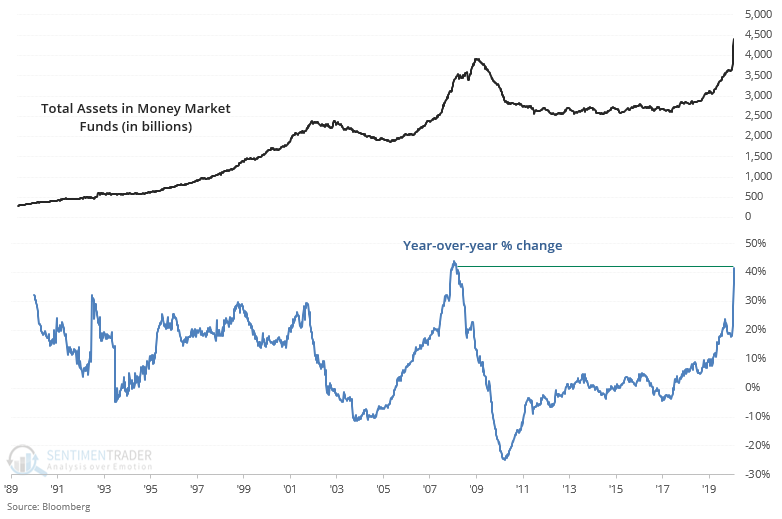
So, with few places left to hide, they continue to rush into the safety of money market funds.
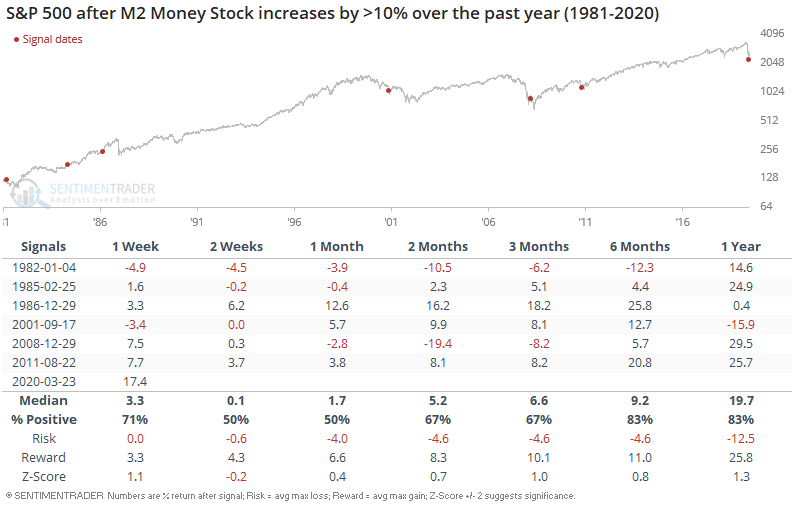
The bad economic data and outlook triggered moves by the Fed, resulting in a massive change in the money supply.
At least the decline has been triggering more compelling valuations, particularly in some sectors like energy.
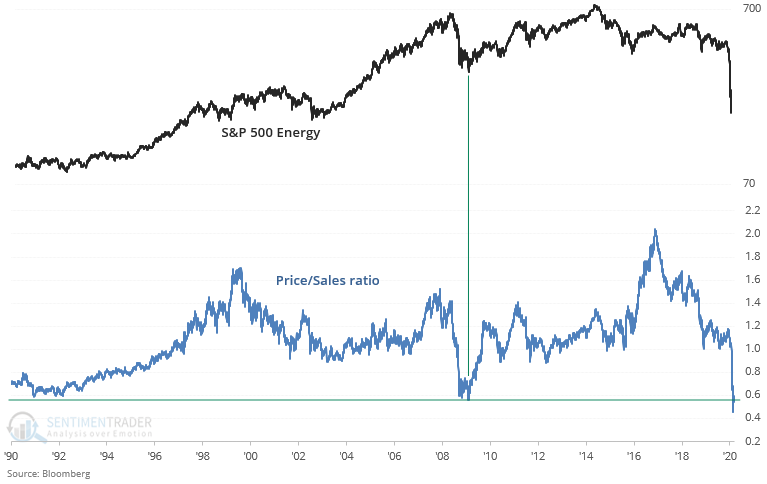
Rating companies have not been enamored with their prospects.
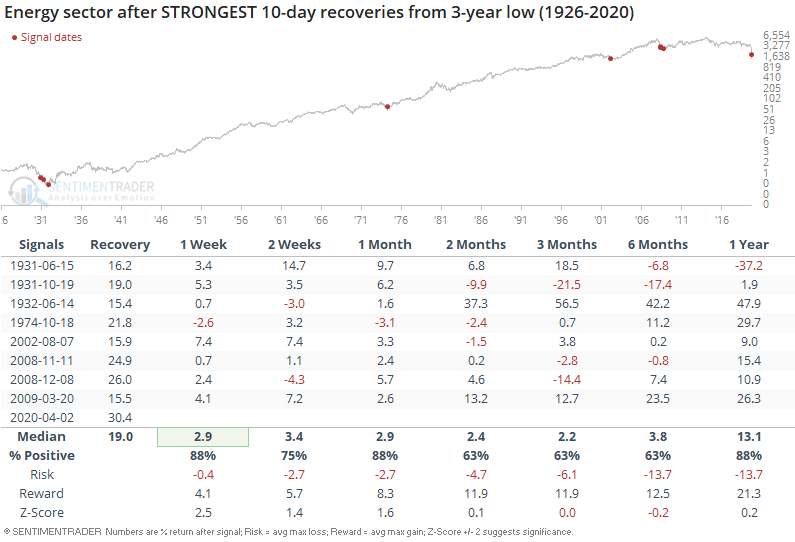
But at least investors there have some glimmer of hope since there are nascent signs of a recovery. That can (and will) change on a dime depending on the latest geopolitical headlines. If history is any guide here, the recovery so far is a good sign.
Overall, there wasn't much this week that suggested there is a strong sign that stocks, and other markets, have fully turned the corner. Last week's historic surge in buying pressure, following what had been a historic level of selling pressure, remains the most compelling medium-term positive sign for stocks. In bonds and gold, optimism remains elevated and a more normal market would see those relax if and when investors become more comfortable with riskier assets.
This week didn't add (or subtract) much to that equation, other than some signs that some extremes have started to reverse and while that has often triggered short-term losses, it usually preceded medium- to long-term gains.