
TradingEdge for Mar 4 - More pessimism but not yet panic, crude surge triggers energy extremes

Key points:
- Small options traders have been paying up for the right to protect their portfolios
- That comes as fewer stocks are holding above their long-term trends
- It has also caused newsletter writers to become bearish for the first time in almost 2 years
- Pessimistic readings have caused the medium-term risk level to fall
- Even though pessimism has been high, investors (especially in credit) are not panicking
- Consumer Staples tend to do better than Discretionary stocks when inflation is high (or low)
- A couple of warning signs for energy
Small traders pay up for protection
Two weeks ago, small options traders spent a tremendous amount of their volume on protective put options. They took a mild break after markets initially rebounded but now are at it again.
Last week, they spent 29% of their volume on buying put options to open, among the highest levels in 22 years. Due to the rising cost of hedges as implied volatility soars, small traders spent almost as much premium on buying put options as buying call options, approaching a very rare flip for these optimistic traders.
Last week, the smallest of options traders bought $4.3 billion worth of put options and $4.5 billion worth of call options. So, their spending on hedges was 96% of their spending on speculation, one of the highest ratios in 22 years.
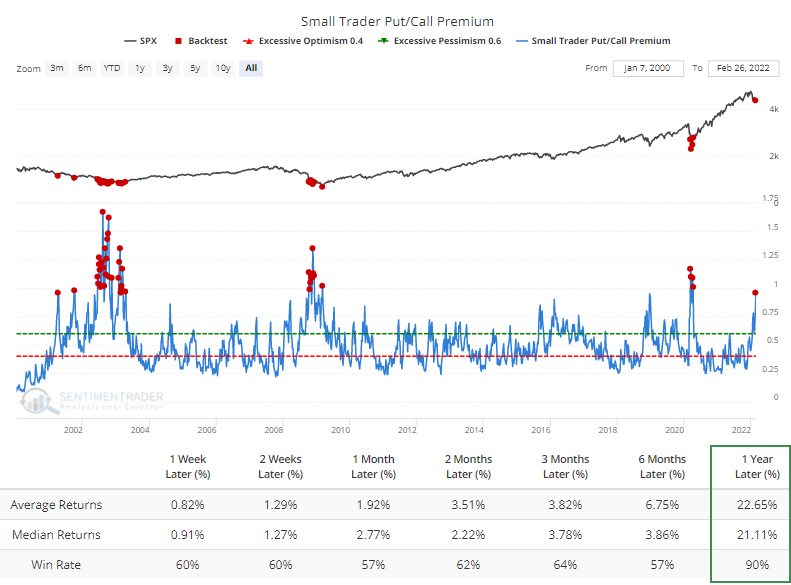
There are two sides to any trade, so somebody takes the other side of this put activity. Estimates of dealer exposure and how much underlying stock they may need to buy or sell are currently showing potential buying demand equivalent to about 0.1% of the S&P 500's market capitalization. That doesn't sound like much, but the Backtest Engine shows excellent medium- to long-term returns when Gamma Exposure has been at this level or beyond.
Participation cycles to a low level after near-record high
Last spring, stocks had one of their best months in history. Participation within the S&P peaked in April of last year, with more than 95% of stocks in the index trading above their 200-day moving averages. That was one of the most extreme readings in nearly 100 years.
With the latest leg down last week, that figure eroded significantly, with fewer than 40% of stocks holding above their long-term averages. As we note consistently, healthy markets tend to see this metric hold above 60%, with dips below 40% attracting buyers. So far, that's been the case, but it would be better if we saw this rebound (and hold) above 60%.
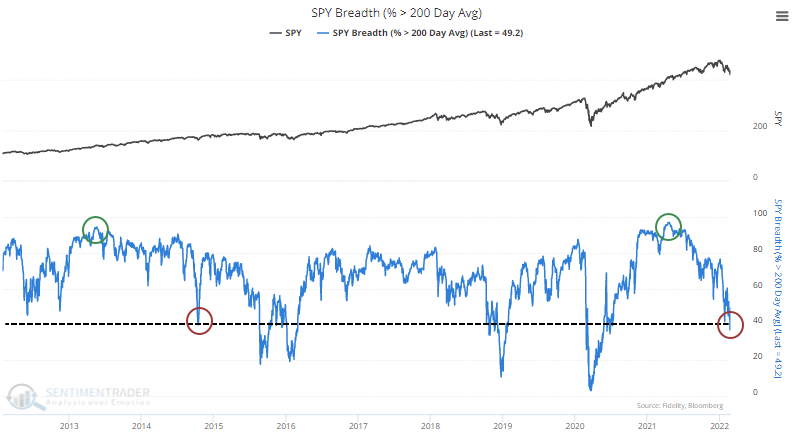
Dean noted on Monday that it was a relatively quick reversal from more than 80% of stocks holding above their average to fewer than 50%. Quick reversals above and below those thresholds had a decent track record of preceding rebounds.
If we expand the thresholds to include the extremes over the past year, then the table below shows every time the S&P 500 went from having more than 90% of its member stocks above their 200-day averages to fewer than 40%.
Curiously, it has taken a long time to see this cycle play out. While the trip from above 80% to below 50% happened in under 30 days, it has taken more than 6 months to go from above 90% to below 40%, just like it did in 2014. This tells us that after the massive participation last spring, buyers have been relatively intent on staying involved. Turns out, that's a pretty good sign.
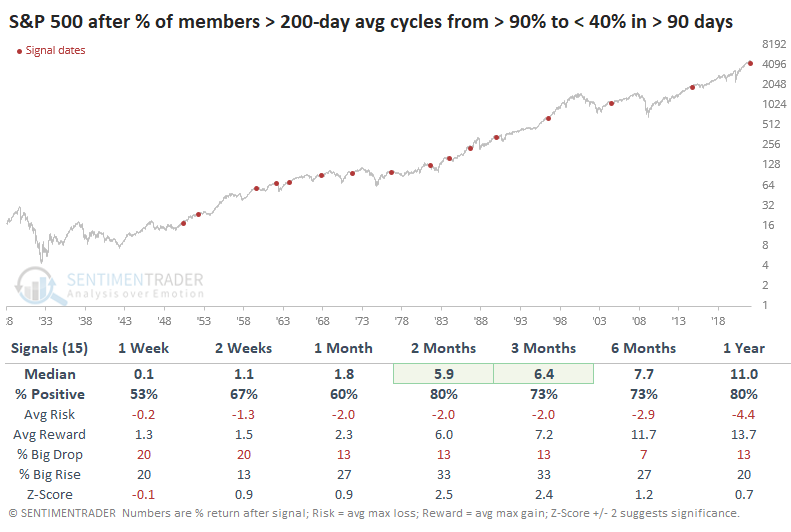
Once we saw fewer than 40% of stocks holding above their 200-day averages, the S&P rebounded consistently over the next 2-3 months and beyond, with a good median return and risk/reward ratio. There was a severe loss in 1962 that took a year to recover, and the signal in 1981 wasn't great, either. Other than that, returns were quite good.
Newsletter writers turn bearish for the 1st time in almost 2 years
Investors aren't panicking, but they sure aren't very bullish, either. On an average day over the past week, nearly 30% of our core indicators have recorded a pessimistic extreme. That's the most since April 2020.
Still, more and more indicators are falling out of neutral, including real-money gauges and surveys. One of the granddaddy surveys from Investor's Intelligence showed that more newsletters expect stocks to decline than rally in the months ahead. This is the first week with fewer bulls than bears in nearly 2 years. This ends the 6th-longest streak of bullish sentiment since the survey's inception.
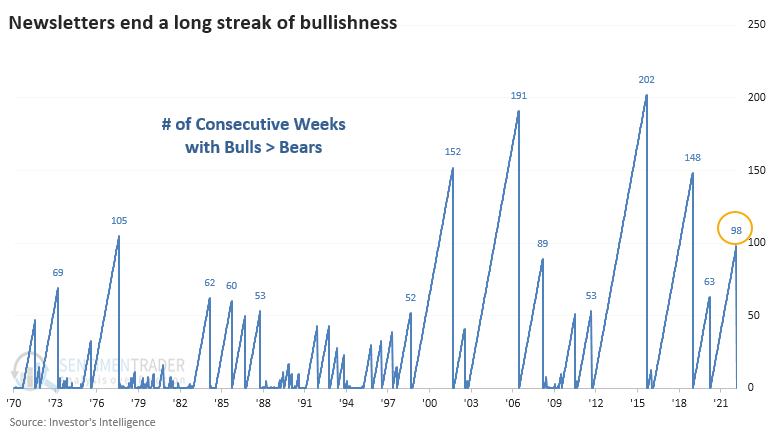
The ends of other long streaks of optimism tended to be a good sign for the S&P 500. While we prefer to see optimism rising instead of falling, by the time that pessimists accounted for the majority of newsletters, most stock declines were behind us. Over the next 2 months, the S&P rallied after 11 out of 13 precedents. The only two losses were in the 1970s.
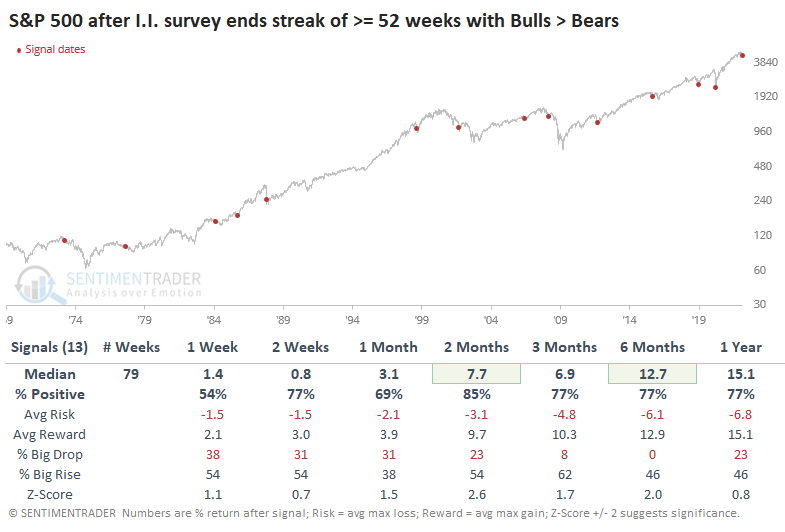
It was also a mostly good sign for the other major indexes. The Dow Industrials did the best in the short term, while the Nasdaq took the lead after that. Among sectors and factors, Technology stocks showed the most consistently impressive average returns, with Industrials and Discretionary doing well, too. Over the next 6 months, Value stocks gained after 12 out of 13 signals.
Medium-term risk levels have dropped
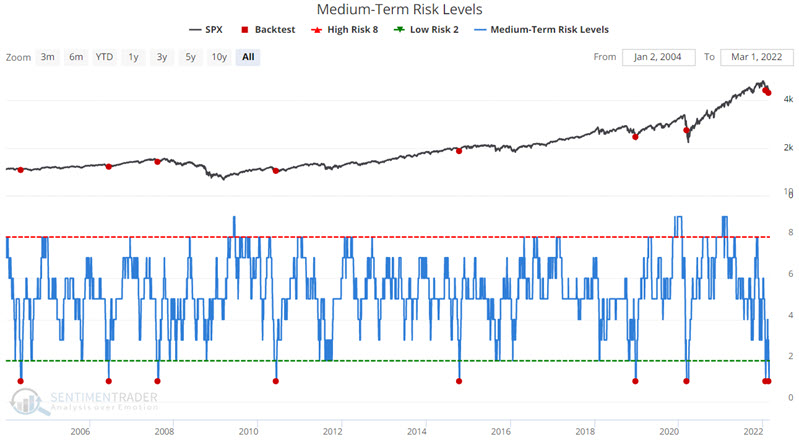
Jay showed that Medium Term Risk Levels (for stocks) recently hit its lowest level for the second time in the past month. The chart below displays all days when Medium-Term Risk Levels drops from 2 or higher down to 1.
Smart Money - Dumb Money spread has reached an extreme
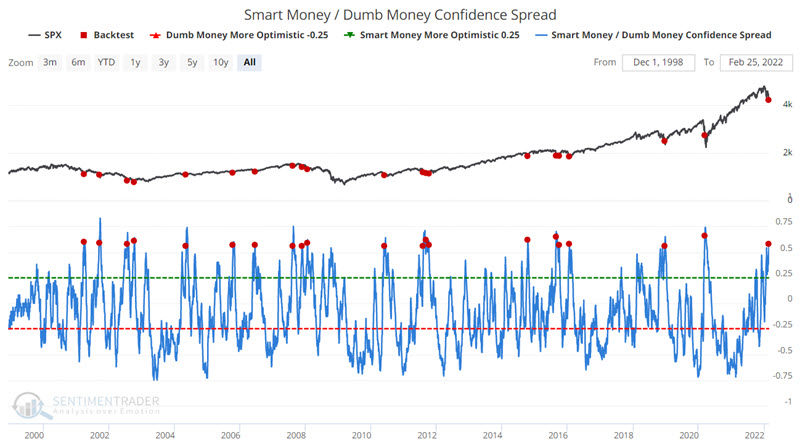
Jay also noted that the more significant the gap between Smart Money Confidence and Dumb Money Confidence, the more meaningful the information.
The chart below displays those days when the Smart Money / Dumb Money Confidence Spread crossed above 55 for the first time in a month.
Let's consider the following approach to using these signals:
- Each time the spread exceeds 55 for the first time in a month, we will hold the S&P 500 Index for 42 trading days.
- If a new signal occurs while an existing signal is active, the holding period is extended for another 42 trading days.
- So, if only one signal occurs, the holding period will be 42 trading days; If there are overlapping signals, the holding period will be longer
The chart below displays the hypothetical growth of $1 invested in the S&P 500 Index only as described above.
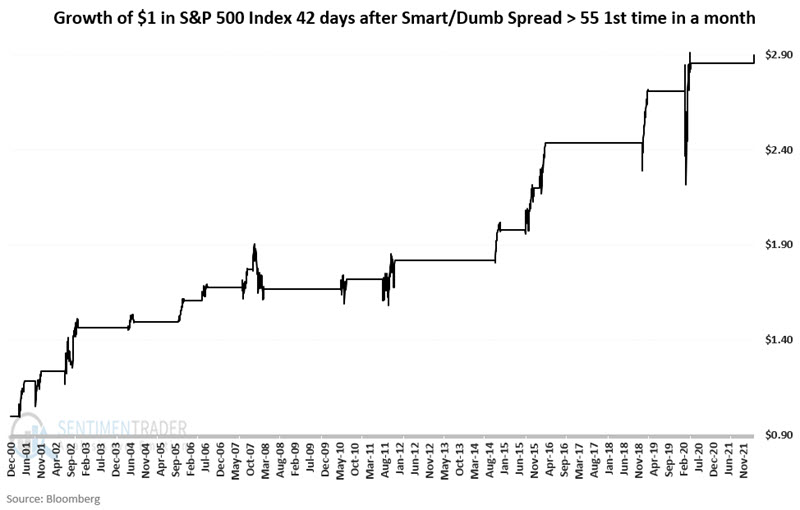
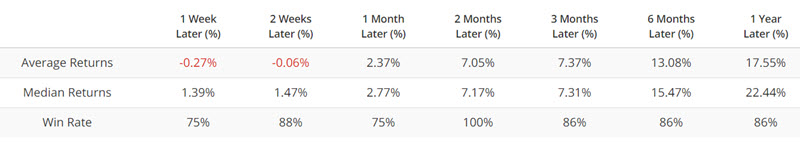
Of the previous signals, 15 of 16 (94%) have shown a gain, averaging +6.9%. The maximum gain was +18.3% while the maximum loss was -5.8%.
Investors are pessimistic, but not panicking (especially in credit markets)
If ever there was a time for investors to panic, now is about as good a time as any. The one-two combination of skyrocketing inflation and a potential multi-country war should have been the last straw. Curiously, however, investors haven't panicked.
Sure, some readings show pessimism, like we saw above. But the Panic Button has not been pressed. The Panic Button incorporates volatility, interest rates, liquidity, bond spreads, and default protection costs to highlight those periods of outright terror when markets tank. When there is a crisis that spreads across markets and geographies, these measures tend to rise in tandem.
We discussed the Panic Button after it was triggered in January 2016 and March 2020, but it has been curiously flaccid lately. It's still sitting at zero. Stocks perform best when there is not a heightened sense of panic (the vast majority of days) or when there is extreme panic. It's the middle-ground when there is trouble enough to trigger only a little bit of panic that's the most dangerous time for equities.
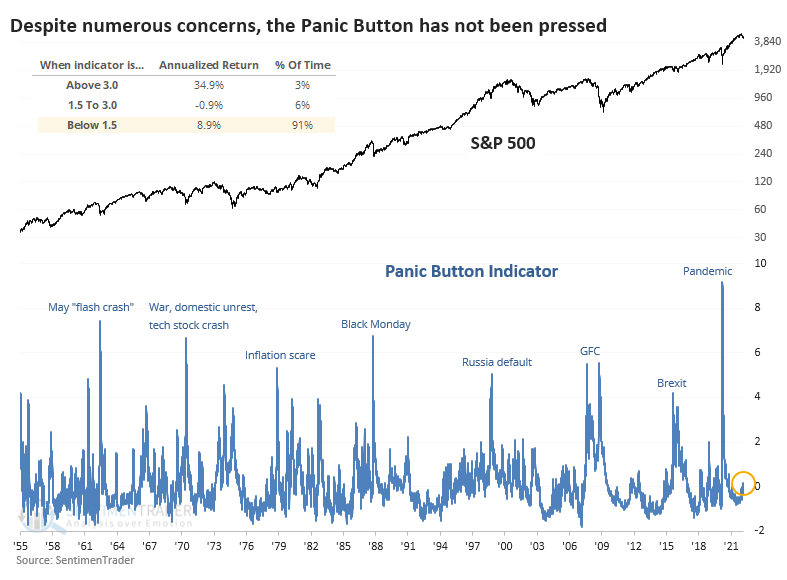
Typically, we look to fade extremes. When investors panic in both directions, markets have a high probability of going the other direction. So, when we've looked at the Panic Button in the past, it was related to a high reading.
Since investors have not panicked this time, perhaps that's a bad sign. To check, the table below shows every time over the past 70 years when the S&P 500 fell into a correction, but the Panic Button was moribund, not rising above 0.5.
It's somewhat surprising that while medium-term returns were nothing special, and there was a double-digit loss in there, it was mostly a non-event. And over the next year, the S&P 500 showed a positive return after 10 out of 11 signals.
Later in the week, pessimism was ebbing
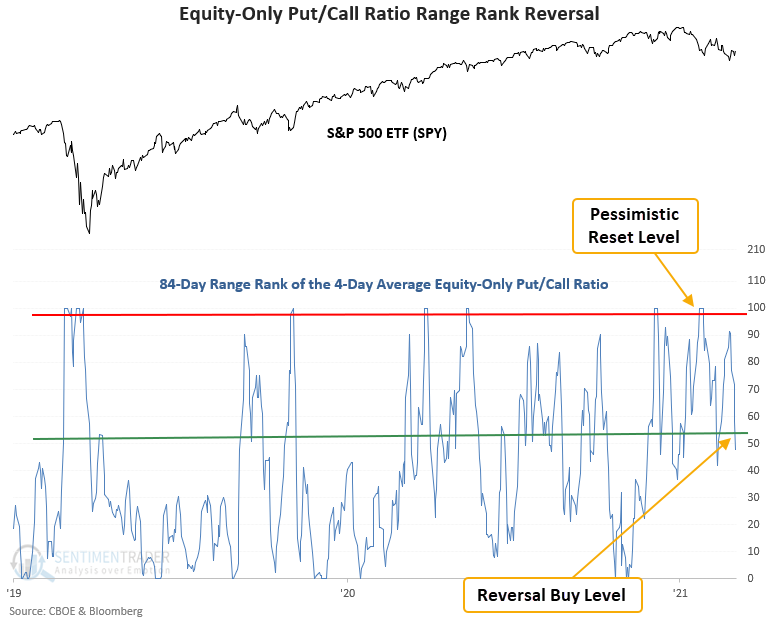
When investors are bullish on stocks, they buy call options to bet on rising prices. Conversely, when they are bearish on stocks, they purchase put options to bet on declining stocks. The equity-only put/call ratio can be used as a contrary indicator to identify an environment where sentiment has become too pessimistic on the future direction of stocks. When opinions become too bearish, stocks tend to rally.
Dean showed a trading model that applies an 84-day range rank to the 4-day moving average of the CBOE equity-only put/call ratio. The pessimistic reset condition is confirmed when the range rank indicator crosses the 99th percentile. A new buy signal occurs when the range rank crosses below the 54th percentile. Within 5 days of the cross, the 5-day rate of change for the S&P 500 must be >= 3%. i.e., market momentum is positive.
The signal did not trigger when the range rank crossed below the threshold level in February because the momentum condition was invalid.
This signal triggered 43 other times over the past 25 years. After the others, S&P future returns, win rates, and risk/reward profiles were excellent across all time frames. The signal shows positive performance at some point in the first month in 41 out of 43 instances. And, the max drawdown of 7.6% occurred within the depths of the global financial crisis.
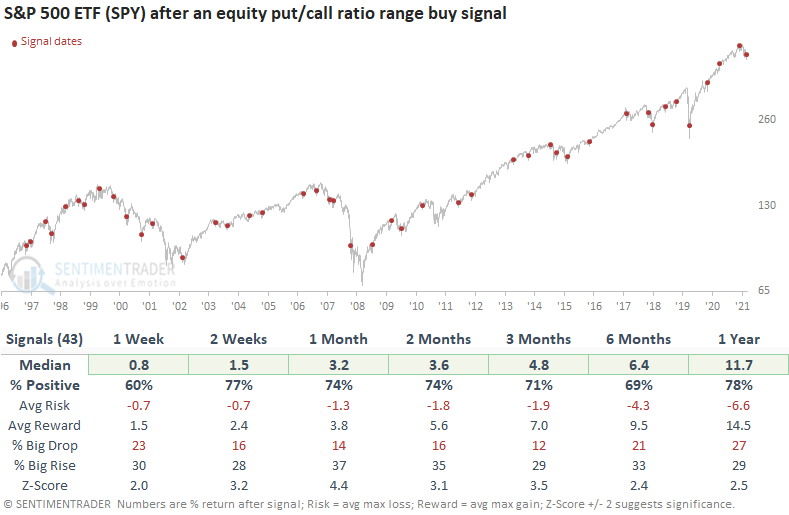
When equity-only put volume increases relative to call volume, traders have become too pessimistic on the outlook for stocks. Stocks are likely to trade higher when the pessimistic extreme reverses. Similar setups to what we're seeing now have preceded rising prices for the S&P 500 ETF (SPY), with a 2-week win rate of 77%. Drawdowns were relatively benign, even in nasty bear markets.
Using inflation to switch between Consumer Staples and Discretionary stocks
Being in the right sector at the right time is one of the lesser appreciated keys to above-average performance. The level of price inflation impacts purchasing power and thus affects different sectors differently. Jay researched performance for consumer staples versus consumer discretionary based on varying levels of inflation.
The rules are simple. If inflation is:
- Relatively high (greater than or equal to +3%) OR relatively low (less than or equal to -3%, i.e., deflation) we will favor consumer staples
- Within a range of relatively mild readings (greater than -3% to less than +3%), we will prefer consumer discretionary
For testing, we will use S&P Industry Group data from Bloomberg dating from January 1, 1927, through February 28, 2022. The cumulative returns for each sector based on inflation at the end of the previous month appear below.
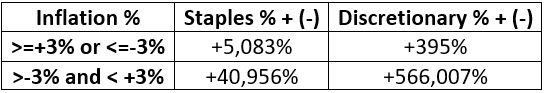
The bottom line is that discretionary has vastly outperformed over a long period of time when inflation is moderate, and staples have significantly outperformed when inflation is abnormally high or low.
The chart below displays the growth of $1 invested in staples and discretionary sectors ONLY when inflation is above 3% or below -3%.
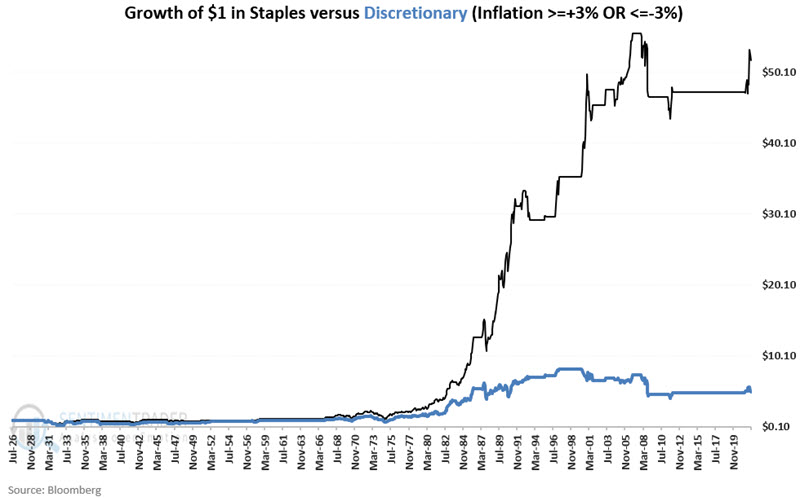
In a macro sense, the consumer discretionary sector represents "wants," and the consumer staples sector represents "needs." Because inflation impacts purchasing power, it affects people's buying decisions. When inflation is moderate, individuals are generally more comfortable spending their money on "wants." However, when inflation is abnormally high or low, individuals tend to focus primarily on spending their money on "needs." The long-term results displayed in the charts above suggest that this theory is true.
A couple of warning signs in energy
The war in Ukraine has lit a rocket under energy products. When a market starts to rally vertically, a) no one knows when the rally will end or how far it will run, but b) when the end comes, the reversal can be swift and severe. Jay showed that some key warning signs are beginning to flash in crude oil and unleaded gas markets.
The term structure of crude oil futures shows the relationship of the near-term futures contract to a further-out contract. If it is above 1.0, the near-term contract is priced higher than the further-out contract, called backwardation. If below 1.0, then the market is in contango. Severe backwardation (i.e., high term structure indicator readings) typically highlight times when the crude oil is forming a top (although it can take a little while to get there).
The chart below displays all days when crude oil term structure was above 1.20 - including the most recent reading on 3/2/2022.
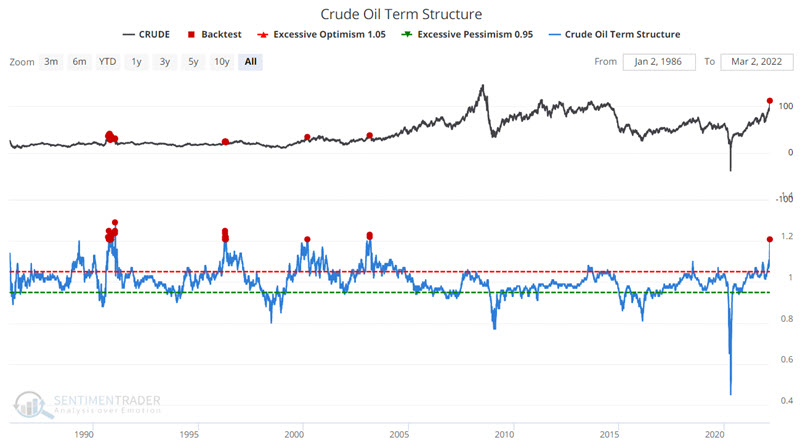
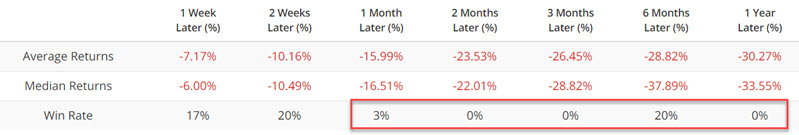
These results do not guarantee a significant reversal in crude in the months ahead. However, they suggest that traders should be prepared for just such an occurrence. Because historical results are strongly negative across the entire 12 months, they suggest waiting for some clear sign of a reversal before considering the short side - i.e., do not attempt to "pick the top," nor sell short into the teeth of a parabolic rally.
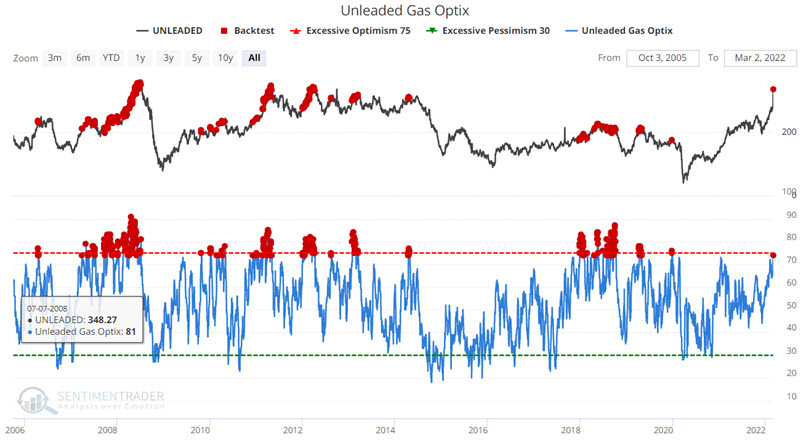
The chart displays all days when unleaded gas Optix was above 73.9. A close look reveals some occasions when price continues to power ahead for quite some time before peaking and other occasions when price tops out in relatively short order. There is no way to predict which scenario will play out this time around.
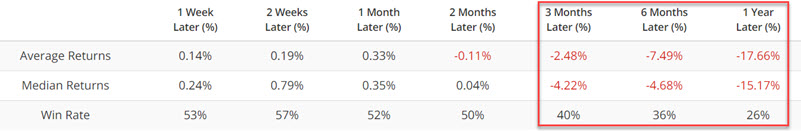
The results are by no means uniformly bearish. However, in the table below, we see a tendency for significant price weakness 3 to 12 months out.
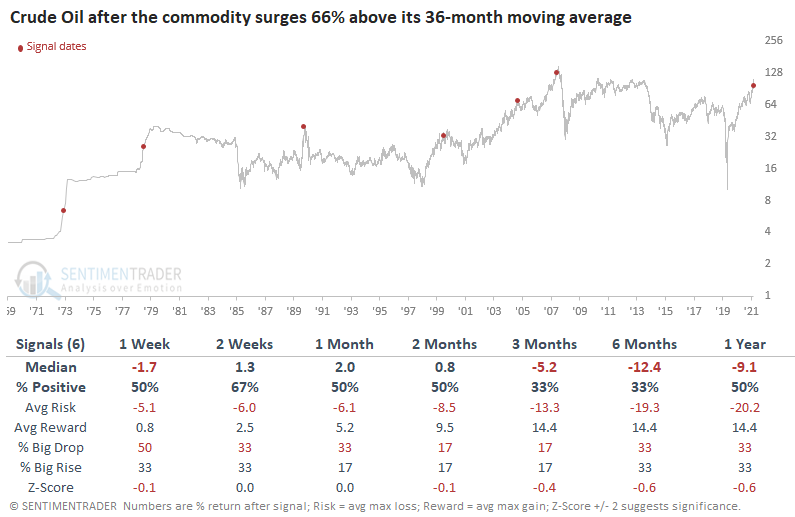
Crude surge causes headaches for energy and stocks
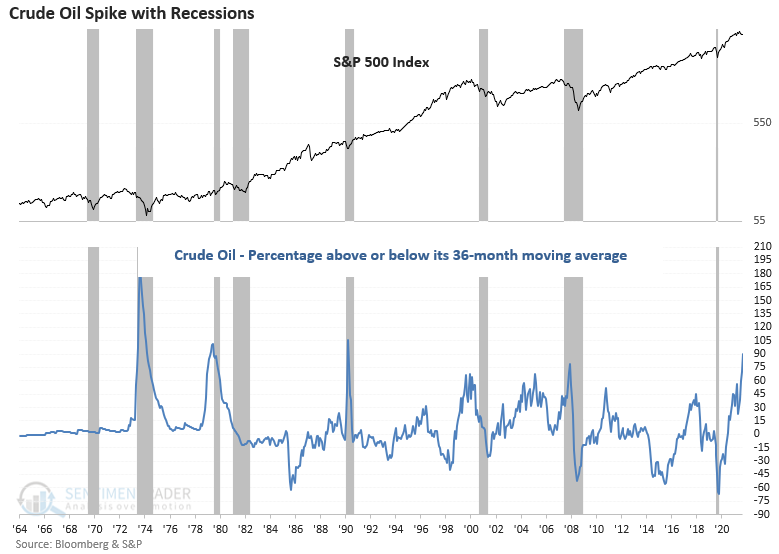
Dean pointed out that crude oil and other commodities have been in solid uptrends for some time now. The Russia/Ukraine conflict has impacted near-term price action, causing massive spikes in several markets like energy, metals, and grains. As of 2/28/22, crude oil traded 68% above its 36-month moving average.
Several surges in crude oil have coincided with bear market periods and recessions for stocks.
This signal triggered 6 other times over the past 49 years. After the others, S&P 500 future returns, win rates, and risk/reward profiles were underwhelming across all time.
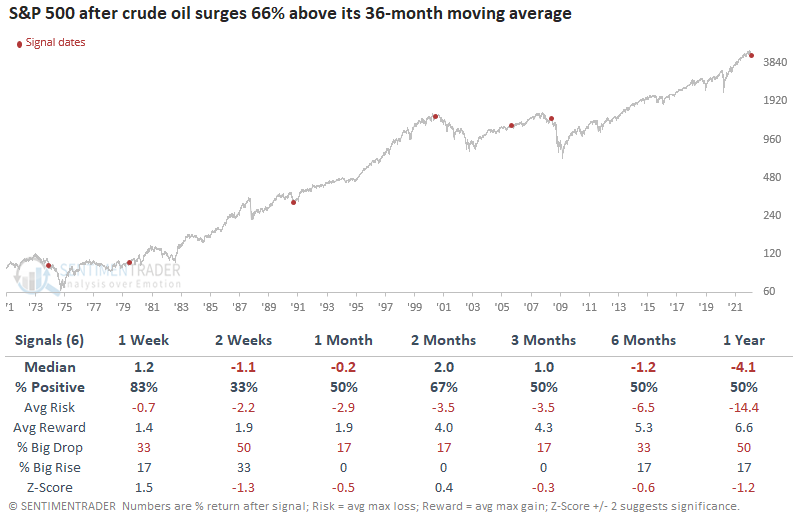
Longer-term returns tended to be worse for crude oil, with all signals in the past 40 years preceding negative returns 3-6 months later.
About the Weekly Wrap...
The goal of the Weekly Wrap is to summarize our recent research. Some of it includes premium content (underlined links), but we're highlighting the key focus of the research for all. Sometimes there is a lot to digest, with this summary meant to highlight the highest conviction ideas we discussed. Tags will show any symbols and time frames related to the research.