
TradingEdge for Mar 18 - A sentiment driven decline, still-solid fundamentals, overseas weakness

Key points:
- Other 10-and-10 corrections for the S&P preceded medium-term rallies
- Smart Money Confidence has spiked to one of the highest levels in 23 years
- Inflation remains a headwind for equity investors
- Other fundamentals remain sound, however, with a high Macro Index Model reading
- Euro area stocks have been hammered
- Chinese tech stocks suffered a historic bout of selling entering mid-week
- Gold prices suffered a big reversal from a yearly high
The S&P's 10-and-10 correction caused Smart Money to step up
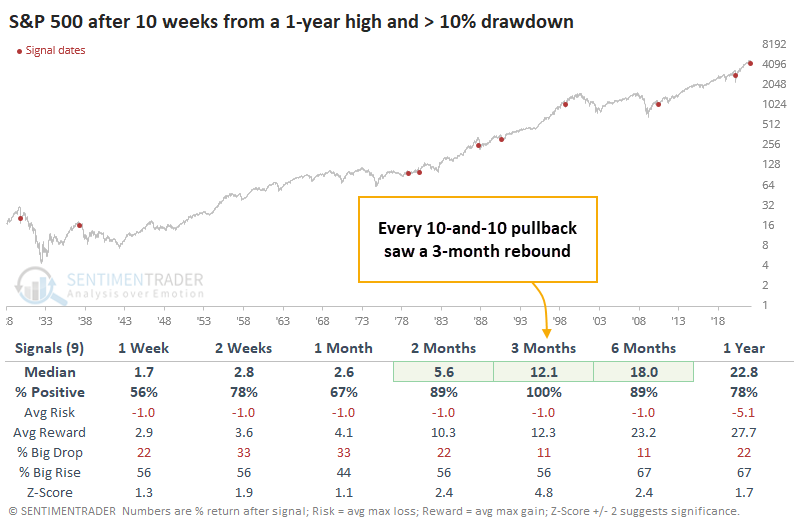
It's been less than 3 months, but it feels much longer. Now 10 weeks removed from the last weekly closing high in the S&P 500, the most benchmarked index in the world was still sitting more than 10% below its high point. Buyers' apathy and inability to build on even minor rallies is a hallmark of bear markets.
However, from price action alone, it's not clear that's where we're headed. So far, there haven't been any truly extreme price swings during this pullback, and 10-week, 10% drawdown corrections in the S&P's history haven't proven to be harbingers of doom. Far from it - the index rallied during the next few months after every "10-and-10" pullback.
Curiously, there have been no days with truly exhaustive selling pressure during this entire stretch. Despite the large (but not extreme) price swings, there have been zero days with more than 90% selling pressure. Volume is more volatile, but even so, there haven't been any days with less than 10% Up Volume.
The suggestion is that investors are relatively complacent. But while such behavior would certainly help more metrics reach compelling oversold levels, it's not necessarily required as the S&P rebounded after 6 of the 7 similar stretches since 1962.
At least some investors seem to be stepping up. With commercial hedgers covering some of their historic short positions against major equity index futures, Smart Money Confidence has been able to rise. It has now surpassed the peak from the pandemic.
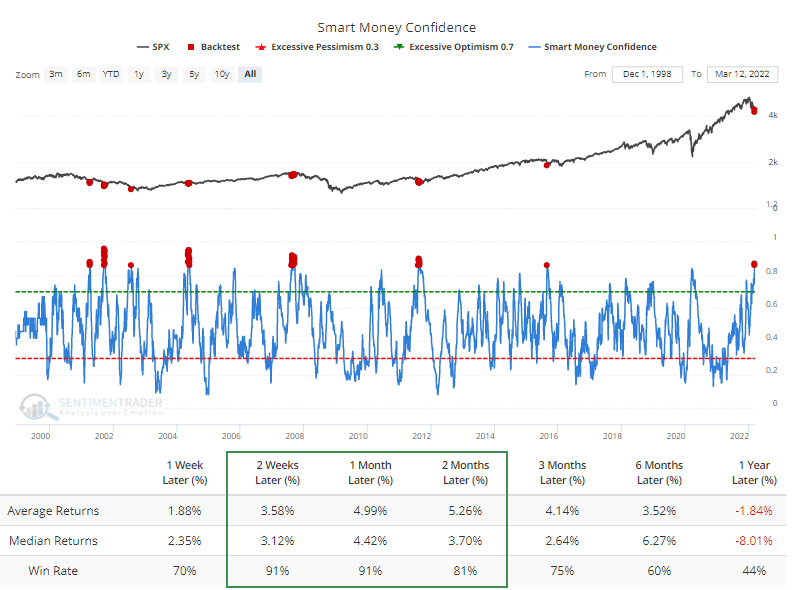
According to the Backtest Engine, the S&P 500 rallied during the next 2-4 weeks after 52 out of 57 days when the Smart Money was more than 85% confident in a rally.
Investors are in the "panic" phase of a Typical Sentiment Cycle
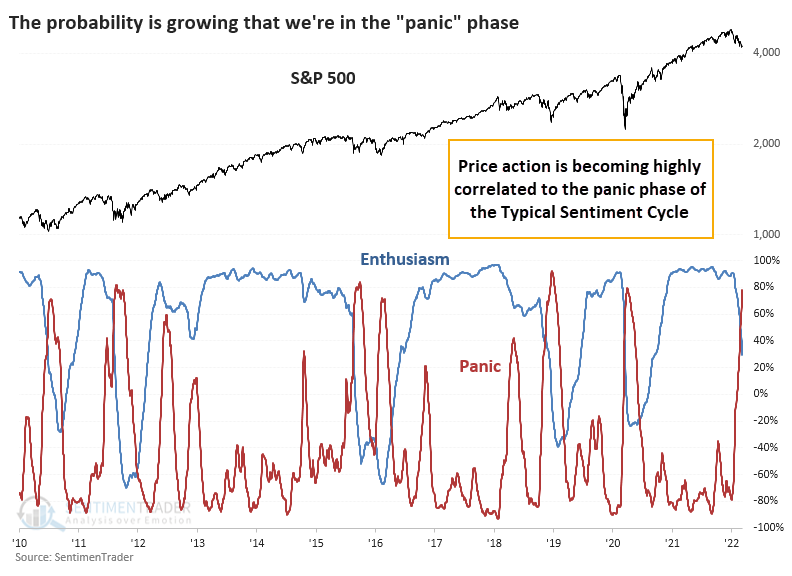
Last September, we looked at how correlated the price action was to the four major parts of a Typical Sentiment Cycle. A popular heuristic uses some version of the Cycle popularized by Justin Mamis in his 1999 book, The Nature of Risk.
Instead of eyeballing things, we can compare recent market activity to various parts of the Typical Sentiment Cycle and see how investors are behaving relative to an "ideal" cycle. Based on that analysis, they're panicking. The S&P 500's price action just climbed above a 75% correlation to the panic phase.
After the probability of being in the "panic" phase rose above 75% for the first time in at least a year, the S&P 500 performed okay. It did quite a bit better if the U.S. economy was not in a recession at the time.
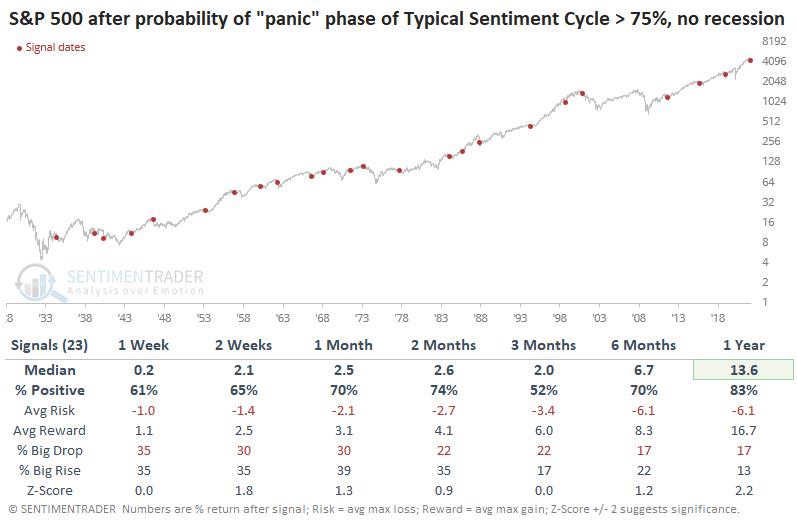
The entry into the panic phase of the cycle didn't mean that stocks rebounded quickly and sustainably every time. It preceded quick double-digit losses in 1946, 1962, 1987, and 2018. But, overall, reward exceeded risk, and the probability of a big rise exceeded that of a big drop.
Inflation remains a major concern
Jay took another in-depth look on inflation and its impact on market returns.
He took a look at how the stock market has performed when inflation is:
- Greater than or equal to +4% ("too hot")
- Less than or equal to -4% ("too cold")
- Greater than -4% but less than +4% ("just right")
The chart below displays the cumulative price performance for the Dow ONLY during those times when inflation was "too hot" as it is now.
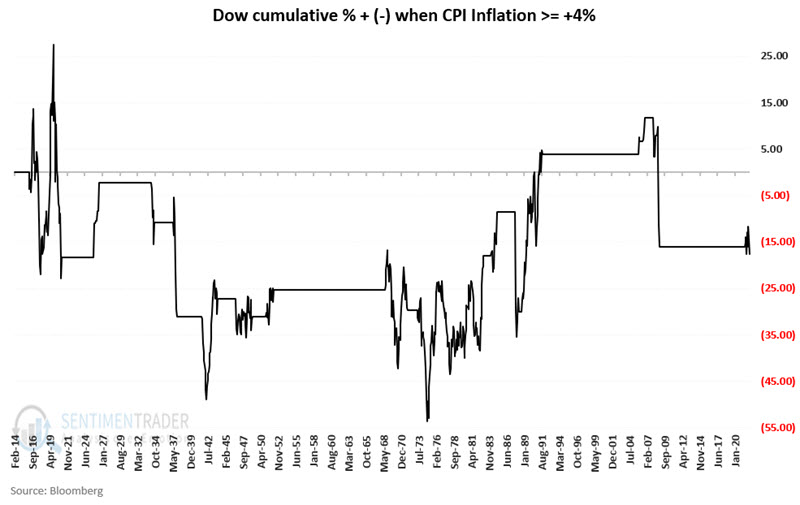
The result is a net price decline of -14.6%. In other words, despite the Dow gaining over 58,000% during the test period, an investor who held the Dow only when inflation was >= +4 would have lost money.
These results call the "stocks as a hedge against inflation" argument into question. On a buy-and-hold basis, yes, stocks have outperformed inflation over the long-term. But as you see in the chart above, during actual bouts of severe inflation, the stock market has been very much a mixed bag - with highly volatile and net negative returns.
Other fundamentals are still holding up, though
Jay looked further into some fundamental inputs, their impact on our Macro Index Model and what that suggests for returns in stocks going forward.
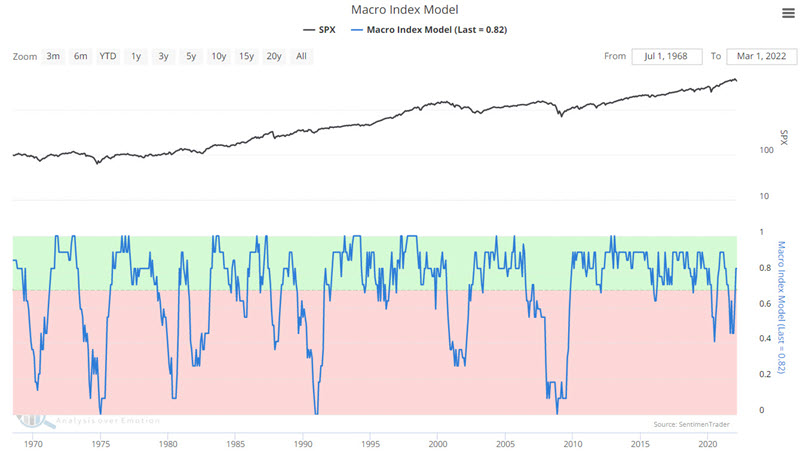
The U.S. stock market and U.S. economy move in the same direction in the long term and major bear markets begin to unfold when the market senses impending economic weakness. Certain indicators are beneficial in foreshadowing the future economic trend. Our Macro Index Model (MIM) combines 11 diverse economic indicators to assess the likely future trend of the U.S. economy.
The chart below displays the S&P 500 Index along with our Macro Index Model. In the simplest terms possible, higher readings are considered favorable for the economy and the stock market and vice versa. The basic rules for using this model are simple: If MIM > 0.7, be bullish on stocks, and if MIM < 0.7, be bearish on stocks.
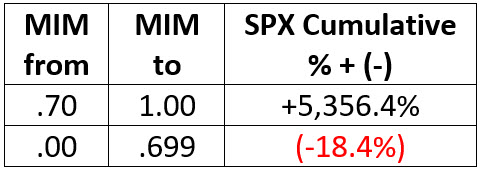
To summarize the results from 1968 into 2022, see the table below.
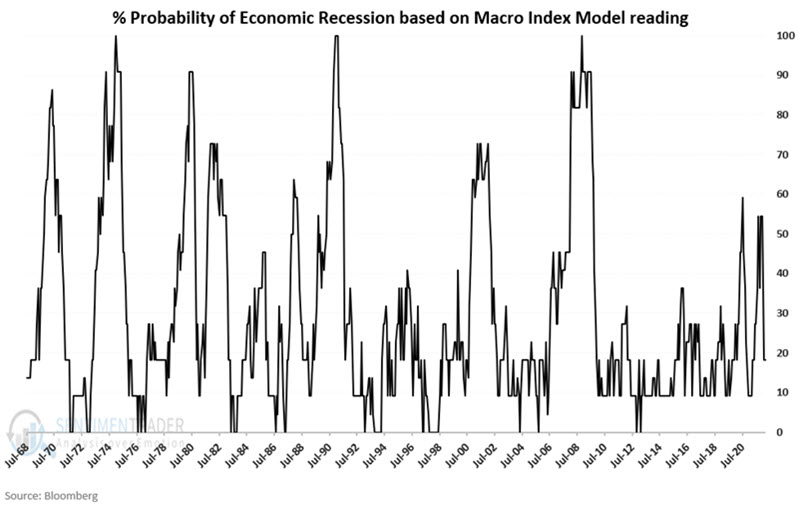
In essence, MIM assesses the likelihood of an economic recession in the near term. To illustrate, let's flip the index on its head. The chart below is derived by calculating (1.00 - the latest MIM reading) x 100. With the latest reading at 0.82, we get (1.00 - 0.82) x 100 = 18. In other words, the probability that we are presently in an economic recession is only 18%.
Euro area stocks have been hammered
Dean noted that the number of Eurozone ETFs outperforming the S&P 500 on a YTD basis contracted sharply and price trend indicators for Eurozone countries show a significant reversal from positive to negative.
The number of countries exceeding the S&P 500 stands at 27%. The significant deterioration should not be a surprise given the region's proximity to the Russia/Ukraine conflict and its dependence on certain commodities.
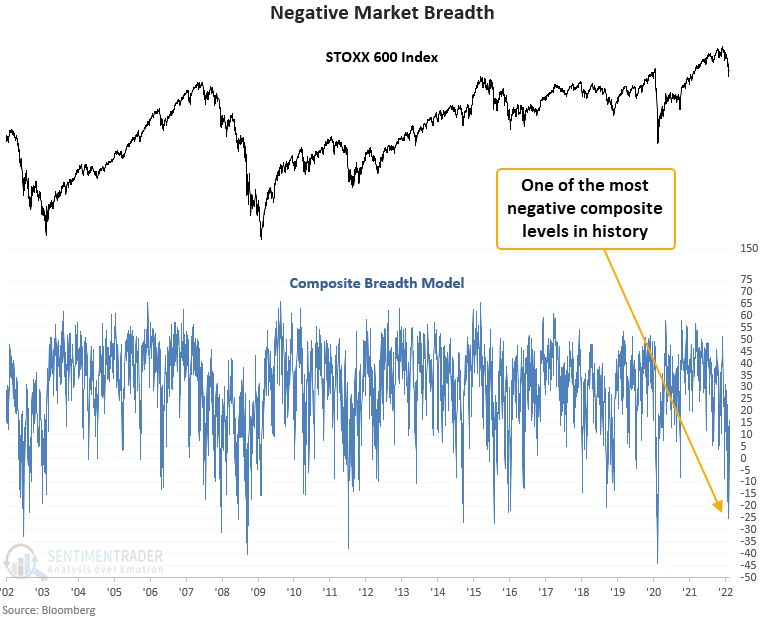
The internal condition of the STOXX Europe 600 Index registered one of the weakest readings in history last week when a composite breadth model plunged below -25%.
Let's conduct a study to assess the outlook for the STOXX Europe 600 Index when the composite breadth model crosses below -25%.
This signal triggered 8 other times over the past 20 years. After the others, the STOXX 600 Index shows weak returns and unfavorable win rates in the 2-6 month time frames. The 2-week window suggests there's a chance for a bounce. However, the study sample size is small.
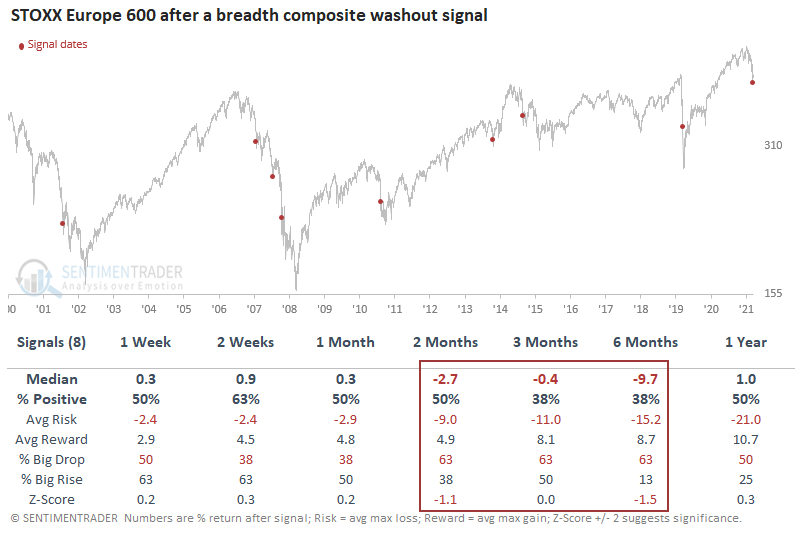
Internal and external price trends have turned decidedly negative for Eurozone stocks. While weak, they can get weaker. Similar setups to what we're seeing now have preceded negative returns for the STOXX Europe 600 Index on a medium-term basis. Remember, V bottoms are rare.
Chinese tech stocks suffer historic wipeout
Entering mid-week, there had been no worse corner of the markets (excepting Russia) than Chinese tech stocks.
In September, the sector was about as washed out as it had ever been. Over the next couple of months, the stocks did exactly what they should, which was precisely nothing. And then the floor fell out.
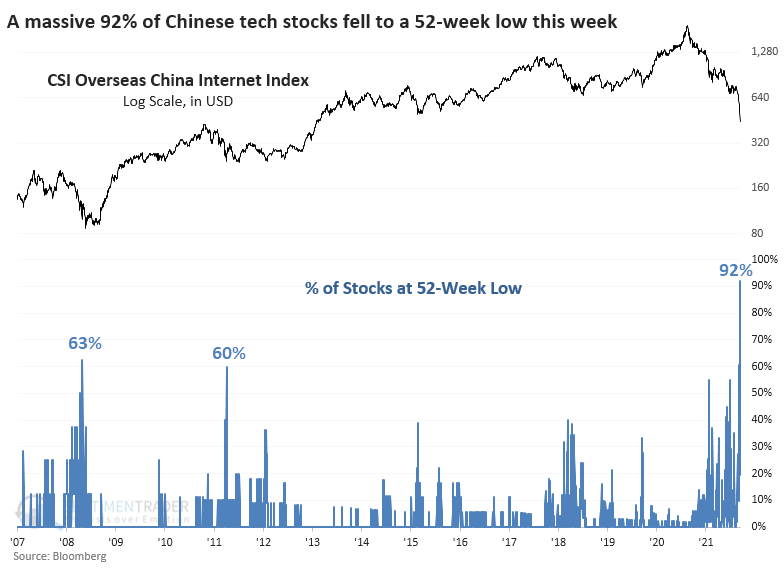
Over the past 17 sessions, there hadn't been a single member of the CSI China Overseas Internet Index trading above its 200-day moving average. The only other times it went this long were early December 2008 and early January 2012. The latest down leg has surpassed the financial crisis, with the average stock down a massive 74% from its 52-week high. The prior record drawdown was 67% on November 20, 2008.
As a result of the persistent and broad-based selling, a jaw-dropping 92% of members in the index fell to a 52-week low on the same day. The prior records were 63% on October 24, 2008, and 60% on October 3, 2011.
The Panic Breadth Composite was on par with other major lows in September. Now, it has spiked to a record high, with no close comparison.
Using trailing 12-month reported earnings, Chinese tech stocks are trading at their lowest median multiple in a decade. Even more objectively, and more notably, they've dropped to only 2.1 times sales, a record low. The 2008 and 2011-12 declines took the average multiple to around 3 times sales.
The concerns about Chinese stocks, and their technology sector, in particular, are well-known, but what everyone else knows isn't really worth knowing. There has been a drumbeat of headlines about China in the financial and mainstream press, and not a single one of them is positive. As an investor, it doesn't feel good.
This is reminiscent of energy stocks in September 2020, when there was compelling evidence that it was the most-hated sector of all time. Or we could point to gold mining stocks near the end of 2015 when a Chinese slowdown and drop in gold prices triggered historic selling pressure and suspended dividend payouts.
The risk is always that somebody knows something, and they're getting out. There is no guarantee that the stocks will recover like miners or energy companies did. The last setup failed miserably, but there is an excellent chance that today's rebound is the start of a bottoming process like it was in 2008 and 2011-12, and if so then we'll probably be in for a test of the low at some point.
Gold sees a major price reversal
Gold futures declined more than 5% at one point during the week, a large reversal from what had been a new yearly high. Dean assessed the outlook for gold futures when the 5-day rate of change declines by more than 5% as the commodity remains 5 days or less from a 252-day high.
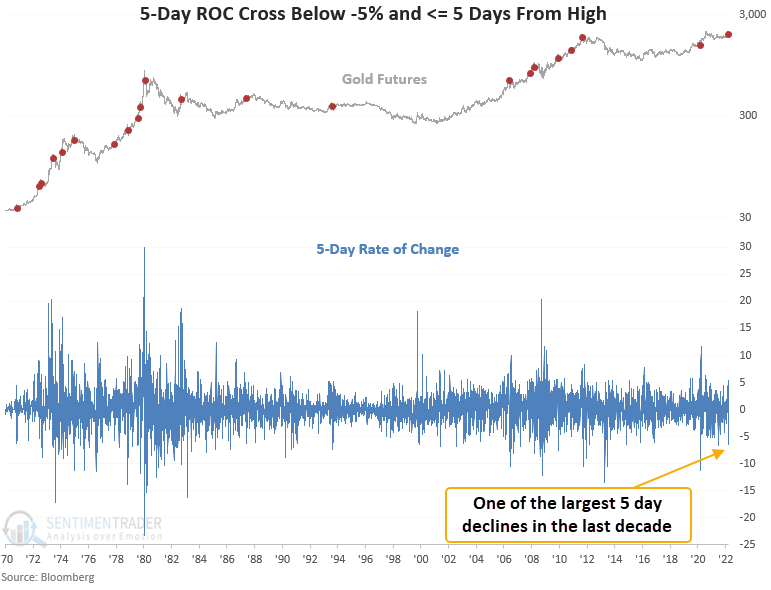
This signal triggered 21 other times over the past 52 years. After the others, gold futures show positive returns and favorable win rates across all time frames. While the win rates may not catch your eye, they look significantly better than the study period averages. The 1-year return looks compelling except for the 1975 and 1980 signals.
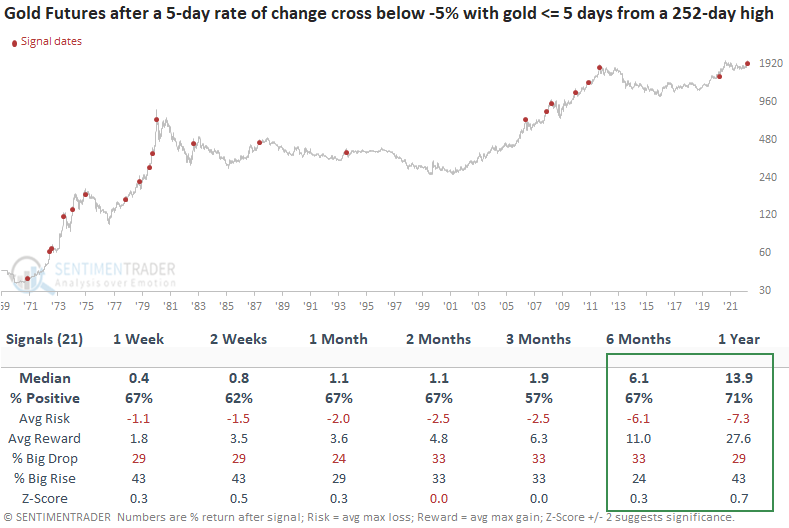
When price momentum for gold futures accelerates to the downside, the adverse price action can provide a potential near-term mean reversion edge regardless of the current market environment. Suppose the short-term panic occurs near a high. In that case, the results look solid across all time frames, especially the 1-year window. i.e., we should buy the dip in an uptrend-one thing to consider concerning gold and several other commodities. The Russia/Ukraine conflict put an additional bid in an already frothy backdrop. So, the spike and subsequent reversal may take longer to revert to the primary uptrend.
About the Weekly Wrap...
The goal of the Weekly Wrap is to summarize our recent research. Some of it includes premium content (underlined links), but we're highlighting the key focus of the research for all. Sometimes there is a lot to digest, with this summary meant to highlight the highest conviction ideas we discussed. Tags will show any symbols and time frames related to the research.