
TradingEdge for Feb 4 - Sentiment recovering from pessimism, better momentum, commodities cruising

Key points:
- Small options traders bought a record number (and value) of protective put options
- Sentiment surveys are showing their lowest relative optimism in 3 years
- Internal momentum is trying to turn around, as is investor fear
- Inflation remains a boogeyman, with a drag on returns
- Financial conditions are getting tighter but that hasn't been a consistent sell signal for stocks
- Commodities are hitting new highs relative to stocks, and copper is entering a positive seasonal window
Small options traders buy record amount of puts
Last week was enough to trigger panic among the most leveraged traders in the market.
Small options traders bought to open nearly 12 million put options last week, spending $6.5 billion for the privilege of protecting their portfolios. That's 40% higher than even the worst week during the March 2020 meltdown.
As a percentage of all opening option trades, small traders spent 29% of their volume on buying put options. The Backtest Engine shows just how rare this is.
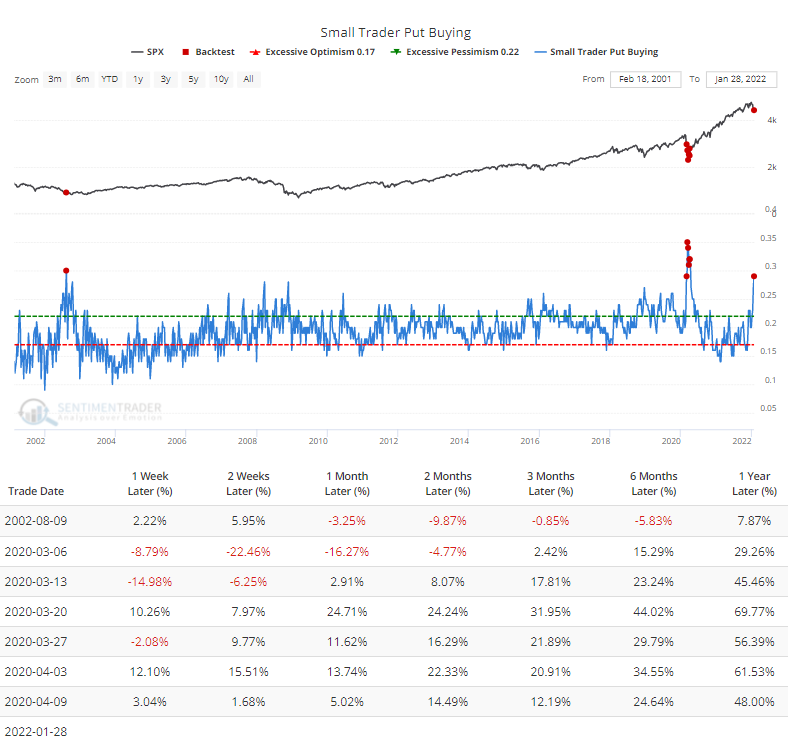
When we look at the amount of money small traders spent on put options relative to calls, it's now the highest since April 2020. Small traders spent $6.5 billion on buying put options, but they also spent $8.4 billion on call options.
Even so, it's been relatively rare to see them spend nearly 80% as much on puts as they did on calls. The Backtest Engine shows that such high levels of relative hedging activity preceded consistent gains over the past decade.
This was only the 3rd time traders spent so much on puts relative to calls when the S&P 500 was trading above its 50-week moving average. Only 2 weeks in June 2010 and November 2016 triggered so much hedging activity among retail options traders during a generally uptrending market.
A year ago, the mania in speculative options activity coincided with the peak of many of the most speculative stocks in the market. We're not quite seeing the exact opposite of that now, but it's getting pretty close. It doesn't suggest that the most speculative stocks are now a buy; rather, a better bet would be that quality stocks that got hit in recent weeks due to collateral damage are likely a safer bet, and more for buyers than sellers.
Sentiment surveys sour on stocks
The survey of individual investors from AAII last week showed that for one of the few times in the past decade, bears accounted for more than 50% of respondents. The Backtest Engine shows that when more than 50% of investors said they were bearish and the U.S. economy was not in a recession at the time, the S&P 500 rallied during the next month after 21 out of 22 signals.
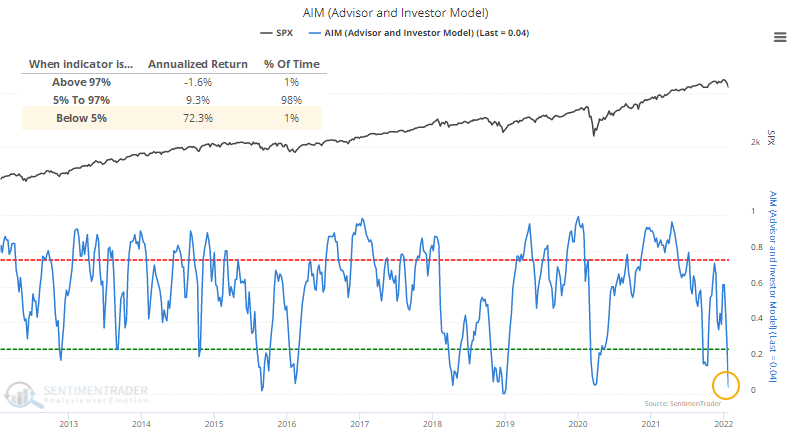
The AIM Model looks at a handful of popular sentiment surveys and calculates the relative amount of optimism in each one. As of the latest reading, there isn't much of it. The AAII survey isn't the only one showing a low degree of confidence among investors.
A reading below 5% in the model is rare, accounting for fewer than 1% of days since 1990. The S&P 500's annualized return following a reading that low was +72.3%, compared to -1.6% when the model was in the top 1% of readings.
This was the first reading of true pessimism in at least 3 months. The table below shows that the S&P tended to perform well after these first bursts of pessimism. Over the next 3 months, it rose over 11 out of 12 signals, though that loser was dismal.
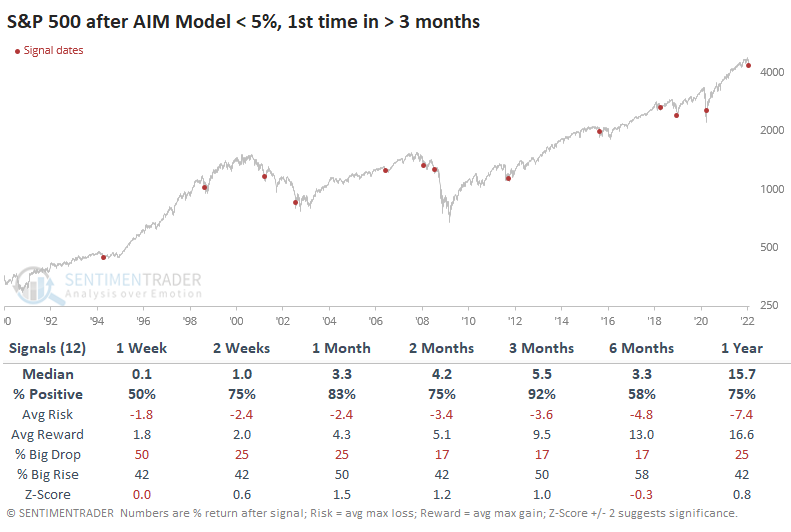
The Risk/Reward Table showed that the only signal that led to a maximum loss of more than -10% at any point within the next 3 months was that one in 2008. Losses after the others were mostly minimal, while double-digit gains were more common than not.
Internal momentum is trying to reverse, as is investor fear
Jay touched on a couple of other positive developments.
The McClellan Summation Index is a longer-term look at the momentum of the underlying breadth of the market. Momentum is positive when it is above zero; below zero, it is negative. It's deeply negative on the Nasdaq but trying to turn around.
With many overbought/oversold, the catch is that one never really knows how low is low until after the fact. An alternate approach is waiting for signs of a reversal of an oversold condition before jumping in. The red dots in the chart below highlight those days when the NASDAQ McClellan Summation index crossed back above a reading of -1200.
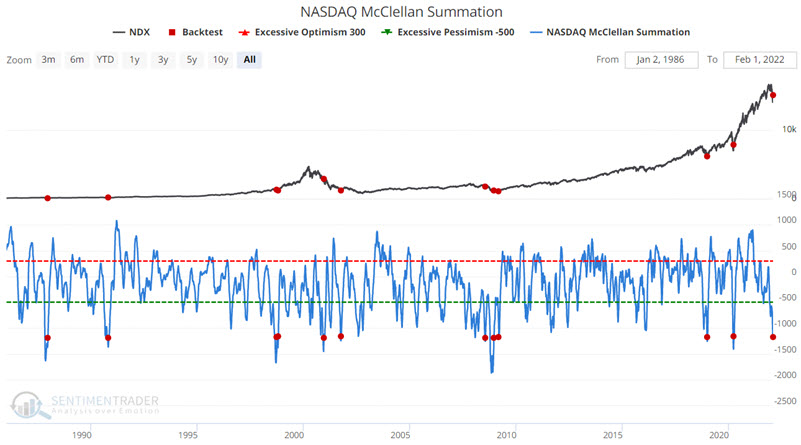
Of particular interest is the performance 1-month after each signal, with an 82% Win Rate and a Median Return of +8.59%.
The Fear and Greed Model is showing fear that's starting to subside. We will use the Fear and Greed Model in the same way we did with the NASDAQ McClellan Summation index - by waiting for a reversal from an oversold condition.
The red dots in the chart below highlight those days when the Fear and Greed Model crossed back above 20 while the S&P 500 Index was above its 200-day moving average.
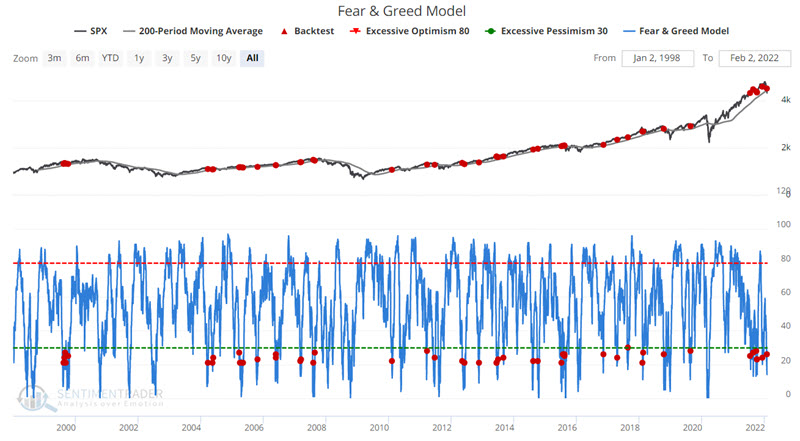
Of particular interest is the performance 3-months after each signal - with an 81% Win Rate and a Median Return of +4,54%.
More signs of recovering sentiment
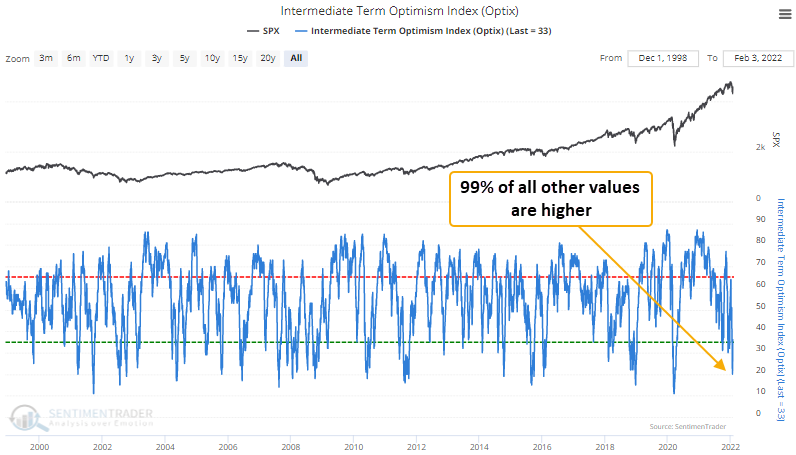
Our Intermediate-Term Optimism Index (Optix) declined to a pessimistic sentiment extreme and then optimism quickly rebounded this week.
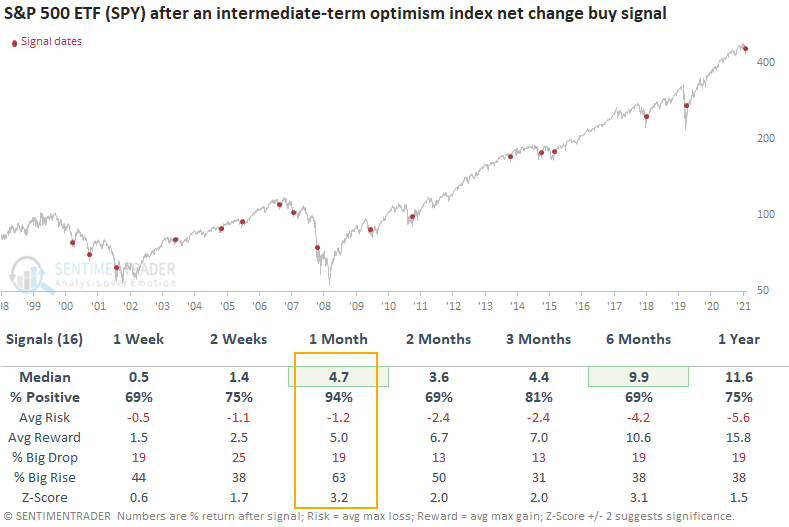
Dean showed an Intermediate-Term Optimism Index (Optix) signal, which identifies when the 4-day net change in the Optix Index surges by 10% or more after the index resets below a pessimistic sentiment level of 22%.
This signal triggered 16 other times over the past 21 years. After the others, S&P 500 future returns and win rates were solid across all time frames, especially the 1-month window. The two significant failures occurred during the 2007-08 bear market.
Inflation is still an issue
Jay has been highlighting the headwind of inflation for months. This week, he measured inflation, interest rates, and the difference between the two.
The chart below subtracts the current yield on 10-year treasuries from the 12-month % change in CPI since 1914. The dark blue horizontal line is drawn at the 0.60 level.
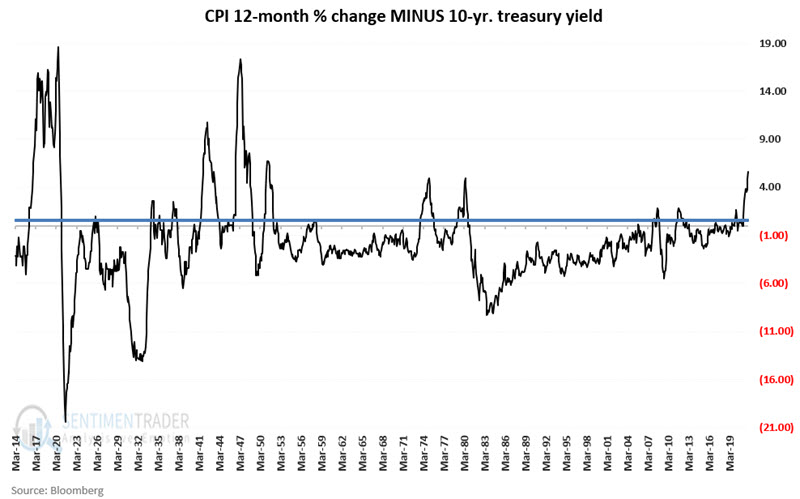
The chart below shows the growth of $1 invested in the Dow Jones Industrial Average ONLY during those months when the previous month's value was greater than 0.6, when inflation was 0.6 points or higher than 10-year treasury yields.
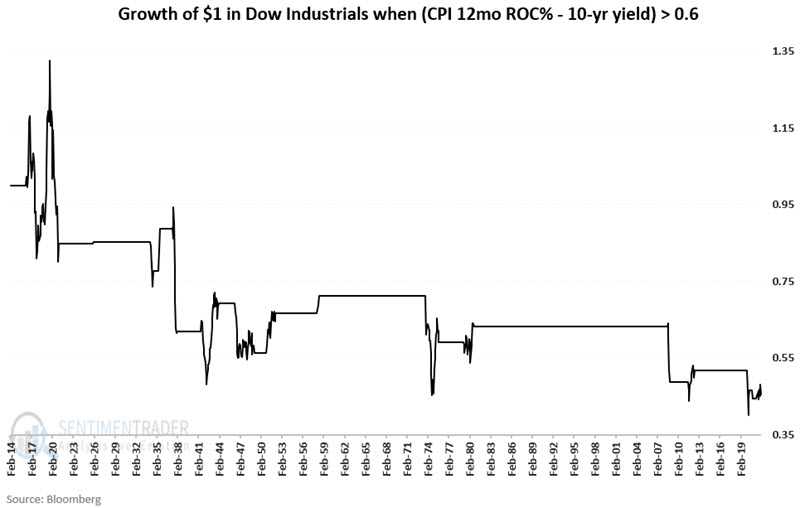
The net result since 1914 has been a cumulative loss of -55%. That's the situation we have now.
Financial conditions are getting tighter
With interest rates jumping, credit spreads widening, and stock valuations getting more attention, financial conditions have tightened, weighing on sentiment.
The Goldman Sachs U.S. Financial Conditions Index 50-day moving average has just crossed above its 200-day moving average, suggesting a potential long-term change in financial conditions. This ended a near-record stretch of extremely easy financial conditions. It had been nearly 400 days since the shorter-term average was above the long-term one, the 3rd-longest streak in 40 years.
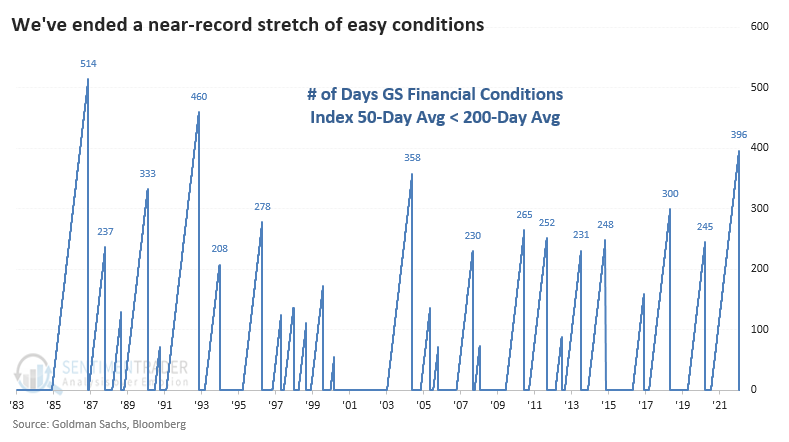
The ends of similar periods of easy conditions preceded the 1987 stock market crash and the 2008 financial crisis. That gives some fuel to bears who believe that tighter conditions are a prerequisite to a market crash.
But those were also two of the only exceptions to what was mostly a non-event for stocks.
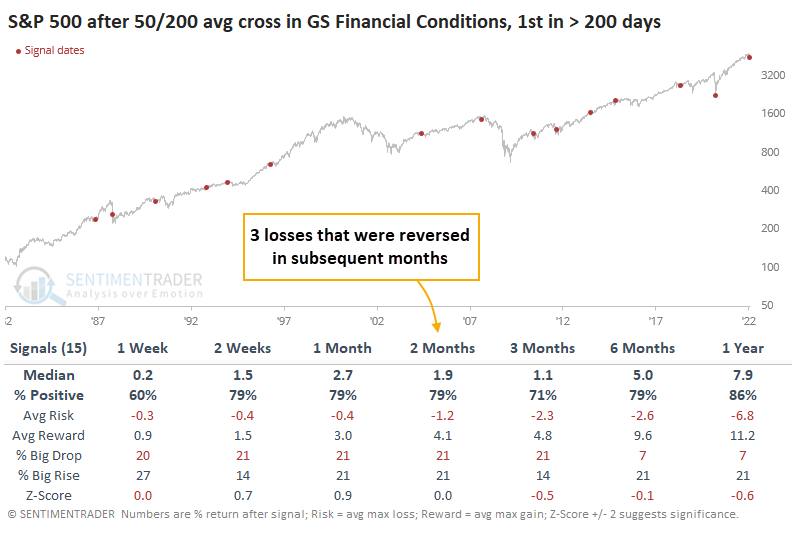
Other markets saw quite different prospects going forward. 10-year Treasury futures mostly rose over the next 1-3 months. This uses bond prices, which means that yields mostly declined (this is within a long-term downtrend for yields, so no big surprise there).
The Bloomberg Commodity Index struggled over the next month, then performed fine. The worst longer-term returns were in the U.S. dollar, which showed a positive return only 29% of the time over the next 6 months.
Among sectors, there was an interesting mix in performance. Some of the more defensive sectors did well, but so did Technology. The worst sector was Financials, the only sector or factor with a negative median return during the next 3 months.
Commodities continue their relative surge
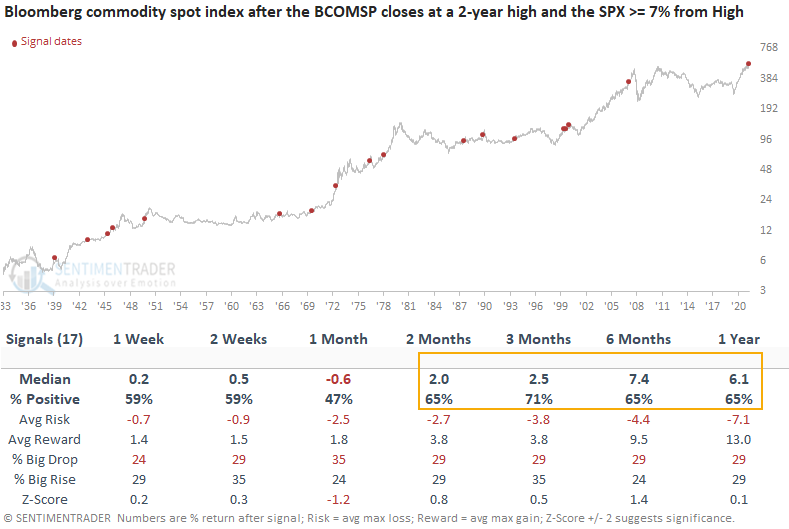
The Bloomberg commodity spot index closed at a new 2-year high last week while the S&P 500 closed more than 7% below its 2-year high.
Dean assessed the outlook for stocks and commodities when the Bloomberg commodity spot index (BCOMSP) closes at a 2-year high. At the same time, the S&P 500 index is down 7% or more from its 2-year high.
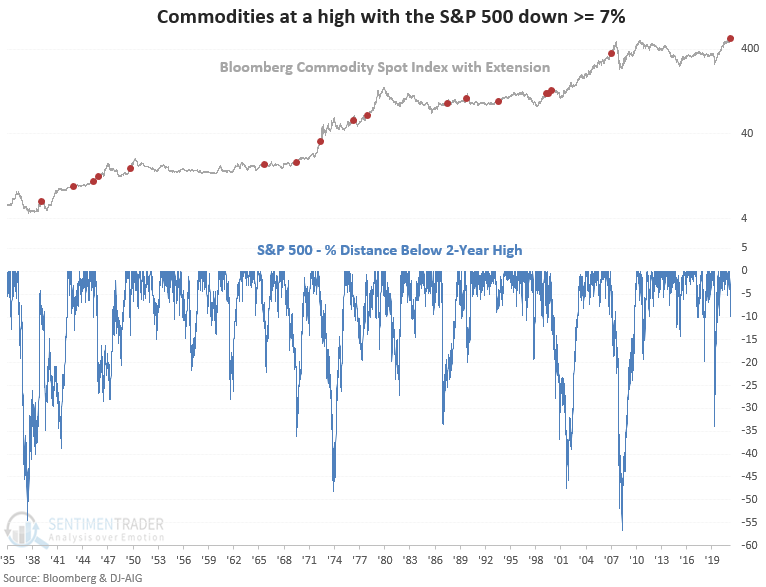
Commodities show better returns and win rates when compared to the S&P 500. Interestingly, the 1-month time frame was negative for both assets with an almost identical return. Returns and win rates look better on a medium to long-term basis.
Copper enters a seasonally favorable window
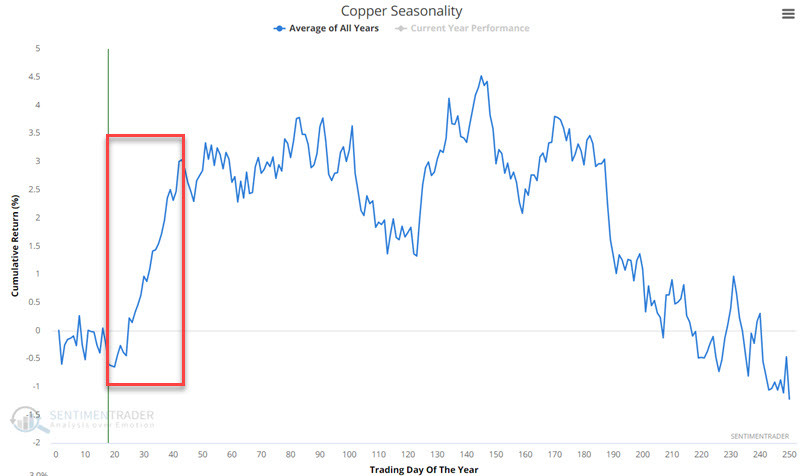
Copper has been coiling and could break either way. However, Jay showed a seasonal tendency that argues for a move to the upside.
The chart below displays the annual seasonal trend for copper. In the red box, you can see it tends to show strength between late January and early March.
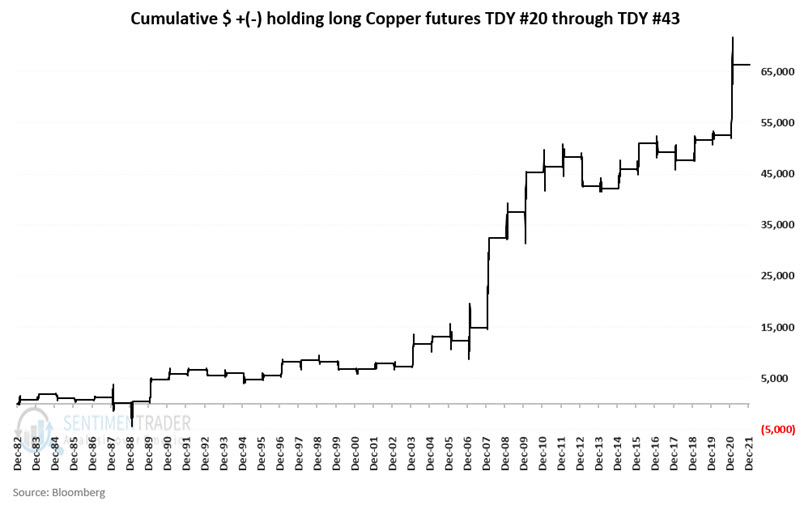
The chart below displays the hypothetical cumulative $ +(-) achieved by holding long a copper futures contract only during this seasonally favorable period. In the chart above and below, we see a "tendency" for strength - but by no means a "certainty" on a year-by-year basis.
About the Weekly Wrap...
The goal of the Weekly Wrap is to summarize our recent research. Some of it includes premium content (underlined links), but we're highlighting the key focus of the research for all. Sometimes there is a lot to digest, with this summary meant to highlight the highest conviction ideas we discussed. Tags will show any symbols and time frames related to the research.