
TradingEdge for Feb 11 - Heavy hedging as stock try to recover, yields show historic jump

Key points:
- Hedging across a variety of metrics shows the most activity in nearly 2 years
- Partly in response, more Technology stocks are trying to recover their long-term trends
- Yields continue to rise, however, with the 2-year Treasury yield on a 7-week streak
- Corporate bond investors are showing significantly more fear than equity investors
- That's because spreads are rising, which has been a drag on equity returns
- Investors have been moving into Defensive and Value factors to a historic degree
Hedging activity nears 22-year high
A week ago, we saw that small options traders had a change of heart, buying a record number of puts. It's not just small traders who are heading, however. Among the largest traders, put buying was popular again last week. For 2 weeks in a row, they've spent 30% of their volume on puts, the highest percentage since the pandemic.
There are other ways to hedge. Traders can buy an inverse mutual fund or ETF that profits when stocks decline. Traders can also hedge by buying credit default swaps. As interest rates rise, one of the best - and increasingly popular - ways to hedge is to sell stocks and simply hold the proceeds in cash.
All of those metrics saw an increased in hedging activity. It was enough to push the Equity Hedging Index above 80% last week for the first time since early April 2020. According to the Backtest Engine, this is only the 33rd week in 22 years that it's been above that threshold.
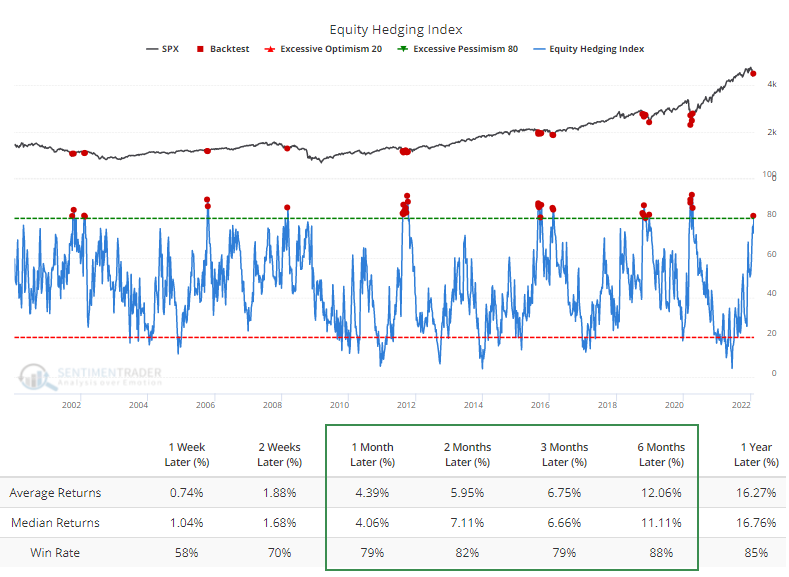
Almost every market environment metric we watch is in negative territory, and investors are in risk-off mode. That is not a great combo. The only potential saving grace is that pessimism reached a high level, and as we saw above, they're hedging aggressively. Even in unhealthy market environments, that's usually enough to generate a multi-week to multi-month rebound.
Technology stocks are trying to recover
While stocks have been volatile, there has been a recovery in long-term trends, specifically among Technology stocks. After fewer than 25% of Technology sector stocks were trading above their 200-day moving averages, enough recovered so that most of them were above their averages.
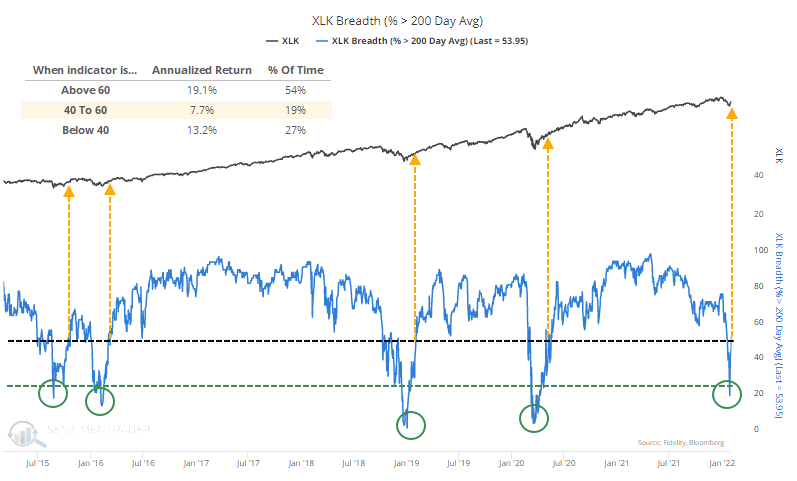
It's generally better for Tech stocks if we see a thrust with more than 60% of them trading above their 200-day averages. So far, it's been hovering below 60%, which is what an unhealthy market does.
Still, let's take a look to see how the sector performed when there was a quick cycle from fewer than 25% of members above their long-term averages to more than 50%. The table below shows every signal over the past 70 years. Returns in the table use the total return (including price gains and dividends).
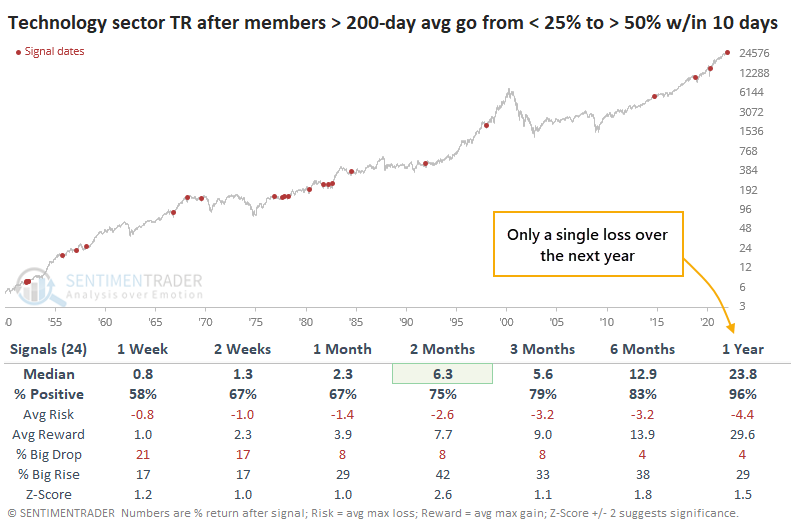
The fact that we just cycled up from an oversold extreme helped forward returns significantly. The Tech sector's median return over the next 2 months was more than 2 standard deviations above random, and its consistency improved with each time frame. Over the next year, the sector saw a positive return after 23 out of 24 signals, though the exception was an extreme one.
Tech is trying to recover even though yields are rising
Dean looked at the message in the persistent rise in 2-year Treasury note yields.
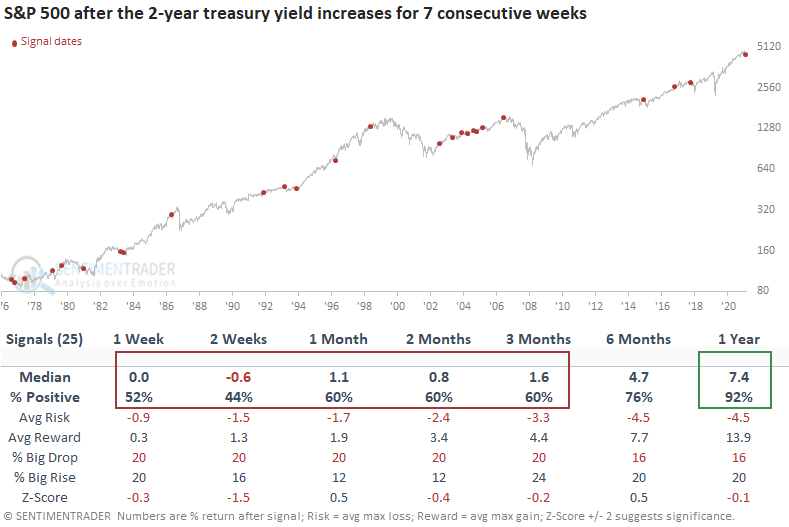
The 2-year Treasury note yield has increased for 7 consecutive weeks, the longest streak in several years. While it's tempting to think such a long streak much necessarily reverse, since 1977, only 5 out of 25 signals coincided with a significant peak in the 2-year yield.
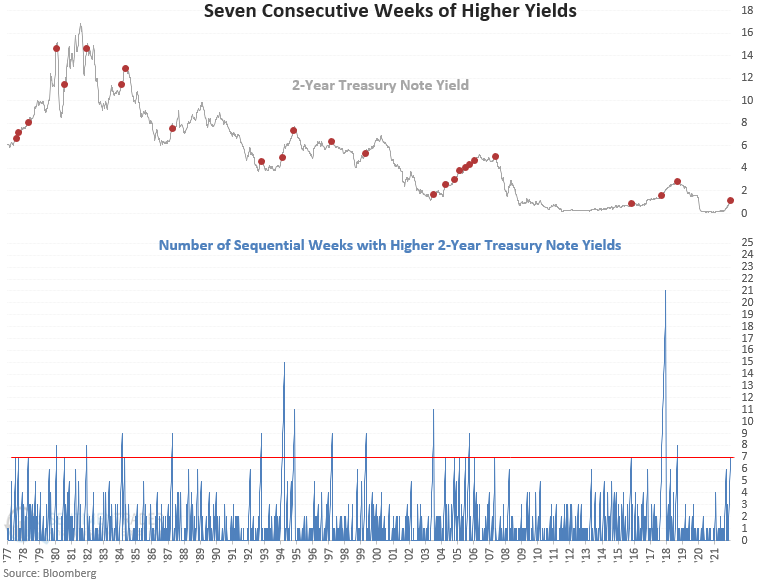
S&P 500 performance and win rates after these 7-week streaks of rising yields show somewhat tepid results on short to medium-term time frames. However, the 1-year win rate suggests that similar increases in bond yields do not necessarily kill a bull market.
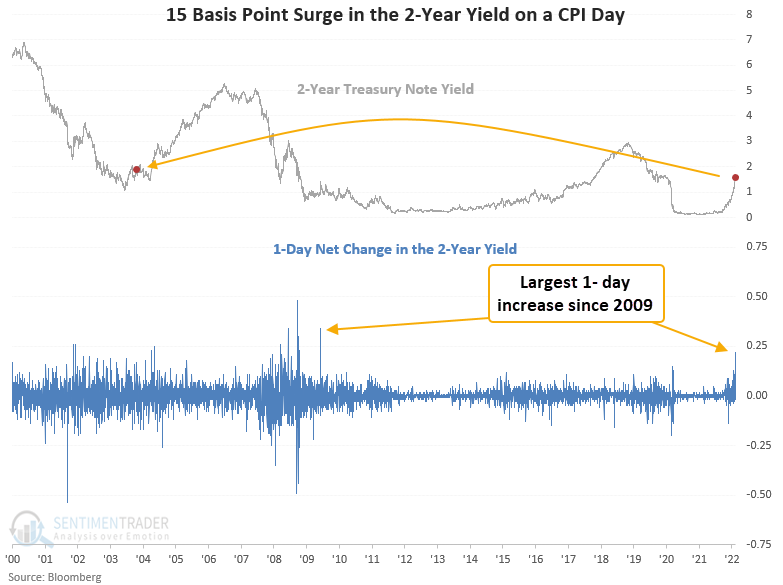
Yield increase the most in a decade in reaction to CPI data
Part of the reason 2-year yields continued to rise this week was in response to the latest CPI release. Dean showed that the 22 basis point increase in the 2-year yield represents the most significant 1-day net change since October 2003 on a day the CPI was released.
This signal has triggered 14 other times over the past 41 years. After the others, the S&P 500 shows slightly weak returns and unfavorable win rates across most short and medium-term time frames. However, the 1-year win rate and return suggest that similar increases in the 2-year yield do not foreshadow the end of the equity bull market.
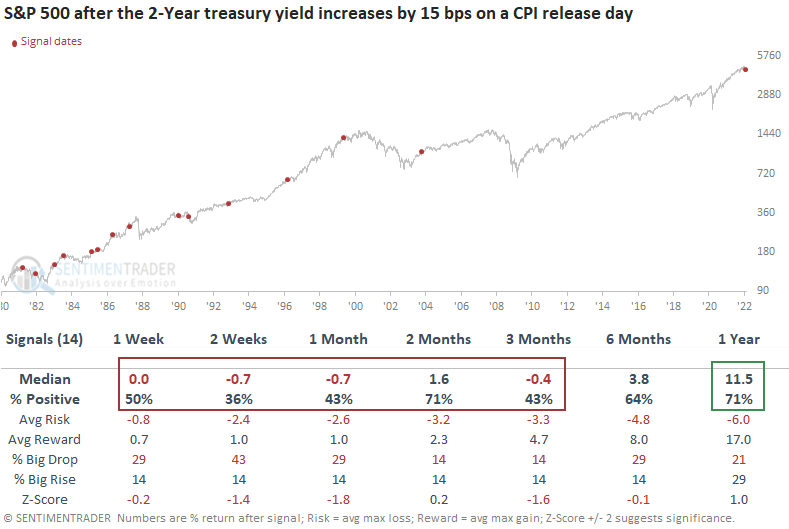
While stocks tended to struggle, 2-year and 10-year Treasury yields mostly rose in the weeks ahead, and the yield curve consistently got flatter.
Credit investors are a lot more nervous than equity investors
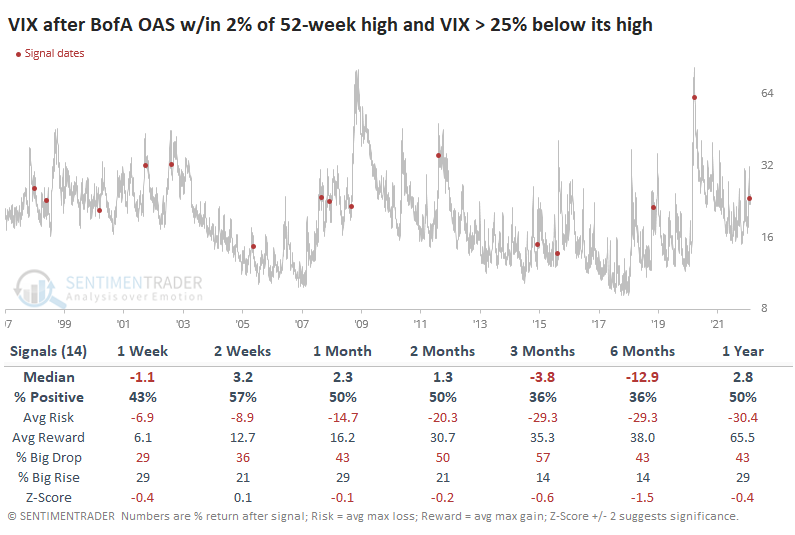
Bond traders will cringe at this, but if we use option-adjusted spreads as a sign of bond market "fear", they're just off their 52-week highs. But equity market "fear" via the VIX is down by more than 25%.
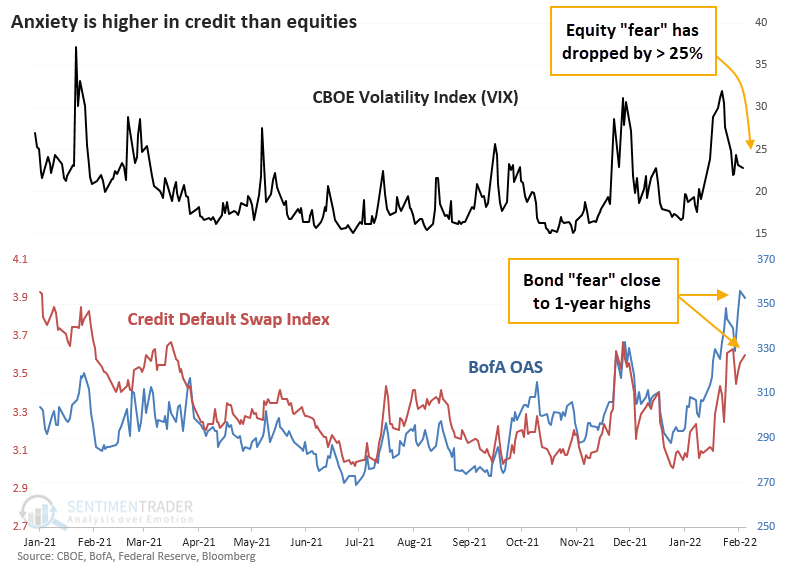
It's relatively rare to see these equity and bond metrics diverge for long. A market clichè is that the bond market is smarter. We've looked at that from dozens of different directions over the decades, and there is no clear edge one way or the other. Sometimes, bond traders panic just as foolishly (in hindsight) as stock traders.
To see if there's anything to this current situation of elevated bond market fear while stock investors see easing concerns, the table below shows all similar days since 1997.
For the VIX, it was not a consistent enough signal suggesting it would spike. Over the next 3-6 months, the VIX rose after only 5 of the 14 signals.
Still, rising credit spreads are a headwind for stocks
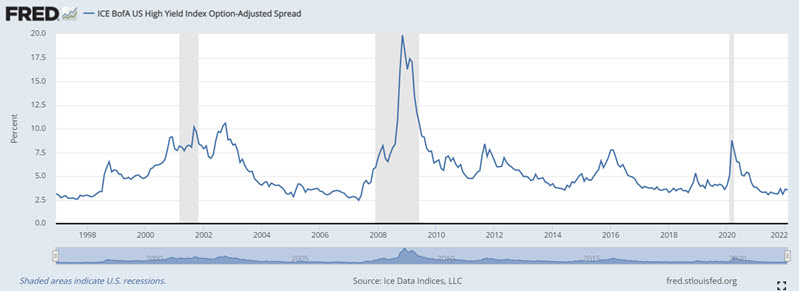
The ICE BofA US High Yield Index tracks the performance of the US dollar-denominated below investment grade rated corporate debt publicly issued in the US domestic market.
Jay noted that this spread tends to fluctuate very narrowly in periods of normal economic activity. However, during periods of economic stress or unusual financial market conditions, this spread can grow rapidly. Because the stock market hates uncertainty, rapid growth in this spread is often a warning sign for stock market investors.
To quantify the impact on rising spreads, Jay calculated a 13-week and 28-week exponential average and took the difference between the two. A positive reading means the spread is widening. Additionally, Jay looked to see if the trend in spreads rose or fell over the last two weeks, which is what we can see below.
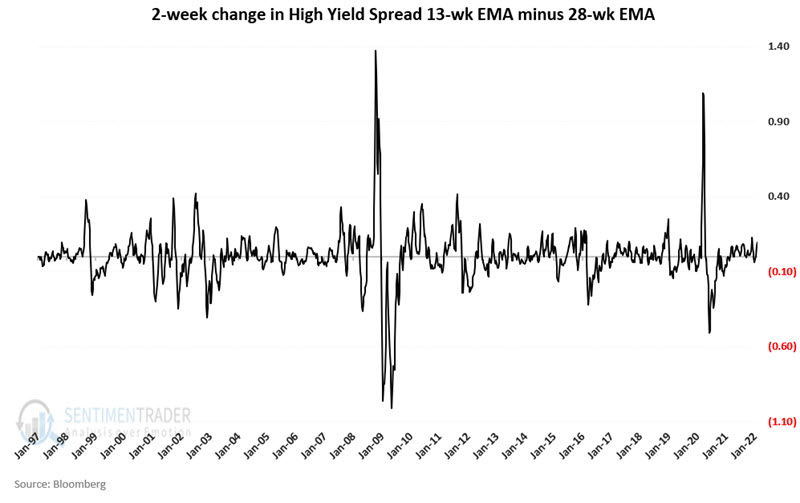
This method issues a warning sign for stocks when both the spread and its rate of change are above zero. This tells us that a) the credit spread itself is widening, and b) the velocity of the increase is increasing.
The chart below displays the hypothetical growth of $1 invested in the S&P 500 Index ONLY when both are positive. The stock market can rise under these circumstances, but there is clearly a tendency for trouble.
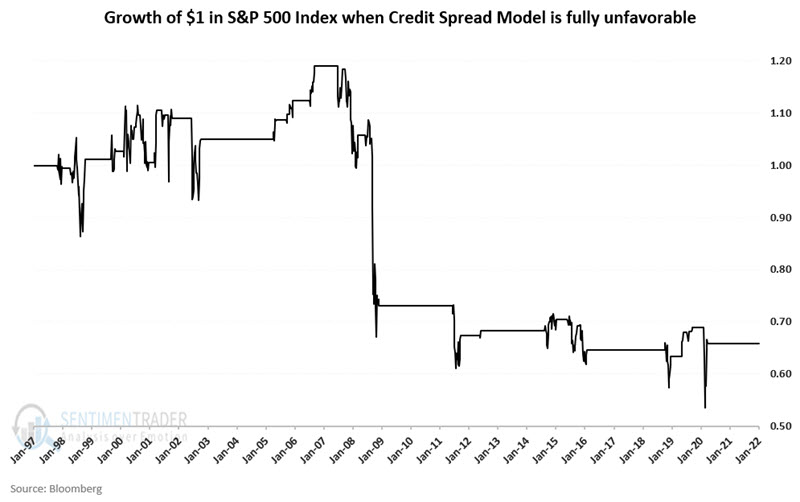
Widening credit spreads can be a helpful warning sign of impending economic trouble. But not every uptick is a signal of impending doom. The key is to identify those times when the spread is widening AND doing so at an accelerating rate. As of the week ending 2/4/2022, the 13-week exponential average for the High Yield credit spread detailed above crossed above its 28-week exponential average. In addition, the two-week change in the 13-week EMA minus 28-week EMA is rising. As a result, the credit spread model detailed above is presently considered "fully unfavorable."
Maybe that's why investors have been favoring Defensive and Value factors
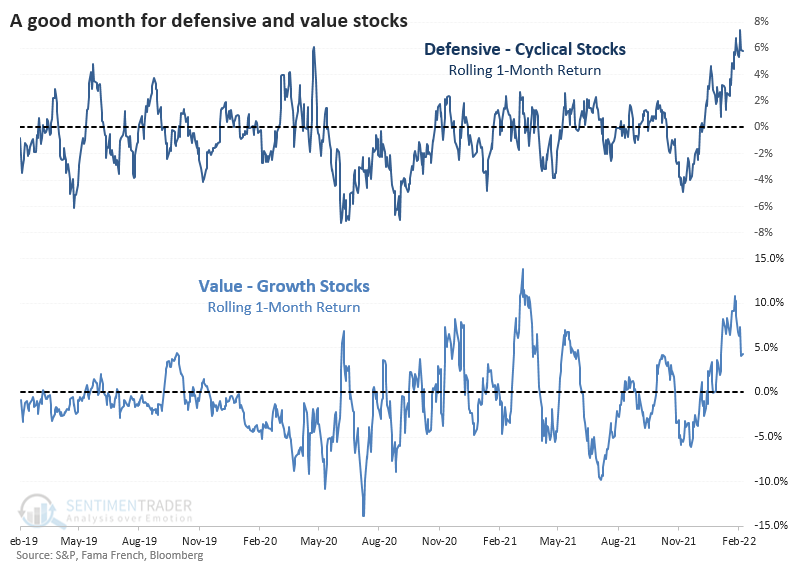
Over the past month, we've seen a massive shift. Investor sentiment turned sour on Cyclical and Growth stocks, greatly favoring Defensive and Value factors.
Using a rolling 21-day lookback, Defensive stocks outperformed Cyclical by more than 7%. So did Value stocks over Growth. Both ratios eased a bit in recent days, but their outperformance is still notable and is among the most extreme moves in years.
Going back to 1928, this 7% relative outperformance in both Defensive and Value stocks is remarkable. The chart below shows the minimum rolling 1-month return between Defensive - Cyclical stocks and Value - Growth stocks. If it's positive, then it means that investors favored both Defensive and Value stocks.
There have only been a few other times since 1928 when investors so heavily favored Defensive and Value stocks over Cyclical and Growth.
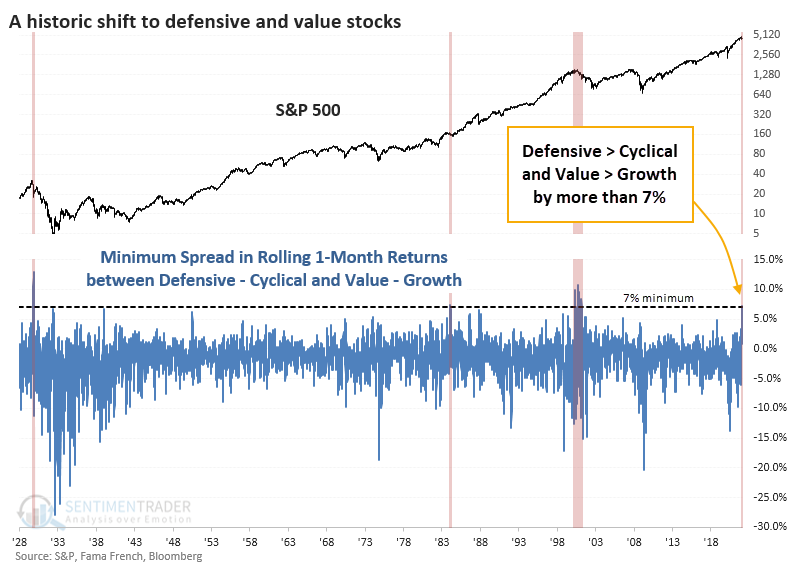
It would be easy to highlight 1929 and 2000 and suggest this is a sign of the apocalypse. It's harder to reconcile 1984, which preceded a few months of choppiness, then a fantastic bull run.
If we relax the threshold to 5% outperformance, then we get quite a few more precedents, though the last signal was still 16 years ago. Looking at forward returns after those signals, returns in the S&P 500 improved and were quite good over all time frames. Since 1950, almost all the signals showed a positive return over the next 1-3 months, and most of them extended those gains in the months ahead.
Returns in the factors themselves were mixed. After the few periods of 7% outperformance, Defensive stocks continued to outperform Cyclicals and Value stocks outperformed Growth. But again, a sample size of 3. Unfortunately, the implications weren't consistent when we reduced the threshold to 5% outperformance. After those signals, there was much less consistency.
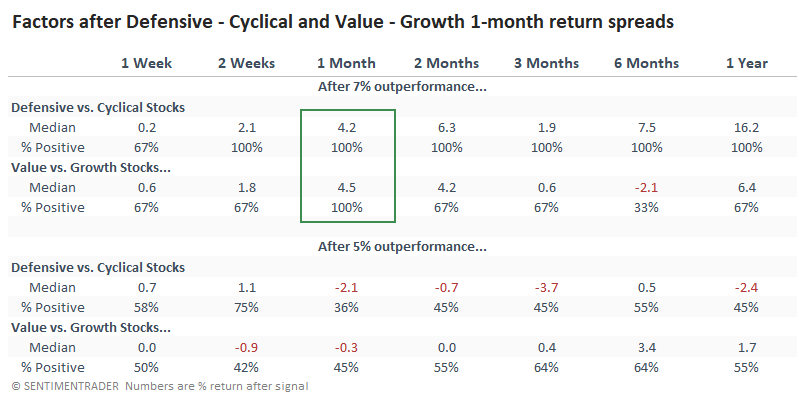
This is one of those tough periods when we have to judge how much weight to give the outstanding outperformance of Defensive and Value stocks. The few precedents are clear that stocks, in general, tended to suffer, with Defensive and Value stocks adding to their gains versus higher-risk factors. But a modest reduction in the extreme greatly changed the outcomes, which makes it much harder to rely on the signal as an input.
An option trade example in Chinese tech
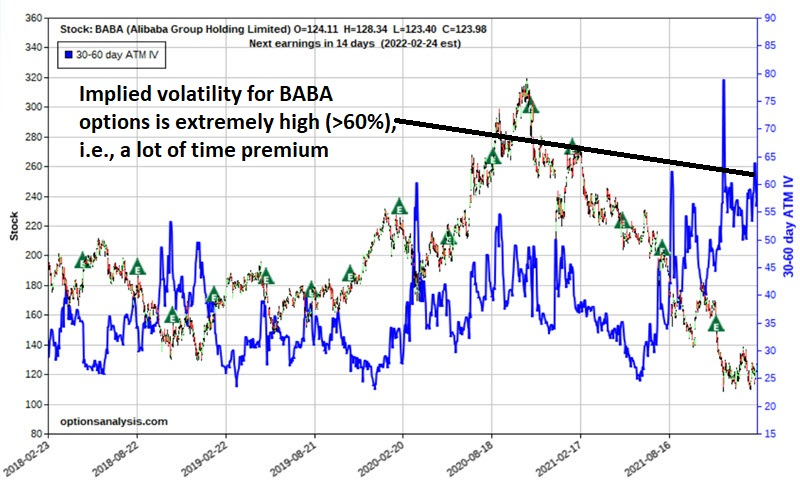
Alibaba Group Holding Limited (BABA) has (at least for the moment) established a support level just south of $109 a share as Chinese tech shares try to stabilize.
Implied volatility on BABA options is close to the high end of its historical range, meaning there is a lot of time premium built into the price of its options. Jay noted that this type of confluence may be a good setup for a bull put credit spread for options traders who understand the risks and potential rewards.
The chart below displays the last 1000 days of trading for BABA along with the implied volatility % (blue line) for 30-60 options. The key thing to note is that IV is at the high end of the historical range.
The objective for our example trade is to take advantage of high option volatility by selling March premium, with the belief that the December 2022 low of $108.70 will hold for the next 36 days. The risk curves - which display the expected $ profit or loss as of a given price for BABA on four different dates leading up to March expiration - appear in the chart below.
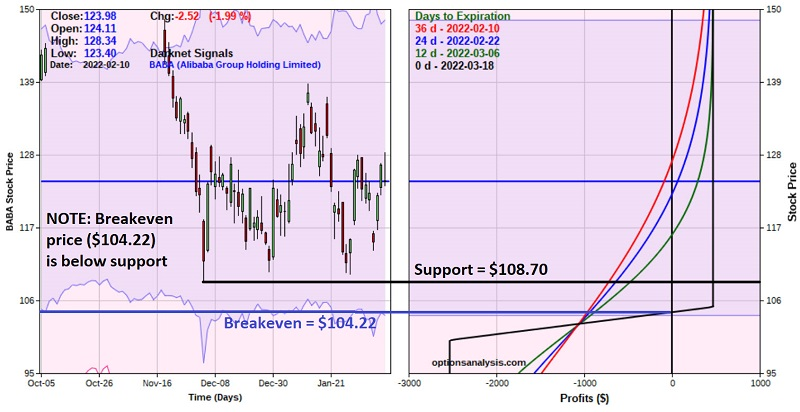
The trader would be required to have $2,532 in their account to enter the trade. Maximum profit potential is $468 ($2,65 - $1.87 x 600 shares). This would represent a profit of 18.5% on risked capital in 36 calendar days if achieved.
The maximum risk on this trade is -$2,532 and would be realized if the trade is held until expiration and BABA was below $100 a share at expiration. Barring a significant price gap, a trader should have plenty of opportunities to act well in advance to mitigate the risk of losing the full $2,532.
About the Weekly Wrap...
The goal of the Weekly Wrap is to summarize our recent research. Some of it includes premium content (underlined links), but we're highlighting the key focus of the research for all. Sometimes there is a lot to digest, with this summary meant to highlight the highest conviction ideas we discussed. Tags will show any symbols and time frames related to the research.