
Weekly RSI completes a bullish breadth reversal

Key points
- The S&P 500 Weekly RSI recently crossed above 60%
- When this indicator crosses above 60% after previously dropping below 43%, it tends to be followed by favorable price action
- The preferred holding period following a < 43% to >= 60% cycle is nine months
S&P 500 RSI completes a noteworthy cycle
We will focus on the standard Welles Wilder Relative Strength Index (RSI) indicator using the typical default of 14 periods. We will apply this to the S&P 500 Index using weekly data. A favorable signal is considered to have occurred when the 14-week RSI:
- Crosses below 43.0
- THEN crosses back above 59.99
Note that this process can take several weeks to several years to play out. The chart below displays the most recent signals generated using this method since 2019. The green arrows in the chart highlight the completion of a "drop below 43, then hit 60 or higher" cycle.
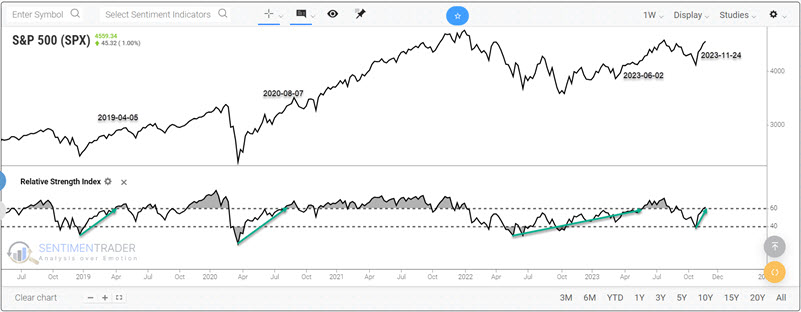
There are four signals displayed in the chart above. The most recent signals occurred on 2023-06-02 and again on 2023-11-24.
Let's take a closer look at S&P 500 performance using a trading approach and a nine-month time frame.
Applying a trading approach to RSI Cycle signals
For the test below, we will assume the following rules:
- After the 14-week RSI cycles from below 43 to 60 or higher, buy the S&P 500 Index and hold for 189 trading days (i.e., roughly nine months)
- If a new cycle is completed BEFORE an existing 189-day holding period expires, reset the counter to 189 trading days and continue to hold the S&P 500 Index
In other words, if no new signal occurs within 189 trading days of the previous signal, then the holding period is 189 trading days. If there is an overlapping signal, we extend the holding period for another 189 trading days.
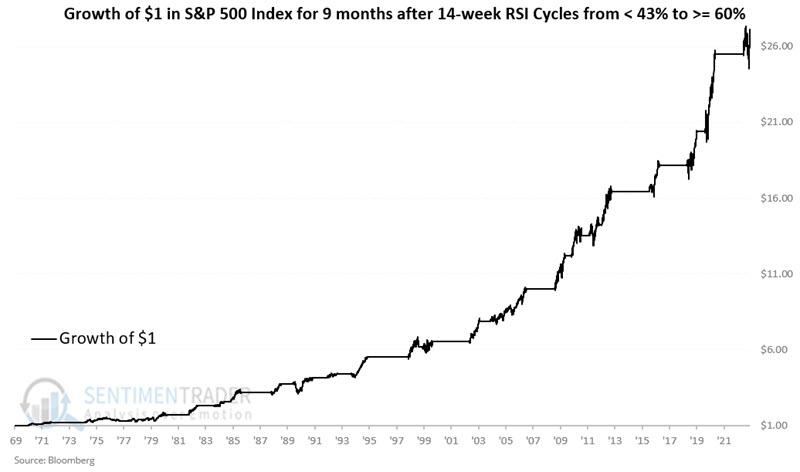
The chart below displays the hypothetical growth of $1 invested in the S&P 500 Index using the abovementioned rules.
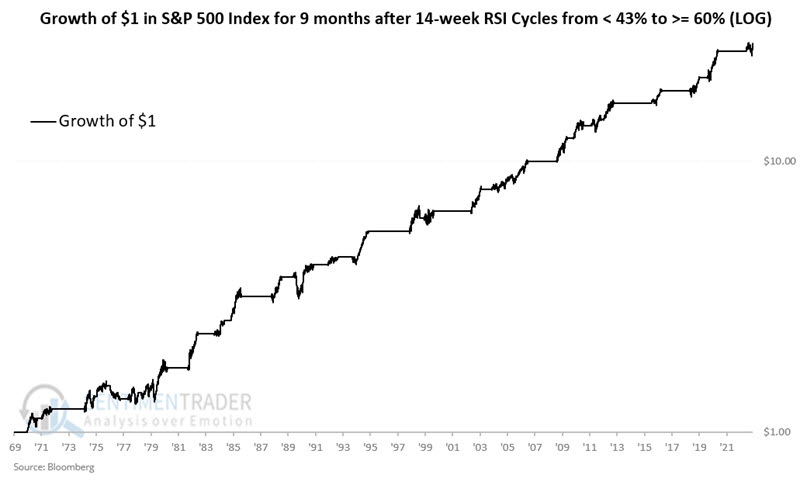
The chart below displays the same information as the chart above on a logarithmic scale.
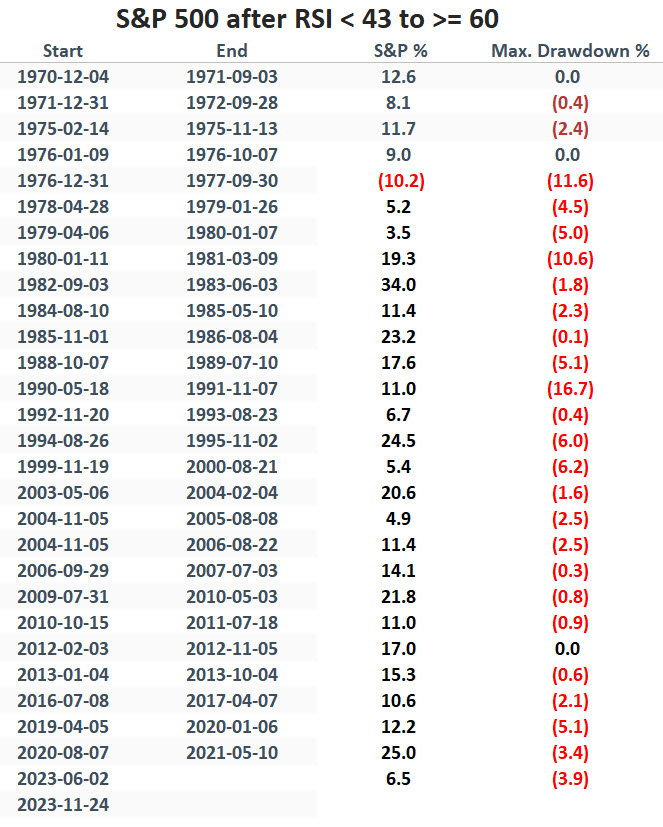
The table below displays the hypothetical results, including the net S&P 500 % +(-) during the holding period (nine months or longer if a new signal occurs within nine months of a previous signal) and the worst % drawdown from the entry price.
The table below summarizes S&P 500 performance across all trades.
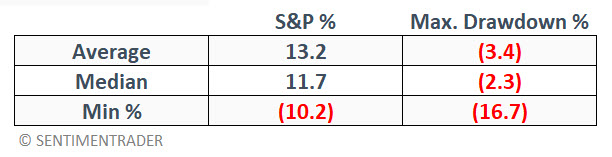
Note that:
- 26 of the 27 completed holding periods (96%) showed a gain
- 17 of the 27 completed holding periods witnessed a maximum drawdown of less than -2.5%
- 20 of the 27 completed holding periods saw a maximum drawdown of less than -5.0%
- 3 of the 27 completed holding periods saw a maximum drawdown of greater than -10%
The most recent holding period began at the close of 2023-06-02, with the S&P 500 at 4,282.37. The subsequent overlapping signal on 2023-11-24 means the holding period will be extended until 2024-08-24.
What the research tells us…
Momentum is one of the most critical factors that affect the stock market. Once investors en masse move from a risk-off mentality to a risk-on mentality, a burgeoning advance can continue to build on itself as once fearful investors move aggressively to avoid missing out. The RSI cycle detailed above is an example of this type of activity. It takes a serious - and typically painful - market decline to push the S&P 500 weekly RSI below 43%. Usually, at that point, investor sentiment is highly unfavorable. But eventually, the decline ends, and things turn around. A subsequent cross of 60% for the S&P 500 weekly RSI has generally signaled an impending continuation of a market advance.