
Weekly reversals tend to lead to FOMO

Key points:
- The S&P 500, Nasdaq Composite, and Russell 2000 reversed significant weekly losses from the prior week
- These reversals occurred while the indices were trading near 52-week highs
- Similar behavior, especially when it triggers across indices, has consistently preceded further gains
Triggering the Fear Of Missing Out
It would be unfair to blame investors for suffering whiplash after the last couple of weeks. That whiplash has a good chance of morphing into FOMO.
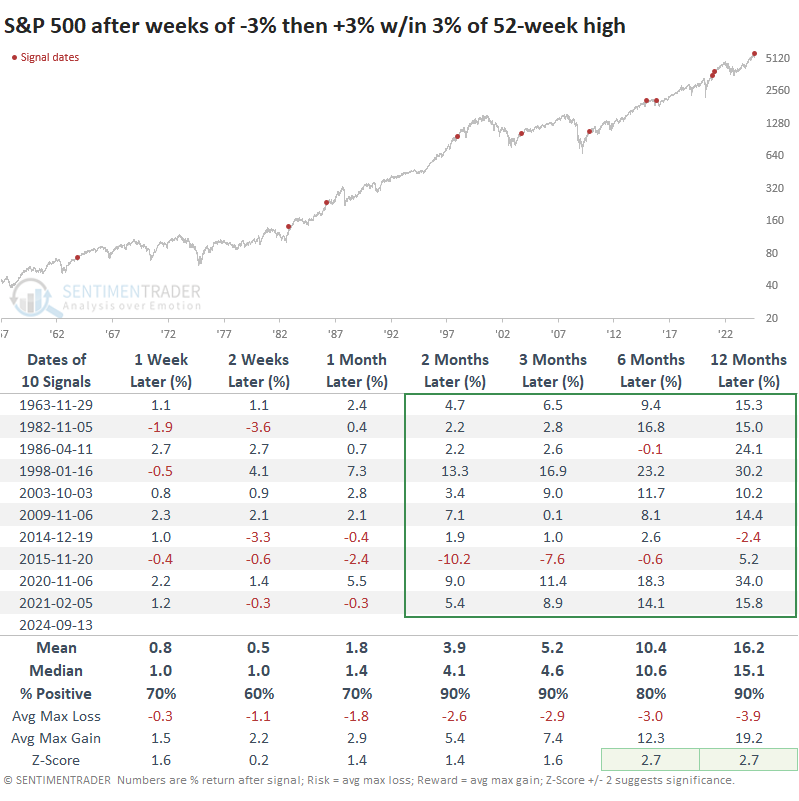
The S&P 500, the most benchmarked index in the world, fell more than -4% a week ago, then nearly made up that entire loss a week later. All while trading within spitting distance of a record high.
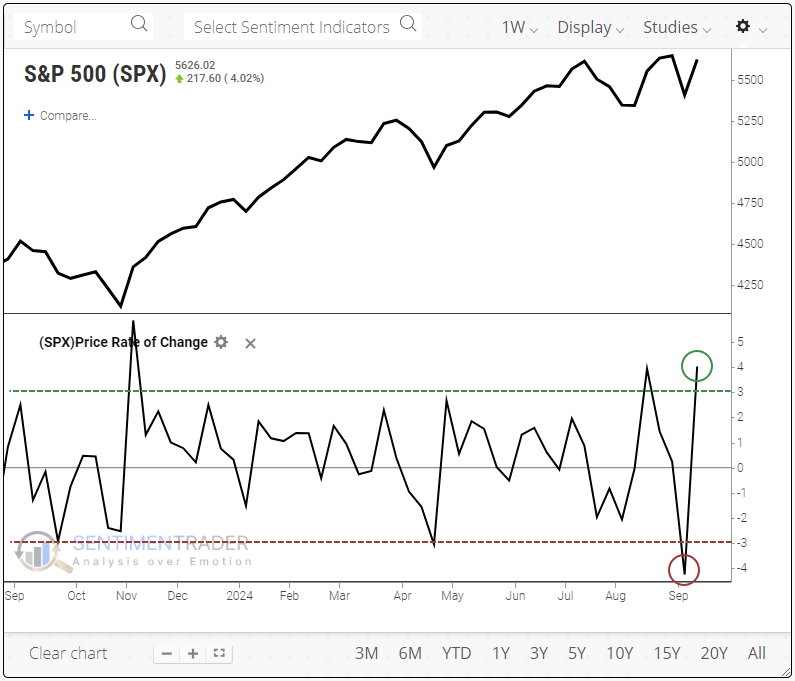
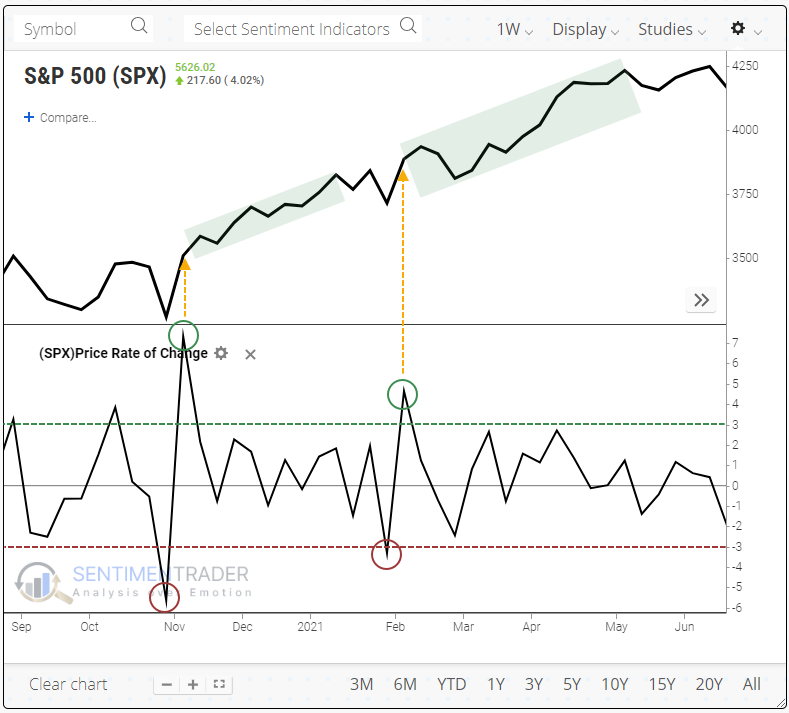
The only times this has happened in nearly a decade were during the post-pandemic recovery. Both preceded further gains.
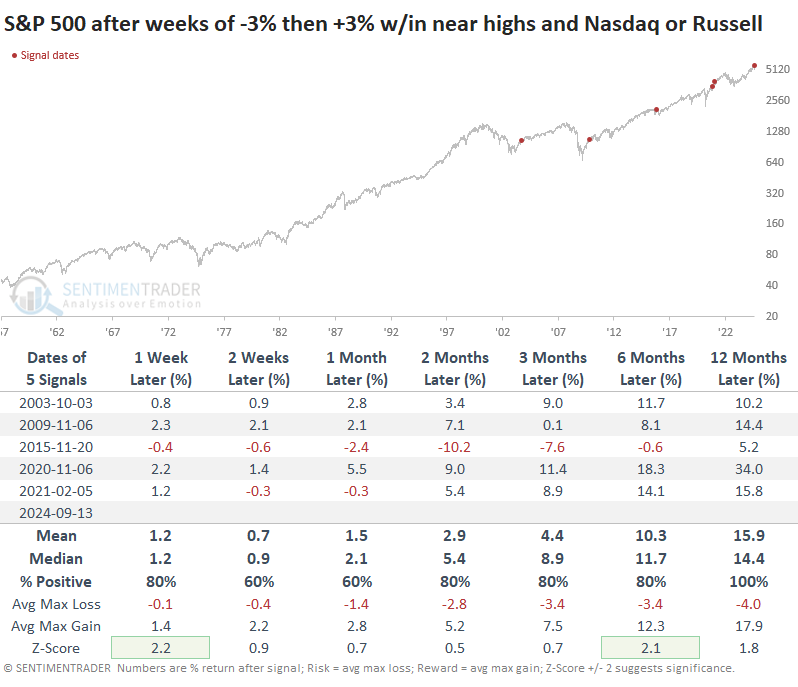
Since the index became a 500-stock index nearly 70 years ago, it has undergone similar weekly reversals only a handful of times. The reversals triggered buyers to step up their game each time, and the index enjoyed more gains over the next 2-6 months. Six months later, the S&P was up by double digits four of the five times.
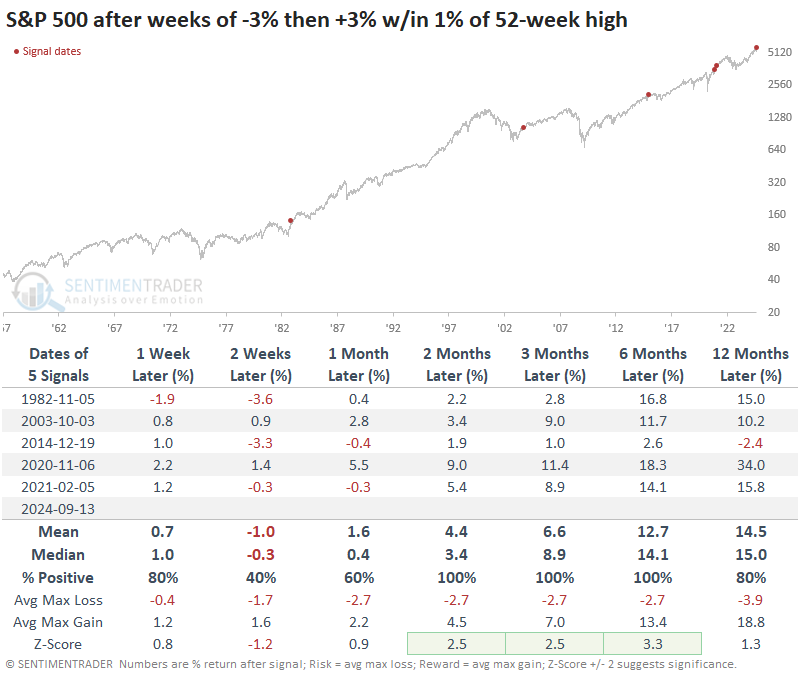
The lack of meaningful selling pressure is especially notable among the signals. The table of maximum gains and losses shows that within the following six months, only one signal suffered more than a -5% pullback.
We will be dealing with tiny sample sizes with behavior like this, but if we expand the reversals to include those within 3% of a 52-week high in the S&P 500, then at least we get double the number of signals. The conclusion remains mostly the same, with a consistent win record over the medium- to long-term. There was only one, in 2014, that preceded any kind of substantial selling across any time frame. It was the only one with more than a -10% drawdown within the following year.
Not just the S&P
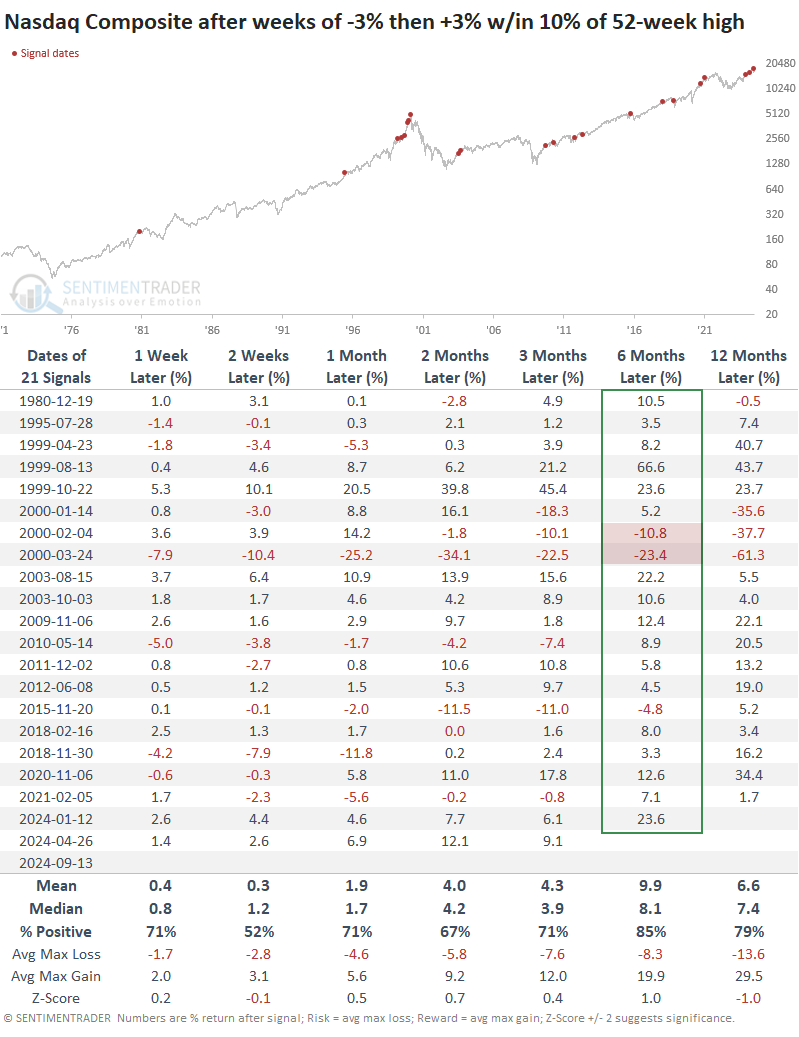
The Nasdaq Composite also underwent a significant weekly reversal. The index is more volatile than the S&P 500, so we'll look at +/-3% reversals within 10% of a 52-week high in the index. Over the next six months, the only actual failures were the signals that were triggered near the peak of the internet bubble.
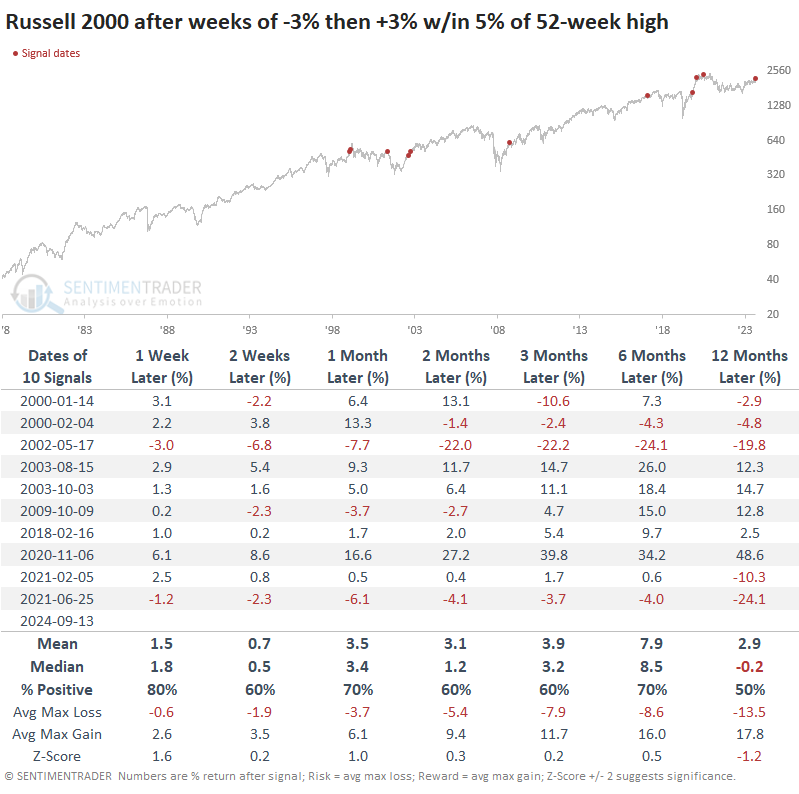
The small-cap Russell 2000 also nearly reversed its previous weekly loss while hovering within pullback territory. That index had less success in pulling in buyers who fretted they were missing out.
When we combine all three indexes and look for significant weekly reversals across all three during the same week, there were only three precedents. The S&P 500 was up by double-digits each time over the next six months.
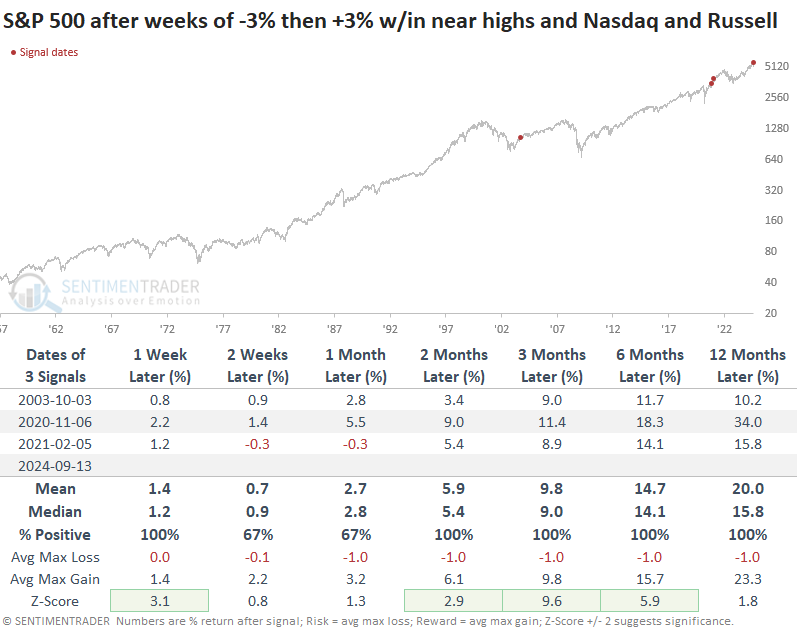
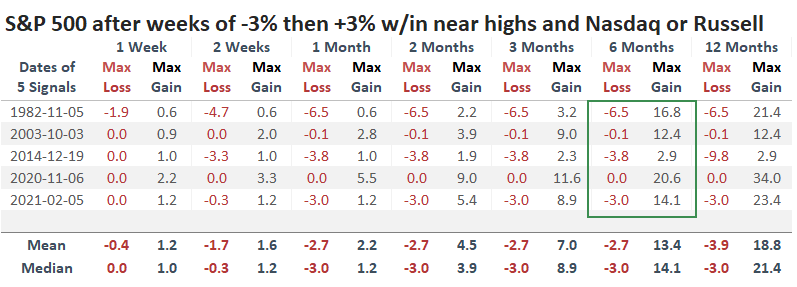
Again, with the small sample size, it pays to relax the parameters. So, the table below shows weekly reversals in the S&P 500 along with either the Nasdaq Composite or the Russell 2000. Stocks suffered significant losses into early 2016, but those were quickly erased and overall returns were impressive.
What the research tells us...
The fear of missing out is a natural phenomenon. A significant weekly price reversal isn't necessarily enough to trigger the condition, but it most often is when it occurs near a price extreme. "Most often" is probably too weak of a qualifier - "almost without exception" would be more appropriate.
When the most important index in the world almost wholly reverses a meaningful loss that occurs near the highest price in months, investors have shown a consistent tendency to believe the worst is behind them and raise their bids. With few exceptions and possibly none (depending on your definition), price action, as we've seen over the past couple of weeks, has preceded ever-higher prices in the months ahead.