Products
SentimenTrader Trading Tools
‍
Backtest Engine
My Trading Toolkit
Correlation Analysis
Seasonality
Indicators & Data API
‍
Proprietary Indicators & Charts
Market Data API
Strategies & Scanner
‍
50+ Trading Strategies
Smart Stock Scanner
Research Reports
‍
Research Solutions
Reports Library
Free Resources
Simple Backtest Calculator
Simple Seasonality Calculator
The Kelly Criterion Calculator
Sentiment Geo Map
Public Research Reports
Education
Sentiment Indicators
Technical Indicators
Pricing
Company
About
In the News
Testimonials
Client Success Stories
Contact
Log inLoginSign up
< BACK TO ALL REPORTS

Wednesday Midday Color

Jason Goepfert
2019-03-06
null

Here's what's piquing my interest so far on this weak day.

Ebbing Momentum

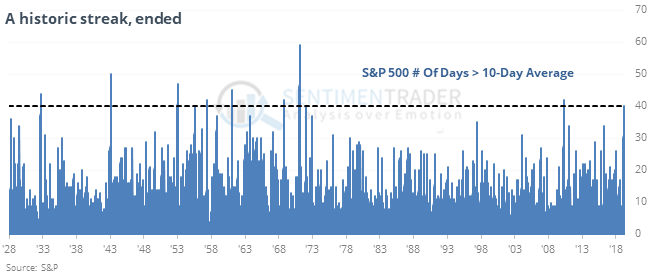
The S&P 500 has finally closed below its 10-day moving average for the first time in at least 40 sessions. That's one of its most persistent short-term trends since 1928.

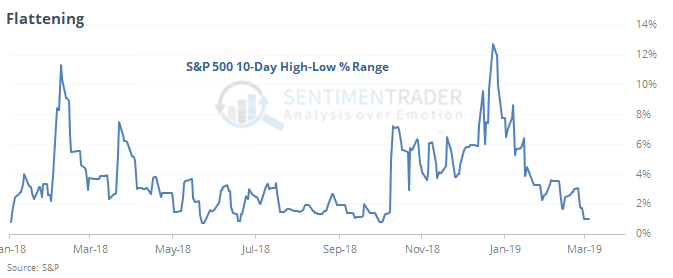
At the same time, it has flattened out. Over the past 10 days, the difference between its highest and lowest closes is barely 1%, the least amount of volatility in months.

It seems like this combination (low volatility with waning momentum) should be a bad sign, but historically it has not been.

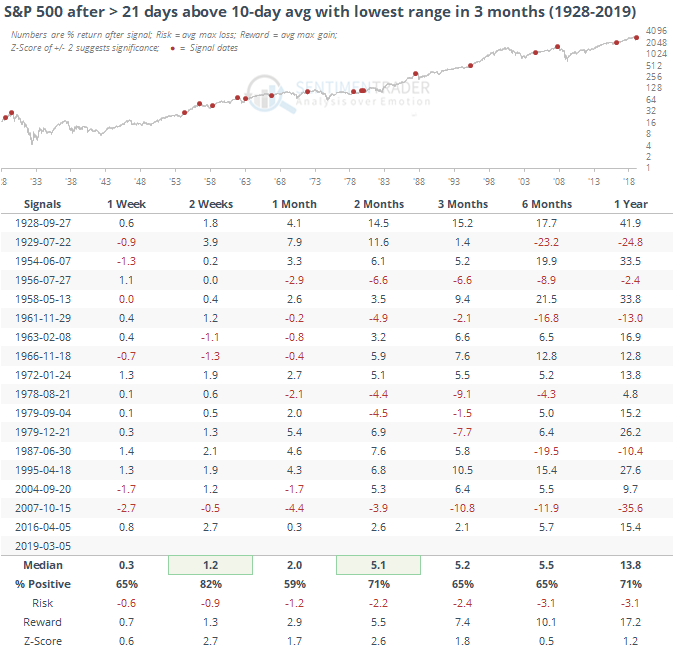
Over the next two weeks, especially, the S&P did well, with only minor losses. This is surprising - personally, I thought it would be much more negative. Momentum does not die easily, though I'd be surprised if it manages to follow through on this this time as the negatives have built up. On the downside, several of the short-term rebounds ended up failing and leading to large medium- to long-term losses.

No Premium For Liquidity

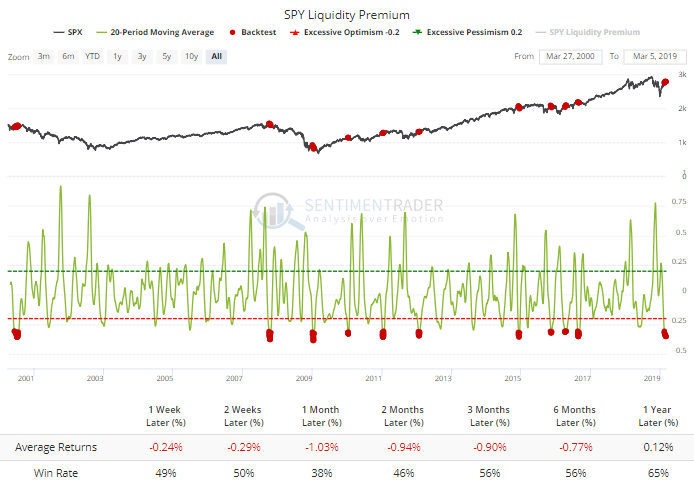
Among those worries, traders have given up on the idea that they need the liquidity provided by major ETFs like SPY, as opposed to trading individual stocks. The SPY Liquidity Premium has fallen drastically, which has been a consistent sign of too much complacency.

Oversold

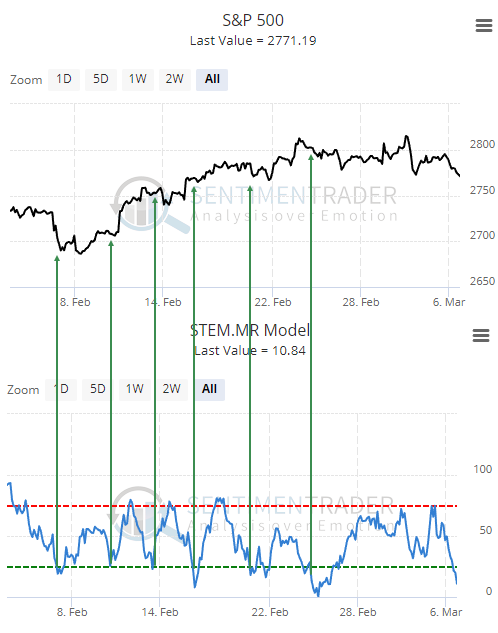
In the very short-term, our shortest-term model has hit an intraday oversold reading. Over the past 2 weeks, this has led to limited downside as buyers stepped in almost immediately. But the last signal didn't, and stocks rolled over right after the model hit overbought. This is an additional sign of waning momentum.
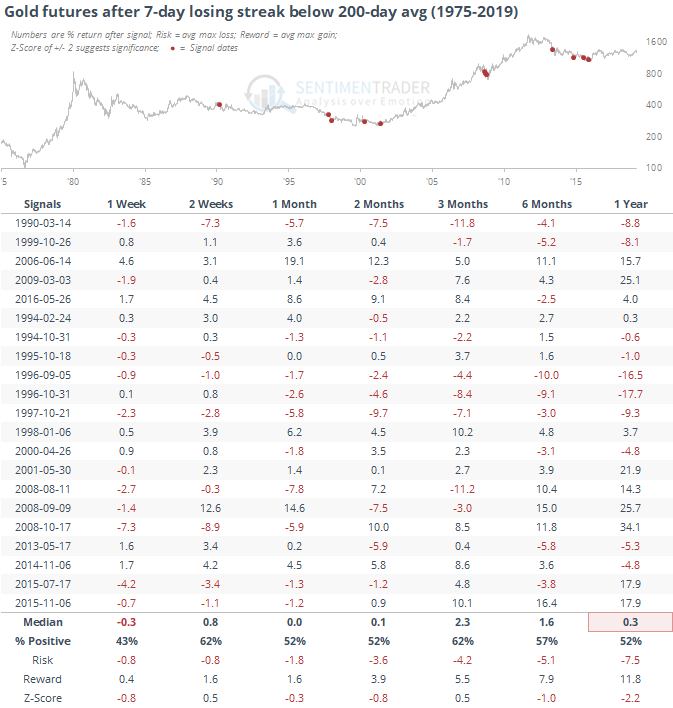
Gold

Gold futures declined for the 7th day in a row, and look to increase that streak Wednesday, but still remain above the 200-day average.

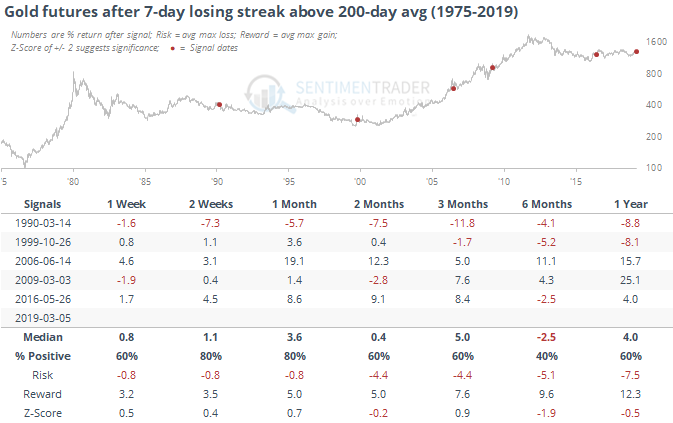
Returns were good except for 1990. They were a lot better than when gold suffered a 7-day losing streak and it was below its 200-day average.


Sorry, you don't have access to this report

Upgrade your subscription plan to get access
Go to Dasboard
PRODUCTS
SentimenTrader
Trading Tools
Indicators & Data API
‍
Strategies & Scanner
‍
Research Reports
FREE
RESOUrCES
Simple Backtest
Calculator
Simple Seasonality
Calculator
The Kelly Criterion
Calculator
Sentiment Geo Map
‍
Public Research Reports
‍
Education
Sentiment Indicators
‍
Technical Indicators
‍
Pricing
Bundle pricing
‍
FAQ
‍
Announcements
‍
COMPANY
‍
About
‍
In the News
‍
Testimonials
‍
Client Success Stories
CONTACT
‍
General Inquiries
‍
Media Inquiries
‍
Financial Professionals Inquiries
‍
© 2025 Sundial Capital Research Inc. All rights reserved.
Setsail Marketing
TermsPrivacyAffiliate Program
Risk Disclosure: Futures and forex trading contains substantial risk and is not for every investor. An investor could potentially lose all or more than the initial investment. Risk capital is money that can be lost without jeopardizing ones’ financial security or life style. Only risk capital should be used for trading and only those with sufficient risk capital should consider trading. Past performance is not necessarily indicative of future results.

Hypothetical Performance Disclosure: Hypothetical performance results have many inherent limitations, some of which are described below. No representation is being made that any account will or is likely to achieve profits or losses similar to those shown; in fact, there are frequently sharp differences between hypothetical performance results and the actual results subsequently achieved by any particular trading program. One of the limitations of hypothetical performance results is that they are generally prepared with the benefit of hindsight. In addition, hypothetical trading does not involve financial risk, and no hypothetical trading record can completely account for the impact of financial risk of actual trading. for example, the ability to withstand losses or to adhere to a particular trading program in spite of trading losses are material points which can also adversely affect actual trading results. There are numerous other factors related to the markets in general or to the implementation of any specific trading program which cannot be fully accounted for in the preparation of hypothetical performance results and all which can adversely affect trading results.

Testimonial Disclosure: Testimonials appearing on this website may not be representative of other clients or customers and is not a guarantee of future performance or success.