Products
SentimenTrader Trading Tools
‍
Backtest Engine
My Trading Toolkit
Correlation Analysis
Seasonality
Indicators & Data API
‍
Proprietary Indicators & Charts
Market Data API
Strategies & Scanner
‍
50+ Trading Strategies
Smart Stock Scanner
Research Reports
‍
Research Solutions
Reports Library
Free Resources
Simple Backtest Calculator
Simple Seasonality Calculator
The Kelly Criterion Calculator
Sentiment Geo Map
Public Research Reports
Pricing
Company
About
In the News
Testimonials
Client Success Stories
Contact
Log inLoginSign up
< BACK TO ALL REPORTS

Wednesday Midday Color

Jason Goepfert
2019-03-20
null

Here's what's piquing my interest so far ahead of the FOMC craziness.

Tweeps Loving China

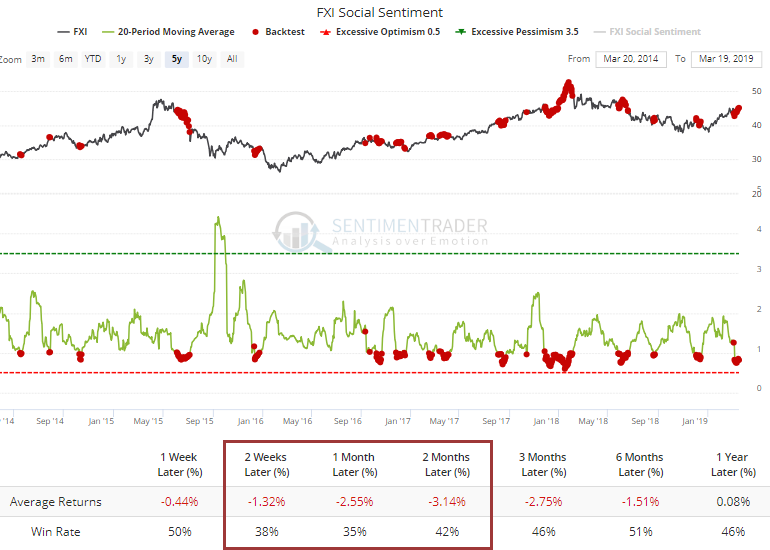
Social sentiment among Twitter users has become very optimistic over the past month. The 20-day average of Social Sentiment on FXI has dropped below 1, meaning that on an average day, there have been more optimistic Tweets about FXI than bearish ones. That hasn't been a good sign.

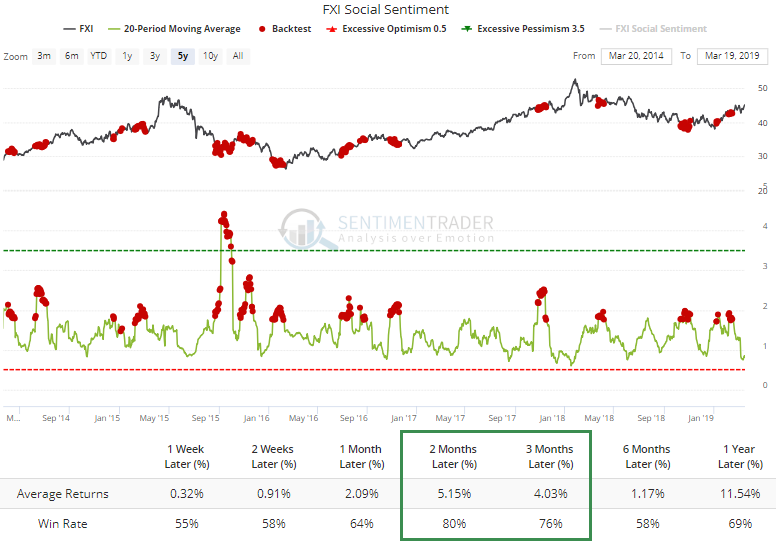
By contracts, when Twitter users were posting at least 75% more bearish messages than bullish ones, a sign of high pessimism, then FXI did quite well.

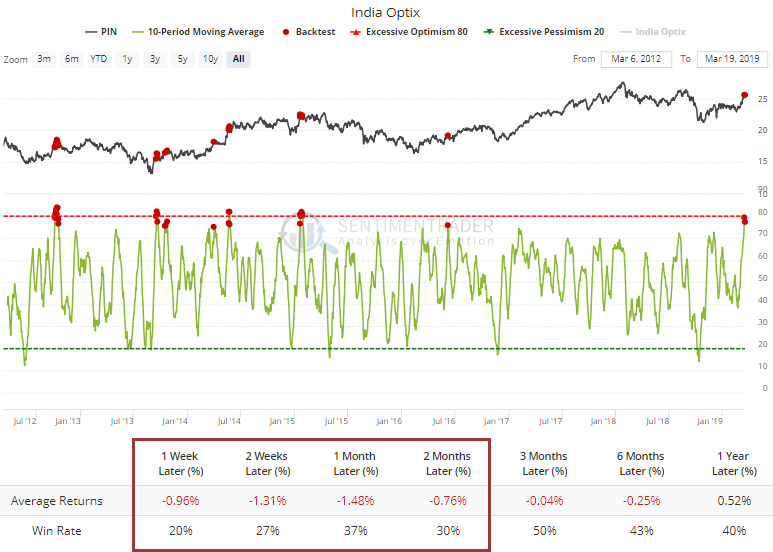
Sticking with Asian markets, optimism in funds like PIN has jumped over the past couple of weeks along with the outsized rally. PIN has struggled mightily after other times it got this high over a 2-week time frame.

Low Vol, Everywhere

We've touched on this several times over the past month or so, but volatility across assets has collapsed. Stocks, bonds, currencies, commodities, you name it.

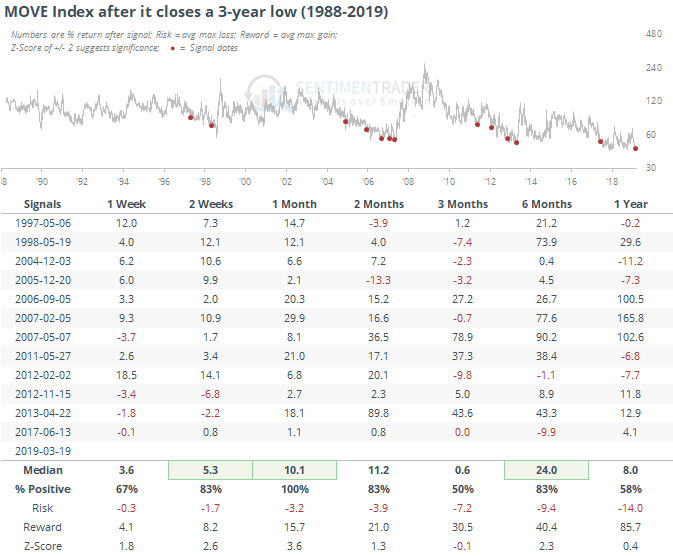
For bonds, the MOVE Index just dropped to a new multi-year low. That has led to a jump in bond volatility over the next month every time.

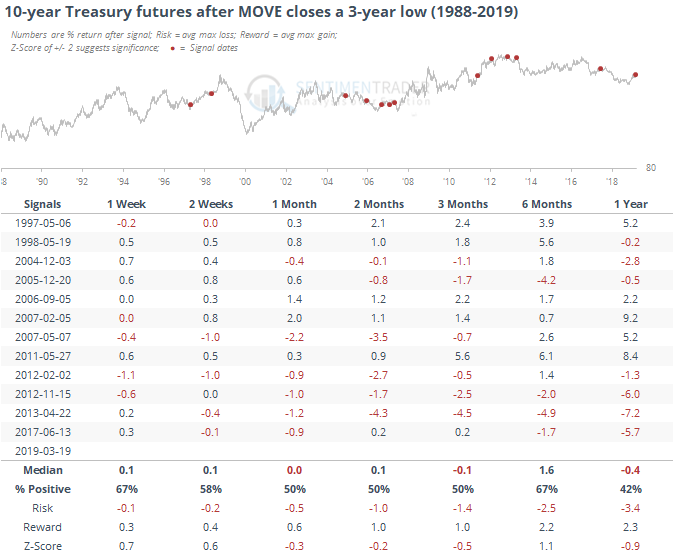
Returns on 10-year Treasury futures after other bouts of extremely low volatility were weaker than average, but pretty mixed.

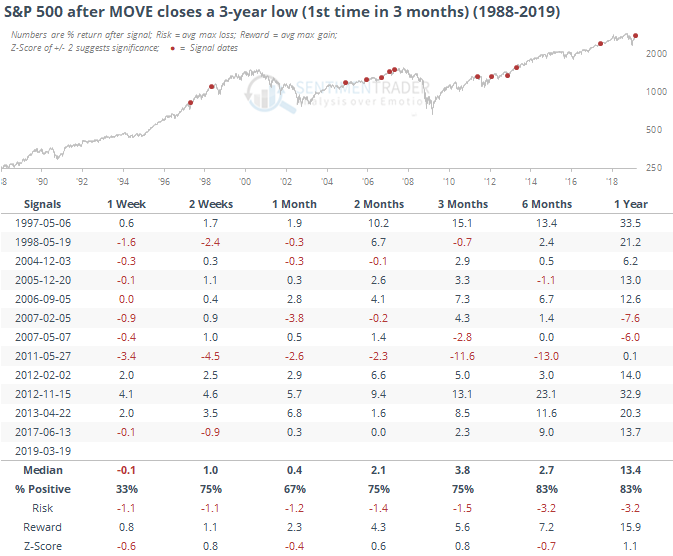
Mostly positive for stocks, for what it's worth.

Buybacks

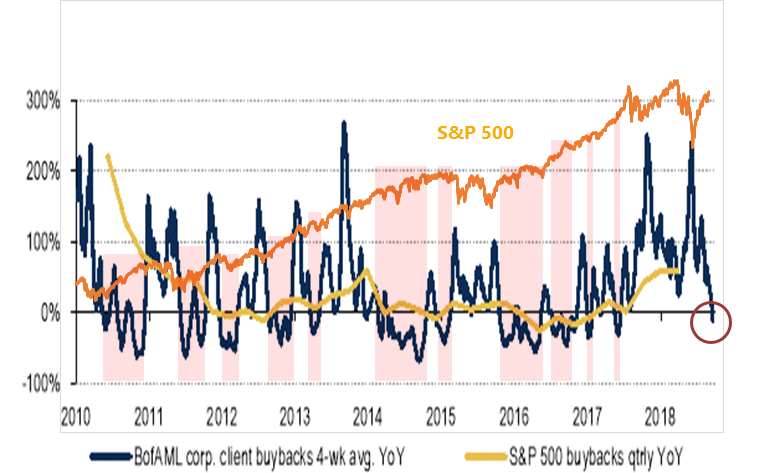
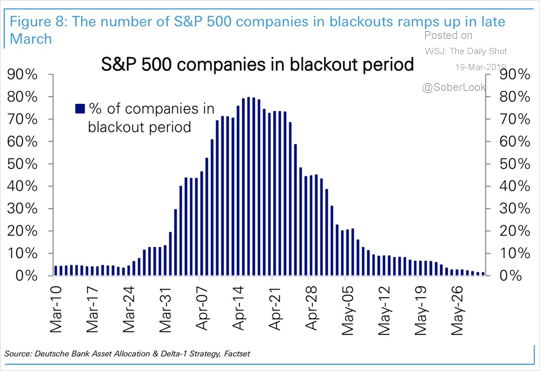
Ahead of every earnings season lately, traders become worried about corporate buybacks. They have become an increasingly large part of the support for stocks (via WSJ Daily Shot).

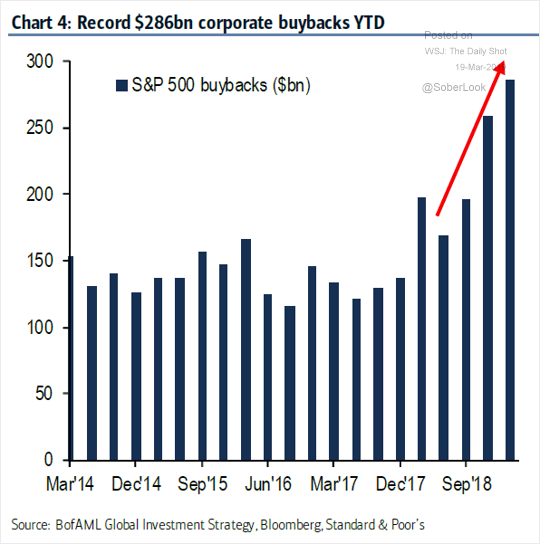
That causes anxiety as earnings season approaches since companies cannot buy back their own stock during "quiet periods" ahead of their earnings releases. That will become a factor in the coming weeks (via WSJ Daily Shot).

As noted by BofA, their clients are already starting to pull back on buybacks, with their 4-week average turning negative. If we superimpose the S&P 500 on the chart, we can see that when the trend in buybacks turns negative, the S&P has struggled some, but other times not so much. It was better as a buy signal (companies buying back a massive amount of stock) rather than a sell signal. It's perhaps a minor worry here, but has been too inconsistent to suggest it's an outright negative.

Sorry, you don't have access to this report

Upgrade your subscription plan to get access
Go to Dasboard
PRODUCTS
SentimenTrader
Trading Tools
Indicators & Data API
‍
Strategies & Scanner
‍
Research Reports
FREE
RESOUrCES
Simple Backtest
Calculator
Simple Seasonality
Calculator
The Kelly Criterion
Calculator
Sentiment Geo Map
‍
Public Research Reports
‍
Pricing
Bundle pricing
‍
Announcements
‍
FAQ
COMPANY
‍
About
‍
In the News
‍
Testimonials
‍
Client Success Stories
CONTACT
‍
General Inquiries
‍
Media Inquiries
‍
Financial Professionals Inquiries
‍
© 2025 Sundial Capital Research Inc. All rights reserved.
Setsail Marketing
TermsPrivacyAffiliate Program
Risk Disclosure: Futures and forex trading contains substantial risk and is not for every investor. An investor could potentially lose all or more than the initial investment. Risk capital is money that can be lost without jeopardizing ones’ financial security or life style. Only risk capital should be used for trading and only those with sufficient risk capital should consider trading. Past performance is not necessarily indicative of future results.

Hypothetical Performance Disclosure: Hypothetical performance results have many inherent limitations, some of which are described below. No representation is being made that any account will or is likely to achieve profits or losses similar to those shown; in fact, there are frequently sharp differences between hypothetical performance results and the actual results subsequently achieved by any particular trading program. One of the limitations of hypothetical performance results is that they are generally prepared with the benefit of hindsight. In addition, hypothetical trading does not involve financial risk, and no hypothetical trading record can completely account for the impact of financial risk of actual trading. for example, the ability to withstand losses or to adhere to a particular trading program in spite of trading losses are material points which can also adversely affect actual trading results. There are numerous other factors related to the markets in general or to the implementation of any specific trading program which cannot be fully accounted for in the preparation of hypothetical performance results and all which can adversely affect trading results.

Testimonial Disclosure: Testimonials appearing on this website may not be representative of other clients or customers and is not a guarantee of future performance or success.