Products
SentimenTrader Trading Tools
‍
Backtest Engine
My Trading Toolkit
Correlation Analysis
Seasonality
Market Prediction
Indicators & Data API
‍
Proprietary Indicators & Charts
Market Data API
Strategies & Scanner
‍
50+ Trading Strategies
Smart Stock Scanner
Smart Option Scanner
Research Reports
‍
Research Solutions
Reports Library
Free Resources
Simple Backtest Calculator
Simple Seasonality Calculator
The Kelly Criterion Calculator
Sentiment Geo Map
Public Research Reports
Education
Sentiment Indicators
Technical Indicators
Pricing
Company
About
In the News
Testimonials
Client Success Stories
Contact
Log inLoginSign up
< BACK TO ALL REPORTS

Wednesday Midday Color - Tech Breakout & Breadth, Screens

Jason Goepfert
2019-04-17
null

Here's what's piquing my interest so far on yet another potential reversal day.

Breakout

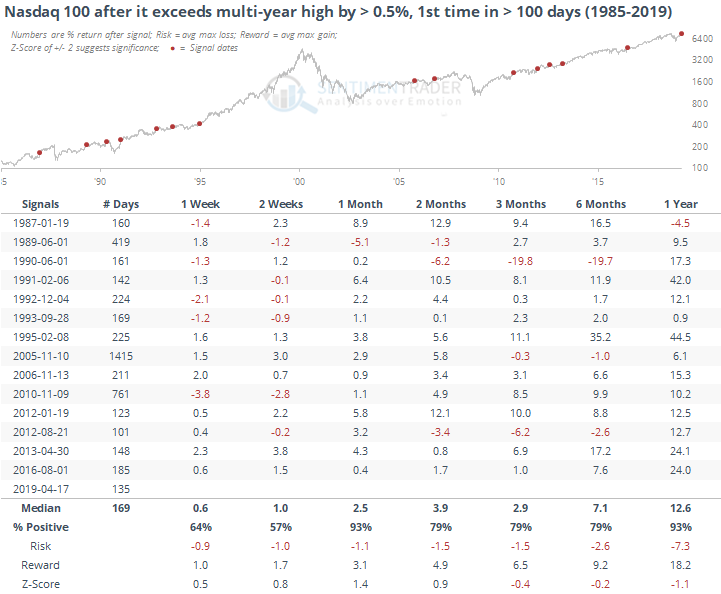
Even if the rally in tech fades, on an intraday basis the Nasdaq 100 has bested its prior multi-year high by at least 0.5%. The most bullish aspects about this market aren't fundamental, and they're certainly not sentiment-related, but price action has been pristine and it's been hard to find that kind of action.

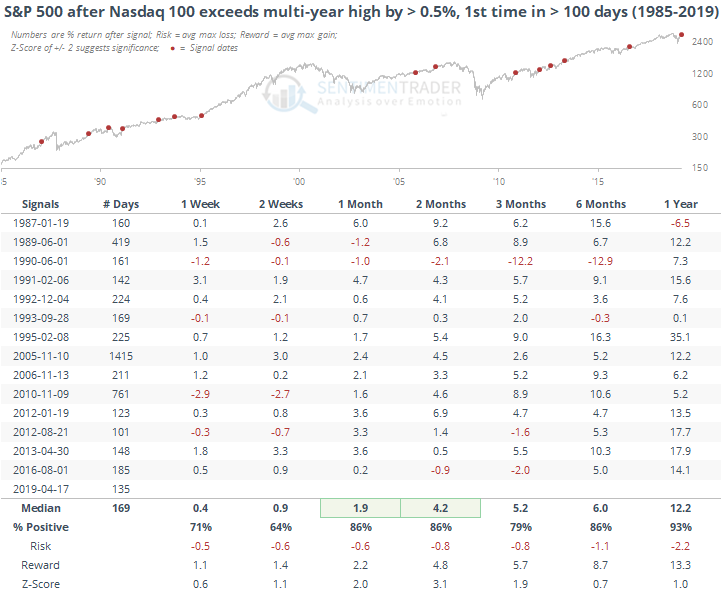
It's been good for the S&P 500 as well. Which is somewhere between hard and impossible to fully reconcile with the strong negatives we're currently seeing from past reactions to extremely optimistic sentiment.

Breadth Review

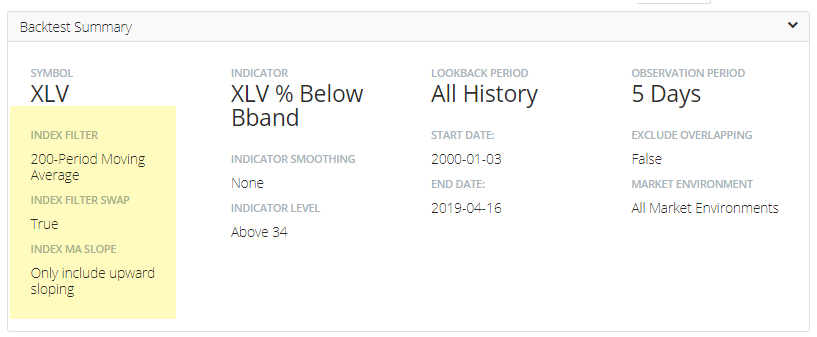
One of the unique things with the Backtest Engine is that it allows a user to look at different market contexts, which can have a big impact on what an indicator is suggesting. Take health care, for example.

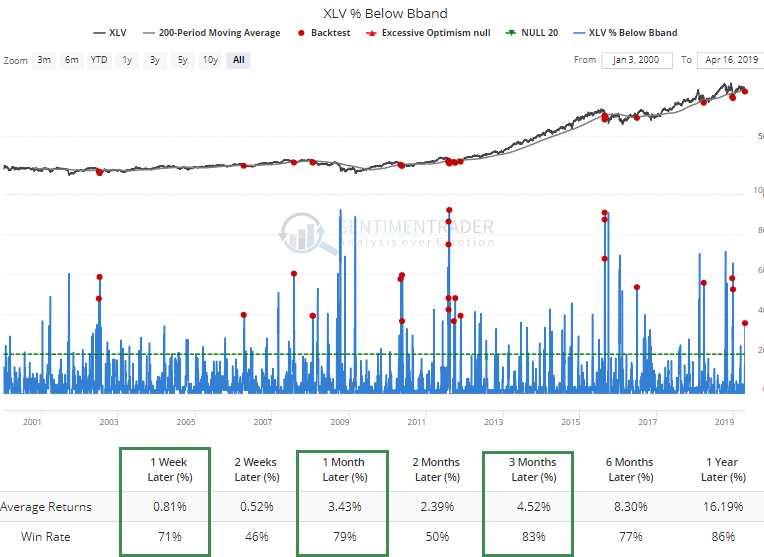
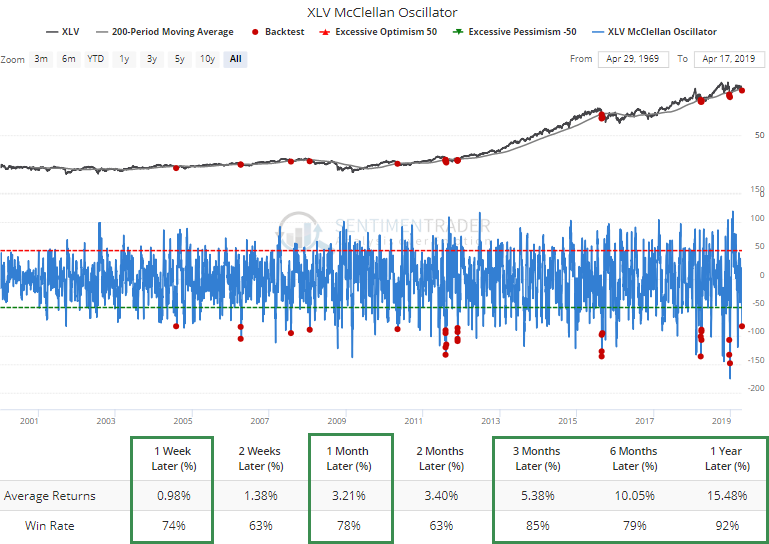
More than a third of the component stocks in the index dropped enough on Tuesday that they fell below their lower Bollinger Bands. But the XLV fund is still in a general uptrend, defined by its 200-day average rising, even though prices fell through that rising average this week.

When so many of the stocks have closed below their Bands while XLV is below its rising average, it has tended to rebound.

The same thing is being suggested by how far the McClellan Oscillator has declined.

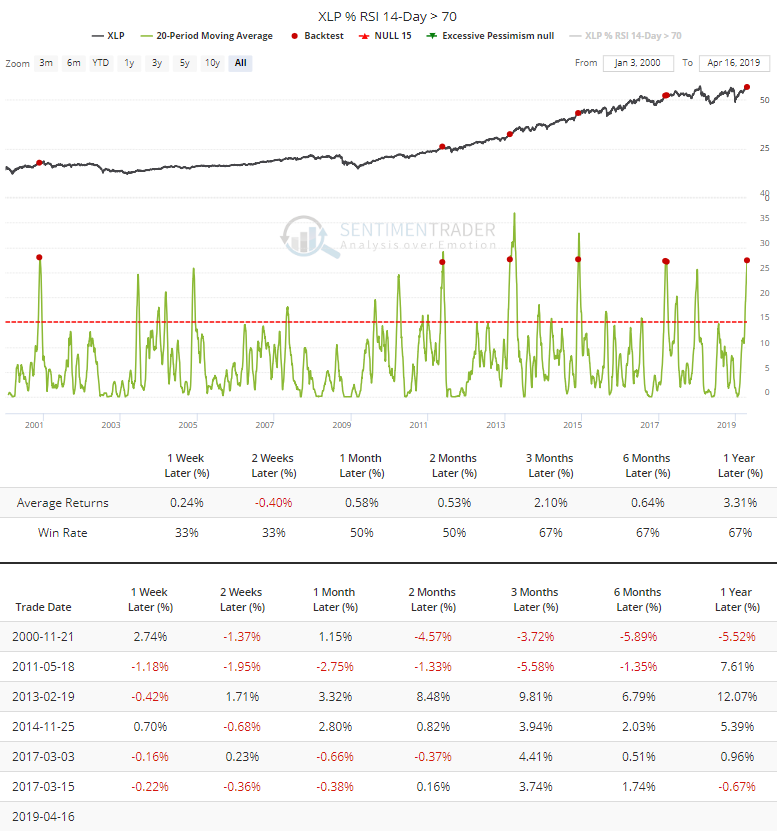
Among consumer staples stocks, 27% of them have been overbought on an average day over the past month. That's among the most persistently high readings in almost 20 years. Other times the sector put in this kind of performance, it struggled to maintain the momentum.

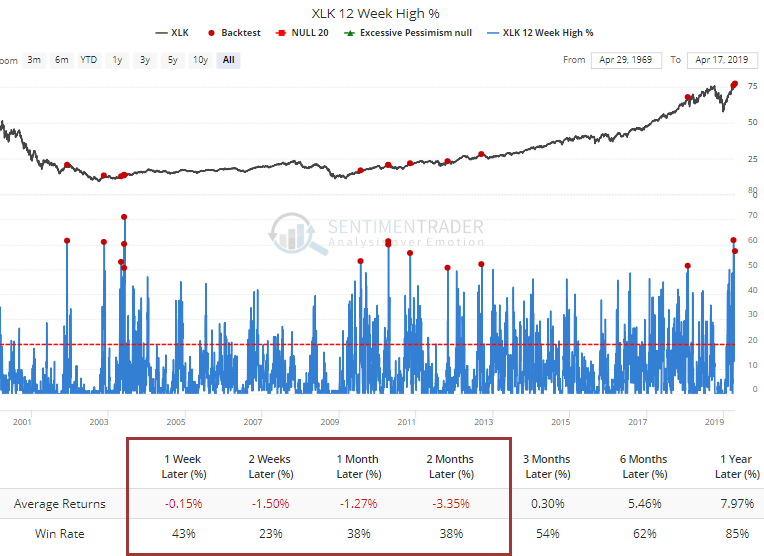
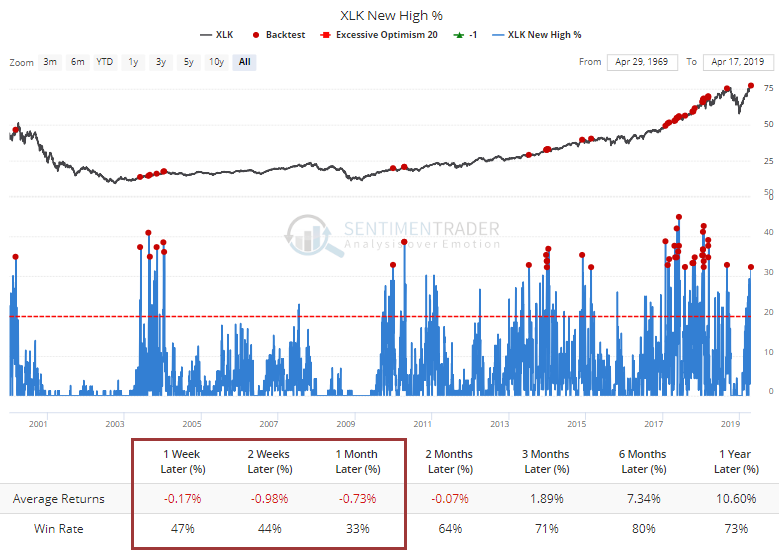
More than 55% of tech stocks hit a multi-month high on Tuesday. That hasn't happened very often.

Even when "only" 50% of them hit a new multi-month high together, funds like XLK have struggled to hold up.

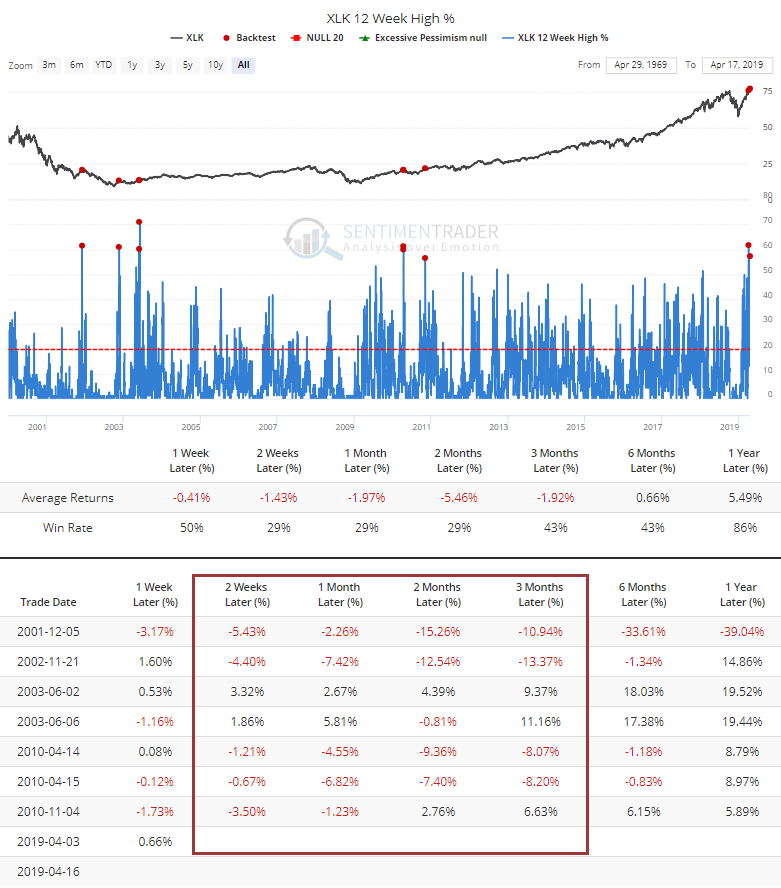
It's not just multi-month highs. Almost a third of tech stocks have reached new 52-week highs. Again, it's been tough to maintain that kind of wholesale momentum.

Screens

It's interesting to note that a lot of the funds that are showing up in green (excessive pessimism) in the Sentiment & Seasonality screen...

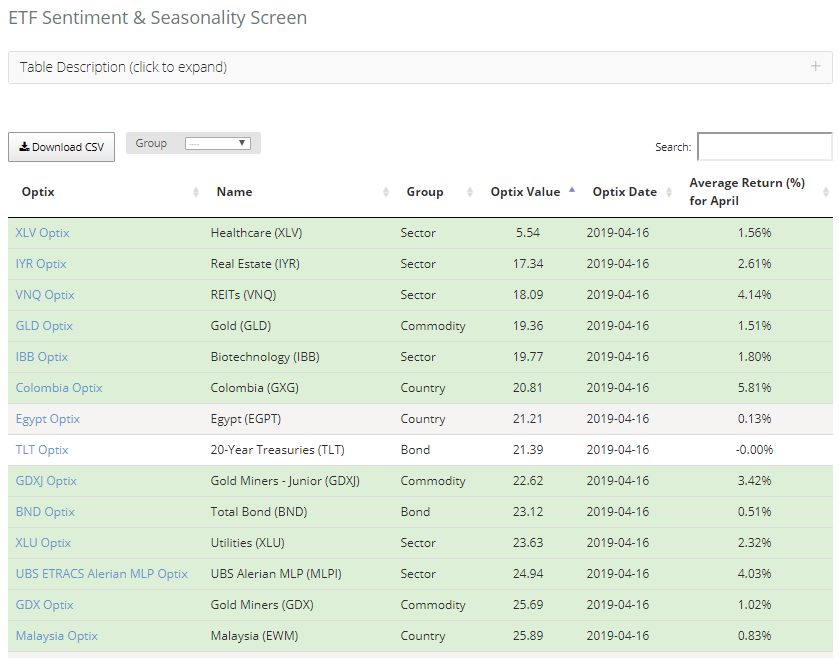
...are also showing up in the Sentiment & Trend screen.

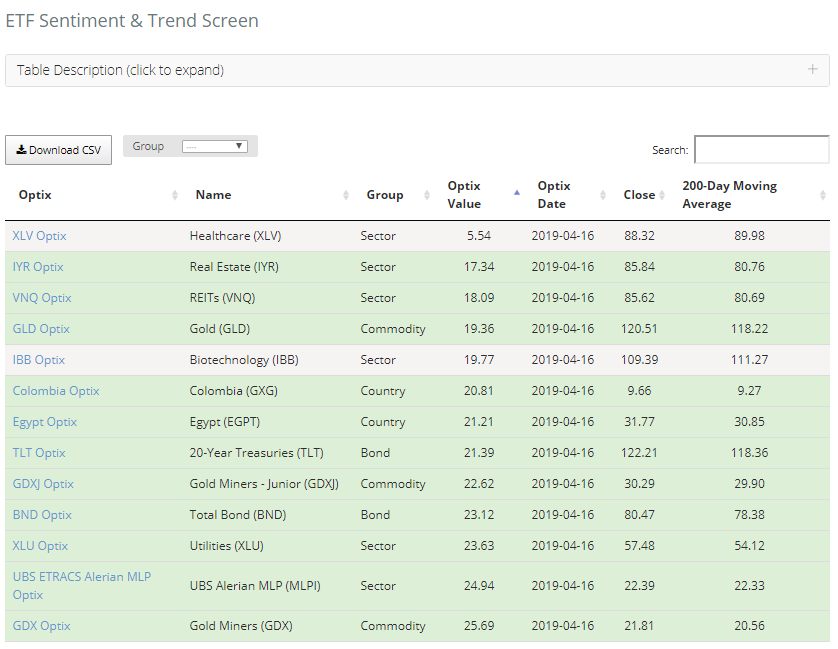
The former highlights funds with an Optimism Index below 30 but with better-than-average seasonal returns in April, while the latter highlights those with low optimism while the fund is still trading above its 200-day average.

PRODUCTS
SentimenTrader
Trading Tools
Indicators & Data API
‍
Strategies & Scanner
‍
Research Reports
FREE
RESOUrCES
Simple Backtest
Calculator
Simple Seasonality
Calculator
The Kelly Criterion
Calculator
Sentiment Geo Map
‍
Public Research Reports
‍
Education
Sentiment Indicators
‍
Technical Indicators
‍
Pricing
Bundle pricing
‍
FAQ
‍
Announcements
‍
COMPANY
‍
About
‍
In the News
‍
Testimonials
‍
Client Success Stories
CONTACT
‍
General Inquiries
‍
Media Inquiries
‍
Financial Professionals Inquiries
‍
© 2026 Sundial Capital Research Inc. All rights reserved.
Setsail Marketing
TermsPrivacyAffiliate Program
Risk Disclosure: The information and tools provided are for research and analytical purposes only and are not intended as investment advice. Market analysis involves uncertainty, and outcomes may differ from expectations. Users should conduct their own due diligence and consider their individual circumstances before making any financial decisions. Past performance is not necessarily indicative of future results.

Hypothetical Performance Disclosure: Hypothetical performance results have many inherent limitations, some of which are described below. No representation is being made that any account will or is likely to achieve profits or losses similar to those shown; in fact, there are frequently sharp differences between hypothetical performance results and the actual results subsequently achieved by any particular trading program. One of the limitations of hypothetical performance results is that they are generally prepared with the benefit of hindsight. In addition, hypothetical trading does not involve financial risk, and no hypothetical trading record can completely account for the impact of financial risk of actual trading. for example, the ability to withstand losses or to adhere to a particular trading program in spite of trading losses are material points which can also adversely affect actual trading results. There are numerous other factors related to the markets in general or to the implementation of any specific trading program which cannot be fully accounted for in the preparation of hypothetical performance results and all which can adversely affect trading results.

Testimonial Disclosure: Testimonials appearing on this website may not be representative of other clients or customers and is not a guarantee of future performance or success.