Data &
Technology
Research
Reports
Report Solutions
Reports Library
Actionable
Strategies
Free
Resources
Simple Backtest Calculator
Simple Seasonality Calculator
The Kelly Criterion Calculator
Sentiment Geo Map
Public Research Reports
Free Webinar
Pricing
Company
About
Meet Our Team
In the News
Testimonials
Client Success Stories
Contact
Log inLoginSign up
< BACK TO ALL REPORTS

Wednesday Midday Color

Jason Goepfert
2019-04-10
null

Here's what's piquing my interest so far on this waiting-for-the-Fed day.

Mexican Momentum

In Friday's report, we saw that "The MSCI Mexico Index closed above its 200-days for the first time in six months on Friday. Other times it went this long before ending a downtrend, it added to gains over the next month 5 out of 6 times averaging 4.6% (the sole loser was -0.7%). Reward over the next month was three times larger than risk."

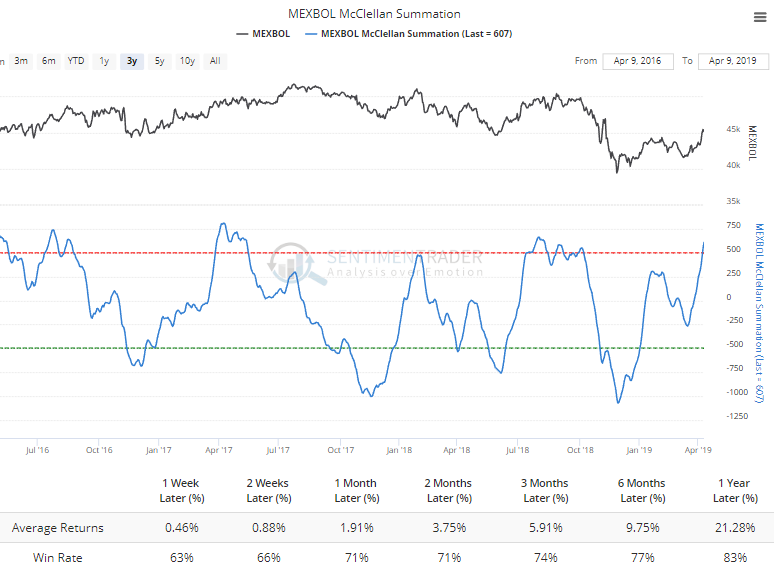
The Mexbol rally has continued with good, broad-based breadth. Its McClellan Summation Index just crossed above +500 for the first time in 6 months. Over the past 17 years, its forward return was good after the 1,388 days when the Summation Index was above this threshold.

If we focus on those day when the Summation crossed 500 for the first time in at least 3 months, then there were some failures, but overall the returns were positive.

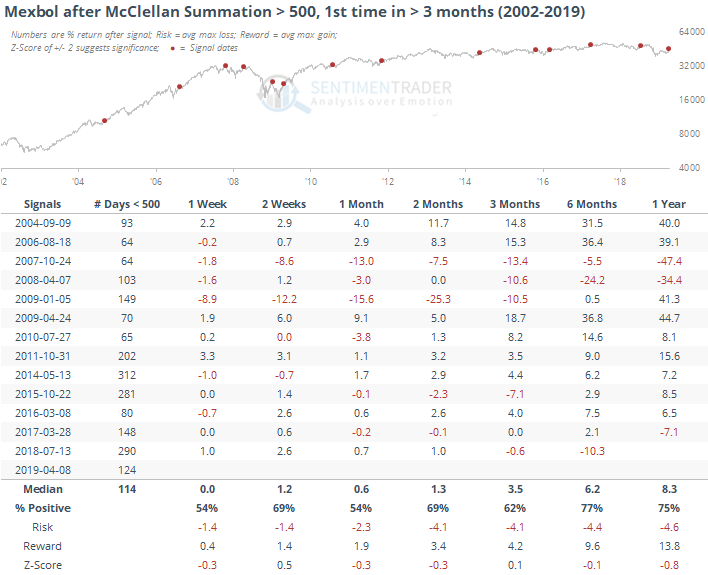
The only large medium-term failures were during the midst of the financial crisis.

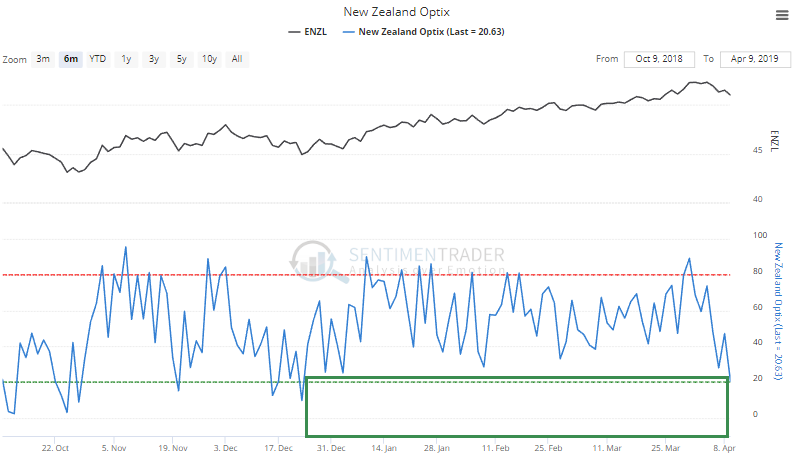
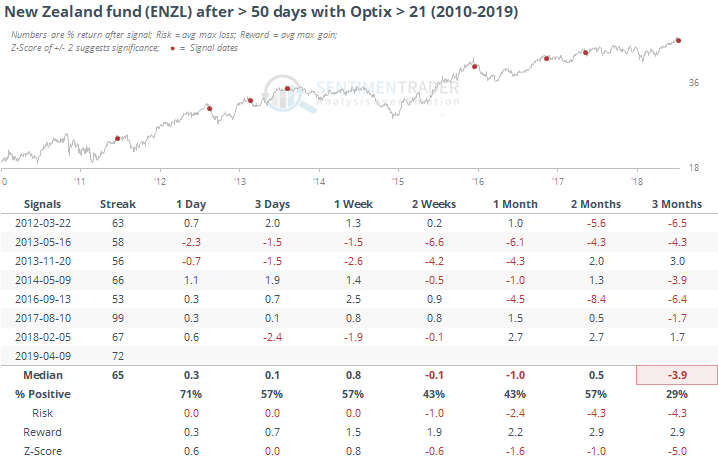
Among the country ETFs we follow, the ENZL fund of New Zealand stocks has been on quite a streak. It went more than 70 days without an Optimism Index below 21, which ended yesterday. Since the fund's 2010 inception, this ranks as one of the longest streaks.

The fund had a tendency to bounce back in the very short-term, but had some struggles medium-term.

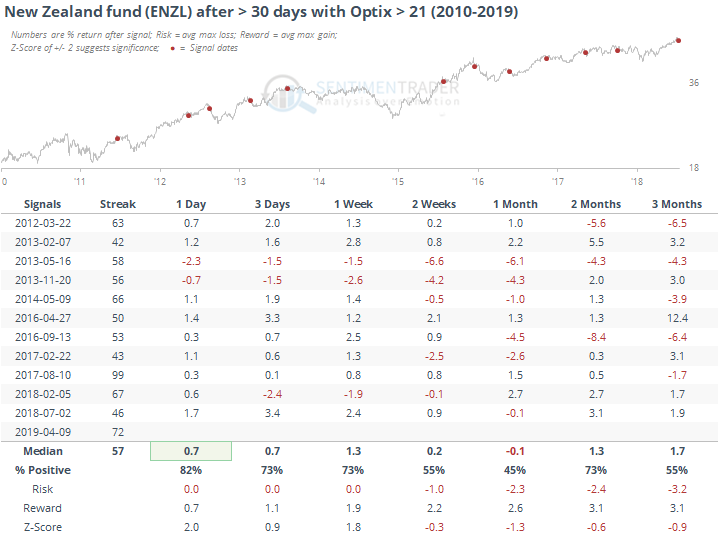
When the streak lasted longer than 50 days, it seems the ebbing optimism tended to last longer, with worse longer-term returns. It has a short history, though.

Failing Quickly

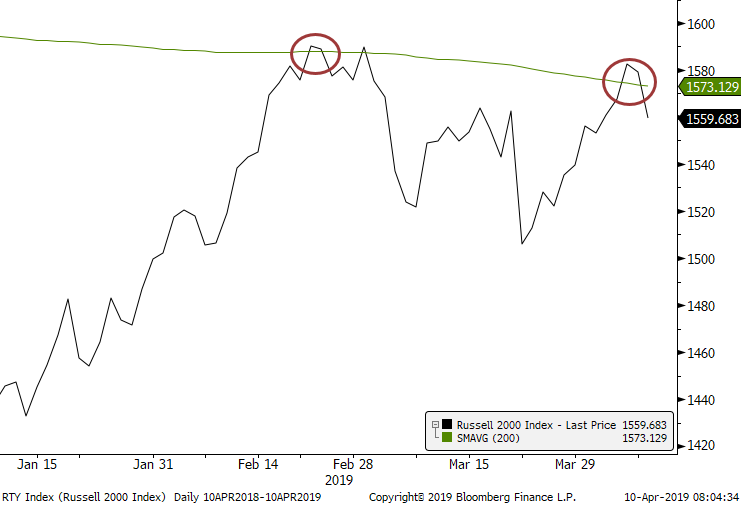
The Russell 2000 failed to hold above its 200-day average. The index has been weaker than most of its brethren and this is more evidence that not all stocks are being treated equally here.

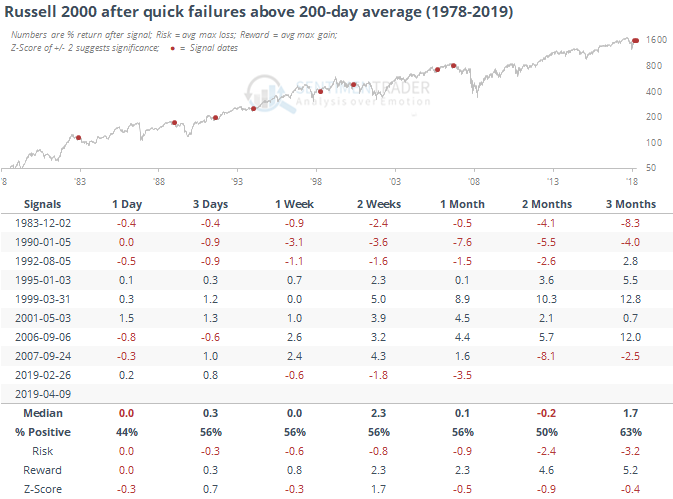
Historically, when the Russell was below its 200-day average for at least a month, then rose above it for less than a week before failing, it didn't tell us a whole lot.

Tech Enthusiasm

Yesterday, we saw that big breakouts in the tech sector have typically led to impressive longer-term returns. Shorter-term, there are more minor warning signs popping up. Social sentiment is becoming quite bullish, and now options traders are paying up for the potential of further upside. This usually doesn't work well for them (from Erlanger Research).

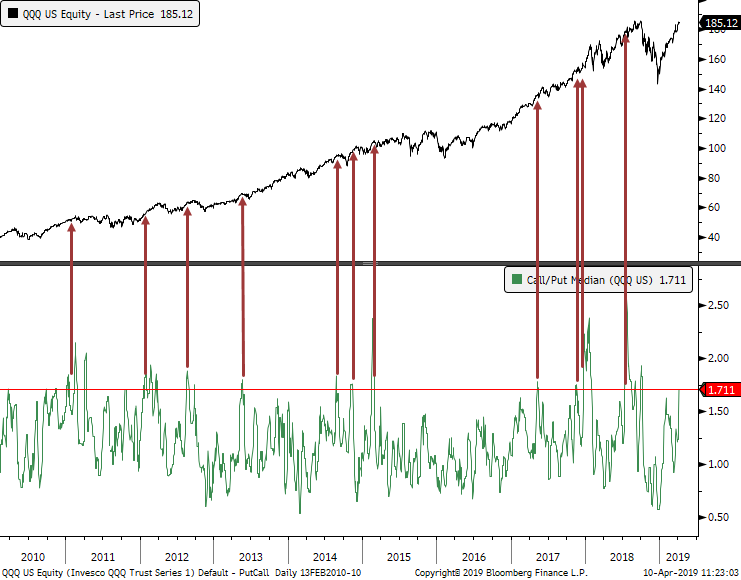
Again, not foolproof by any means, but by the time enthusiasm has reached this stage, further short-term gains were usually given back at some point.

Sorry, you don't have access to this report

Upgrade your subscription plan to get access
Go to Dasboard
DATA &
TECHnologies
IndicatorEdge
‍
BackTestEdge
‍
Other Tools
‍
DataEdge API
RESEARCH
reports
Research Solution
‍
Reports Library
‍
actionable
Strategies
Trading Strategies
‍
Smart Stock Scanner
‍
FREE
RESOUrCES
Simple Backtest
Calculator
Simple Seasonality
Calculator
The Kelly Criterion
Calculator
Sentiment Geo Map
‍
Public Research Reports
‍
Free Webinar
COMPANY
‍
About
‍
Meet our Team
‍
In the News
‍
Testimonials
‍
Client Success Stories
Pricing
Bundle pricing
‍
Announcements
‍
FAQ
© 2024 Sundial Capital Research Inc. All rights reserved.
Setsail Marketing
TermsPrivacyAffiliate Program
Risk Disclosure: Futures and forex trading contains substantial risk and is not for every investor. An investor could potentially lose all or more than the initial investment. Risk capital is money that can be lost without jeopardizing ones’ financial security or life style. Only risk capital should be used for trading and only those with sufficient risk capital should consider trading. Past performance is not necessarily indicative of future results.

Hypothetical Performance Disclosure: Hypothetical performance results have many inherent limitations, some of which are described below. No representation is being made that any account will or is likely to achieve profits or losses similar to those shown; in fact, there are frequently sharp differences between hypothetical performance results and the actual results subsequently achieved by any particular trading program. One of the limitations of hypothetical performance results is that they are generally prepared with the benefit of hindsight. In addition, hypothetical trading does not involve financial risk, and no hypothetical trading record can completely account for the impact of financial risk of actual trading. for example, the ability to withstand losses or to adhere to a particular trading program in spite of trading losses are material points which can also adversely affect actual trading results. There are numerous other factors related to the markets in general or to the implementation of any specific trading program which cannot be fully accounted for in the preparation of hypothetical performance results and all which can adversely affect trading results.

Testimonial Disclosure: Testimonials appearing on this website may not be representative of other clients or customers and is not a guarantee of future performance or success.