Wednesday Color - Curve, Fund Managers, Gold & Yen, 1% Moves, Skew

Here's what's piquing my interest as we go through yet another volatile session.
Curvy
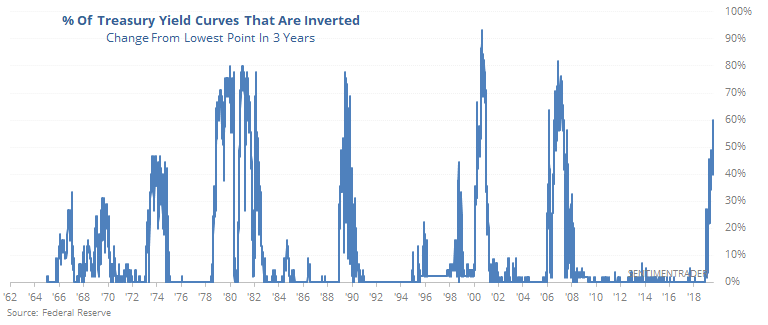
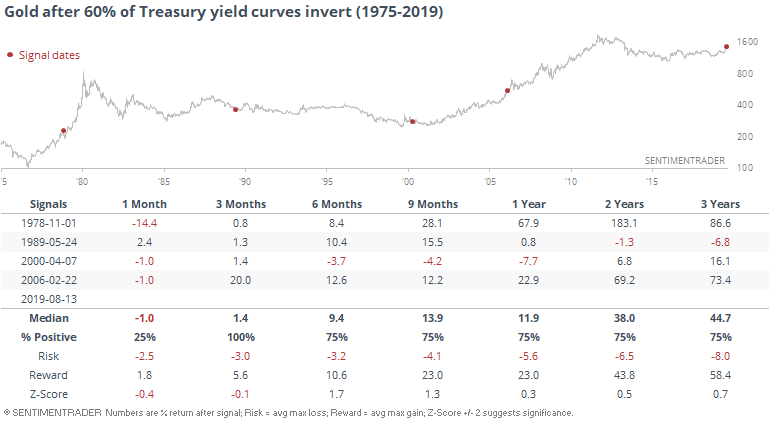
Might as well get to it, since it's going to be a popular topic today. Another part of the Treasury yield curve inverted (or threatening to do so depending on the data source). The one that matters the most according to most models is the 3mo - 10yr spread, but it's really just splitting hairs at this point.
According to Federal Reserve data, more than 60% of the various yield curves are now inverted, the most since 2007.
It always sounds ominous, and certainly was in 2000. Otherwise? Not so much, at least for a while for the S&P 500.
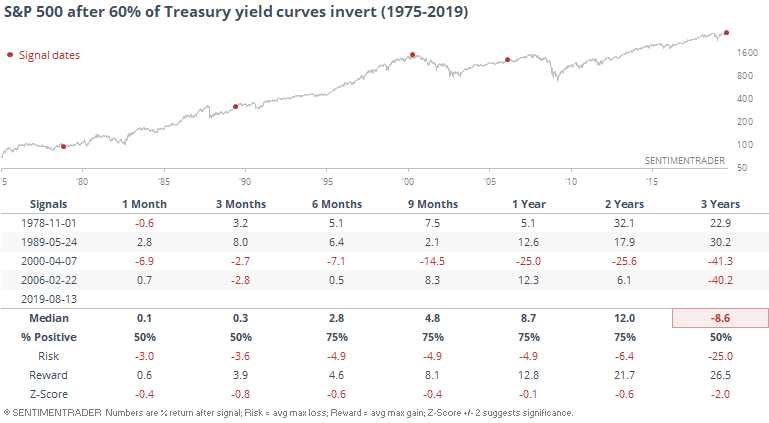
The S&P 500 rose 3 out of the 4 times, showing hefty gains except for that 2000 signal.
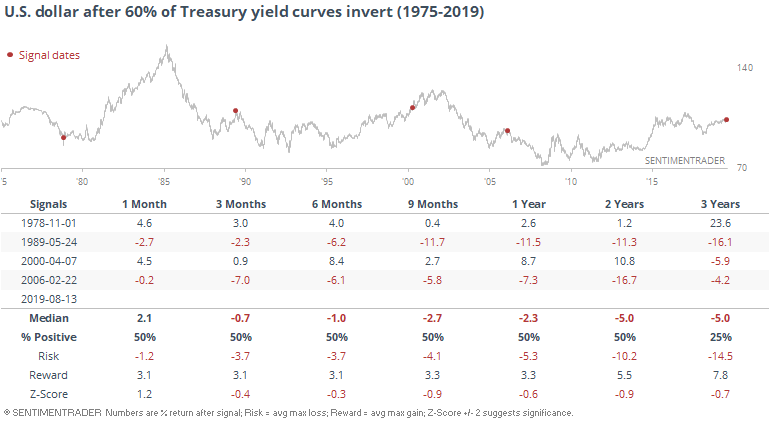
It was actually worse for the dollar than it was for stocks.
Gold fared better than stocks did.
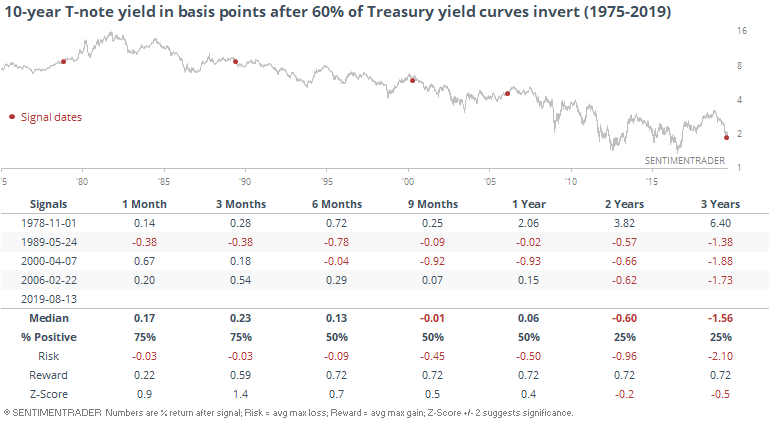
10-year yields were mixed.
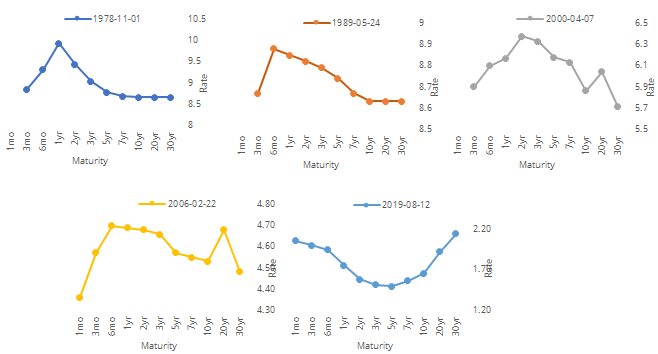
Triggering the "this time is different" chorus could be the fact that this spate of inversions looks different compared to the others. It's more of a smile than a curve. We haven't seen that before.
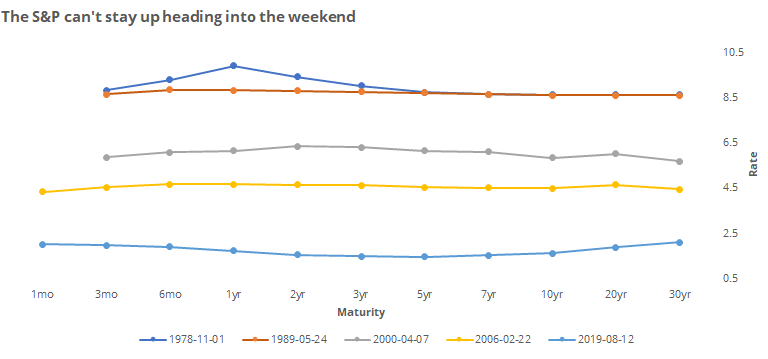
That's brought into especially stark relief when looking at them individually.
Does that matter? Dunno. The last thing I'd profess to be is an economic expert. And most of the true experts don't know what it means, anyway since we're in uncharted territory here.
Mostly, though, the takeaway seems to be that even though more curves are inverting, it has not spelled immediate doom for stocks.
Meh Managers
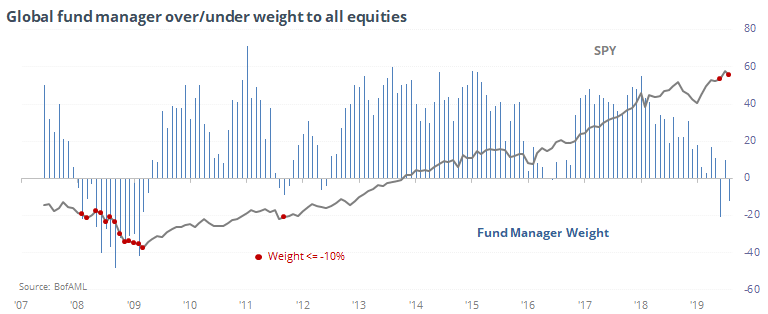
The latest monthly survey of large money managers from Bank of America Merrill Lynch showed that they continue to see dire prospects for U.S. stocks. On average, they are more than 10% underweight. This kind of pessimism hasn't been seen too many times since the financial crisis.
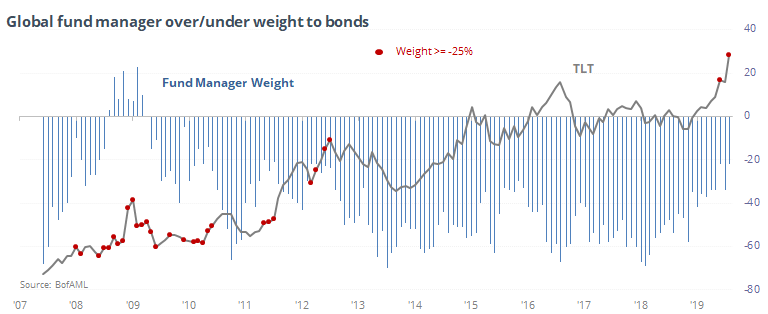
They're relatively optimistic on bonds, or at least less pessimistic, than they've been most months over the past 7 years or so. That hasn't been a consistent negative for bond prices, though.
Sector Breadth
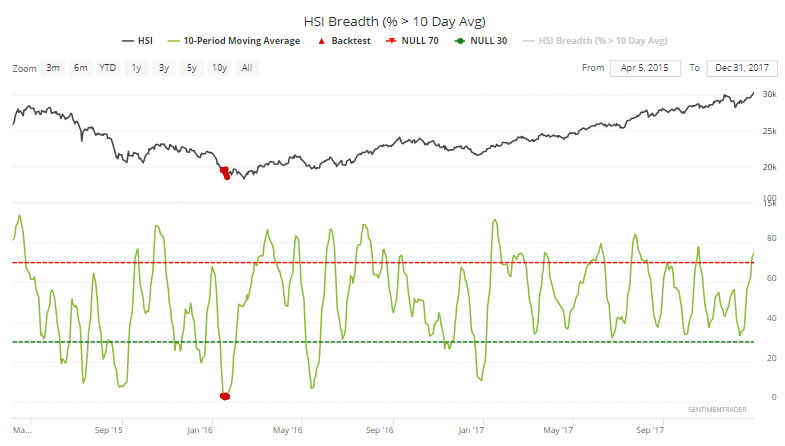
With all eyes on Hong Kong, there have been more signals triggering on the Hang Seng suggesting markets are nearing extreme pessimism. The selling has been so persistent that few stocks in the index have even been able to climb above their 10-day moving averages for even a day.
The 10-day average has dropped below 4.5% for only the 2nd time in 17 years. When it happened in January 2016, that was about it for the selling.
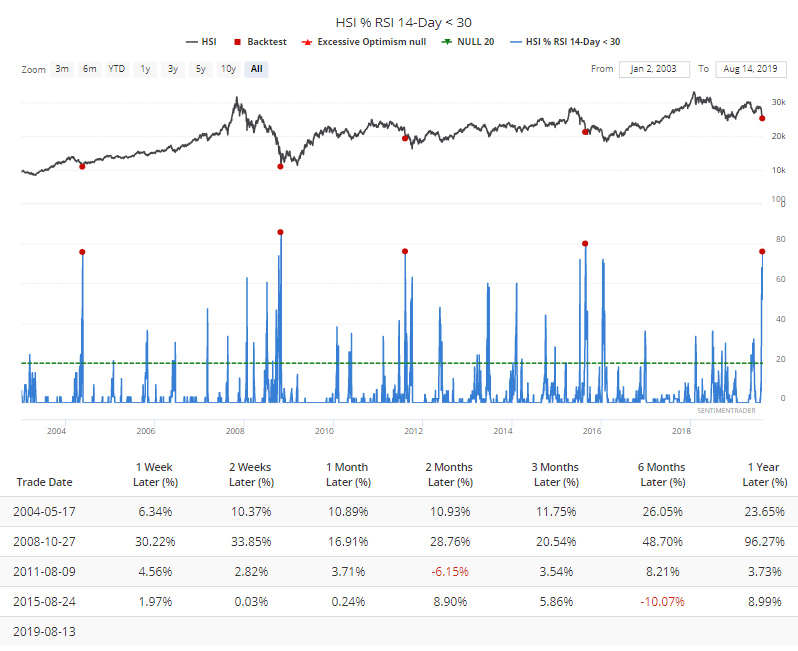
A whopping 3 out of every 4 stocks are now oversold. Every time that's triggered, it has led to short-term rebounds.
Gold, Yen
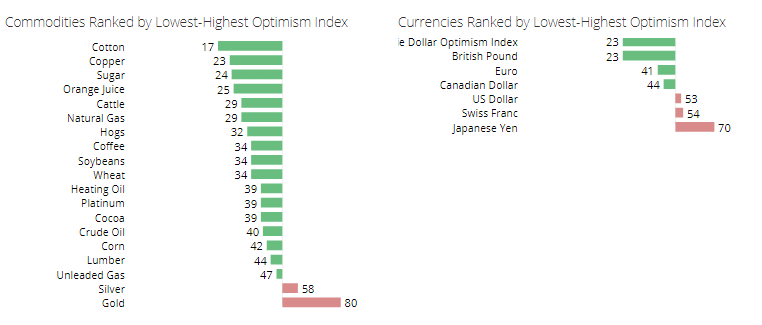
Among currencies and commodities, the surge in optimism in both gold and the yen show just how much "risk off" sentiment there is right now.
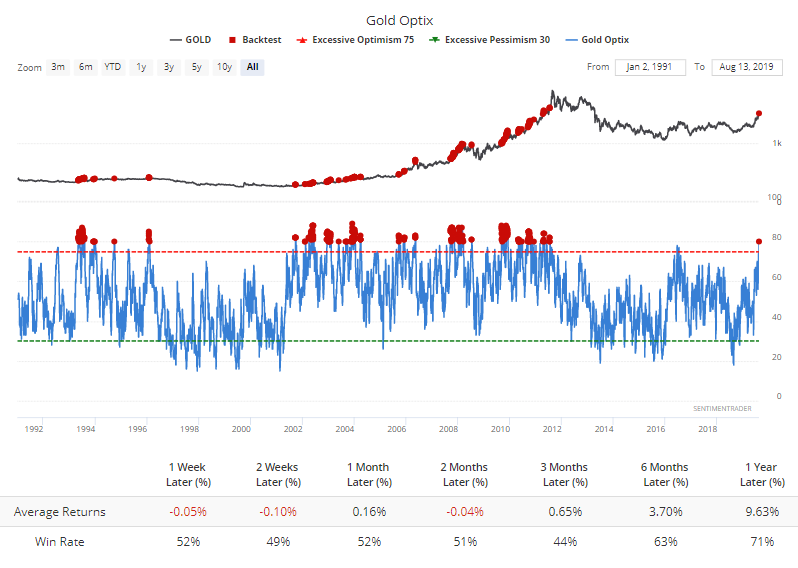
For gold, there is some fodder for the "this time is different" crowed, since investors had not dared to become this optimistic at any other point since the metal peaked 8 years ago. And when they did, gold's returns were not good, but not terrible either, since it triggered multiple times during parabolic rallies.
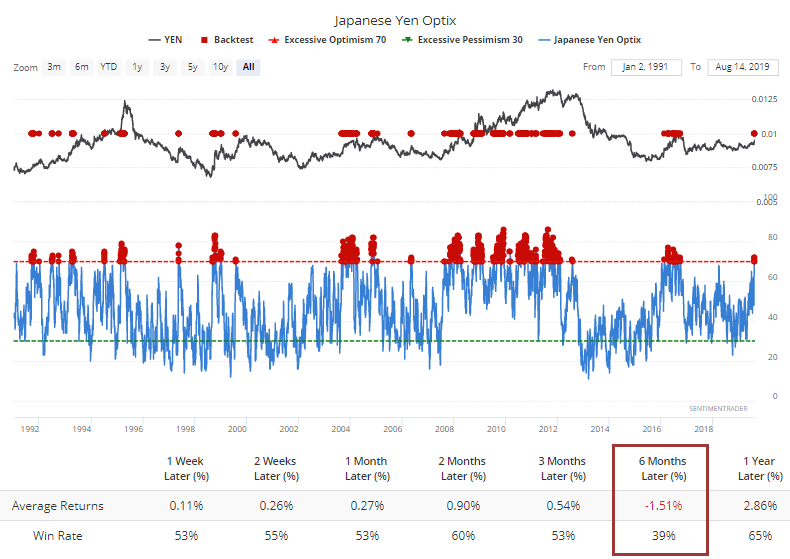
For the yen, only 6-month returns were significantly below random (sorry, because of the scale the dots aren't displaying correctly).
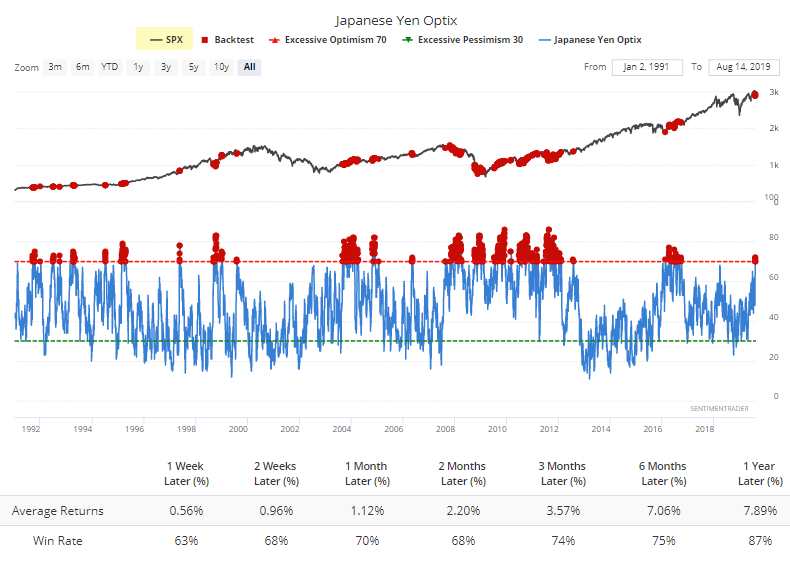
Interestingly, these bouts of optimism in the yen often coincided with pessimism in stocks, leading to decent returns for the S&P.
More Swings
With yet another big move today, this marks the S&P 500 futures 11th consecutive day with an intraday swing of more than +/- 1%. That's the longest since early January, and it had been 3 years prior to that since traders had pushed stocks around so much.
Historically, the outcome of this volatility was binary - either it marked the peak (or nearly so) of uncertainty, or it fed on itself resulting in a bear market.
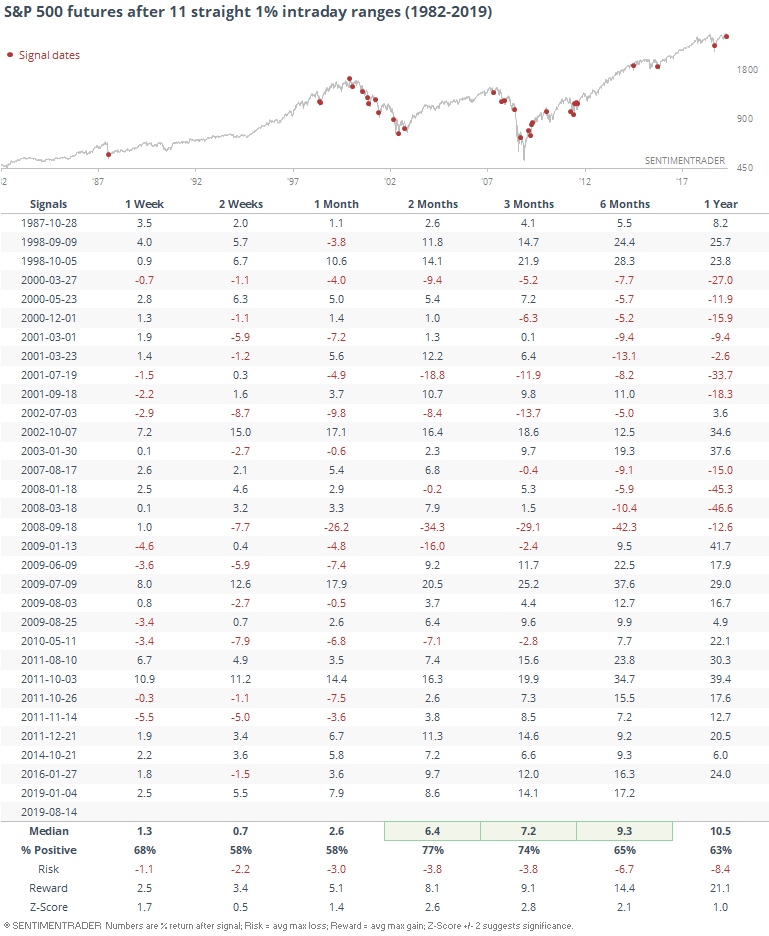
Surprisingly, even considering that many of these triggering during the last two protracted bear markets, the futures rallied over the next 2-3 months most of the time.
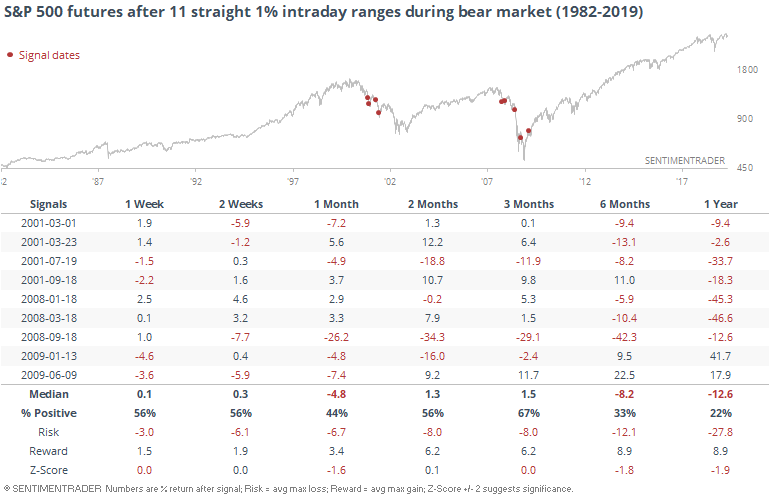
If we only look at Ned Davis Research-defined bear market instances, we can see that returns weren't terrible over that time frame.
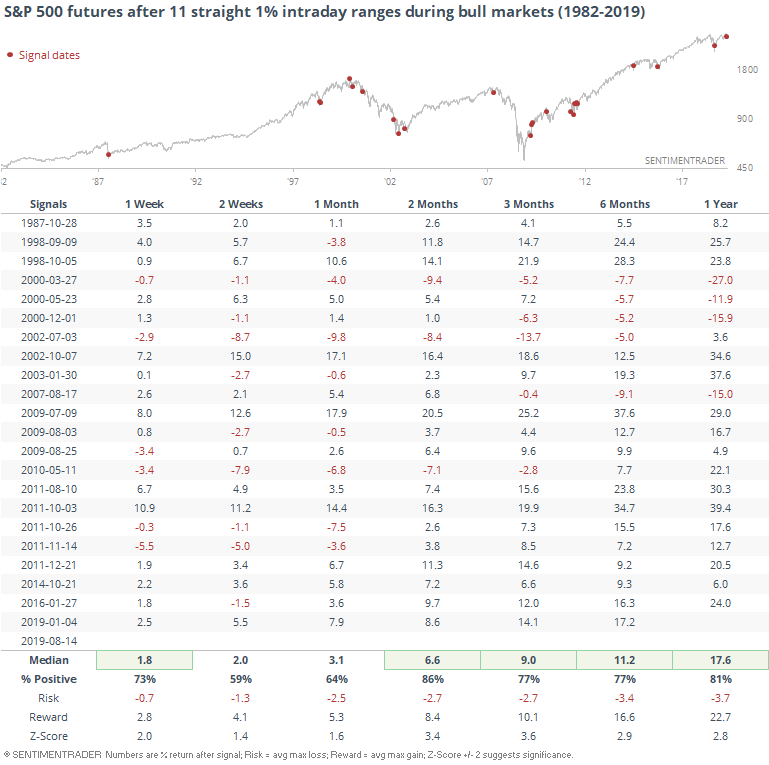
It's not surprising that when this happened during bull markets, returns were significantly better.
Fear Rising
According to Bloomberg, options traders are becoming nervous. The skew between puts and calls is starting to blow out, meaning traders are willing to pay up for the protection of put options.
It hasn't just been the past few sessions that have triggered this, though. The skew has been relatively high for the last couple of weeks. The 10-day average is now the highest since February 2018.
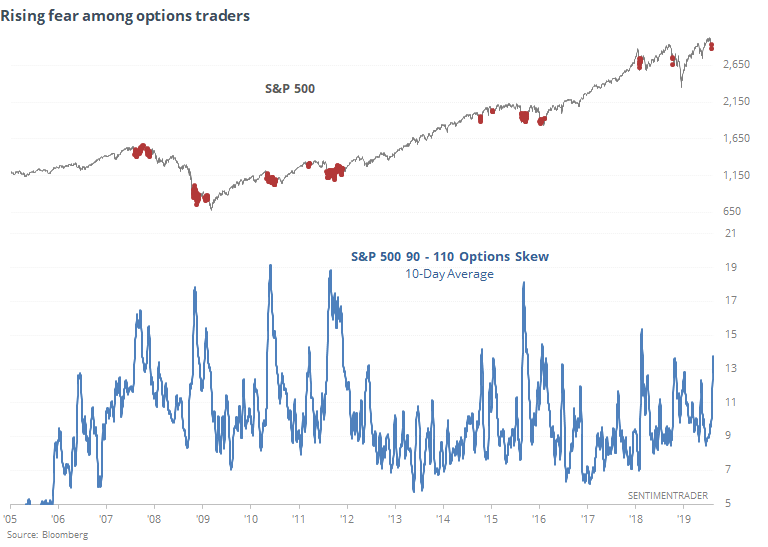
A high skew did not prevent further losses last fall, or in 2007. But generally, we only saw readings like this during times of extreme duress that typically resulted in higher prices. The fear traders are building into the pricing of options has not often worked out in their favor over the medium-term.
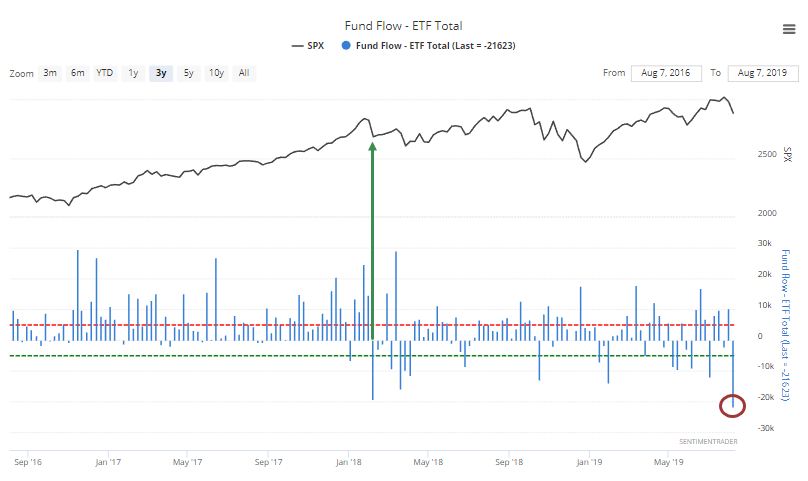
Interestingly, the last time that skew was this high - February 2018 - was the last time traders yanked nearly $20 billion out of equity ETFs. Last week, they surpassed that, pulling out the most in history according to the ICI.