Wednesday Color - Everything Rallies, Bond Flow and Vol, Within 1%, Energy, France

Here's what's piquing my interest on this waiting-for-the-Fed day.
Everything Rallies
Tuesday provided some interesting cross-currents, allowing assets to rise that normally provide some balance to each other. It was a bad day to be short pretty much anything - stocks, bonds, the dollar, gold, oil, whatever. They all rose, and by more than a little.
There is some risk that activity like this is bubblicious, especially with stocks so close to their highs. But it hasn't been that much of a worry. It triggered before the '87 crash and again at the top of the 2000 bubble, but otherwise it was mostly fake news.
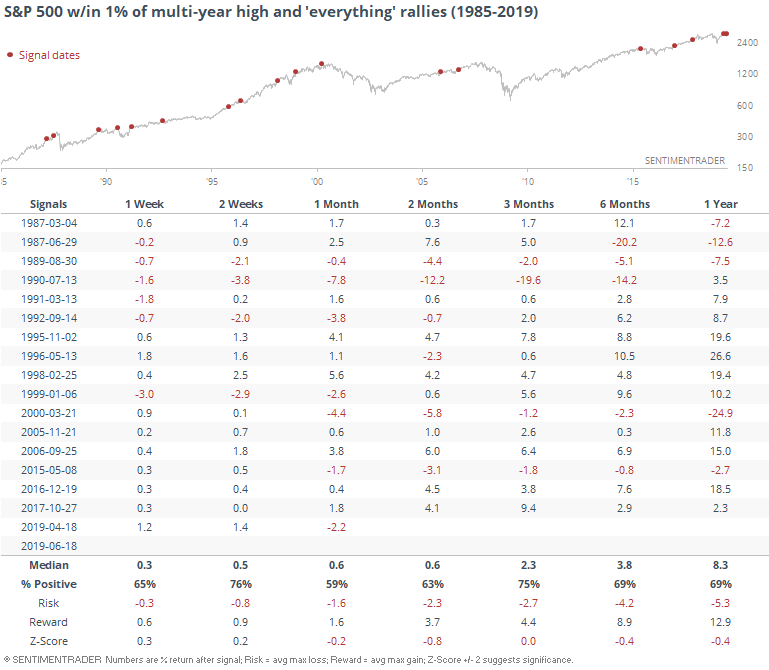
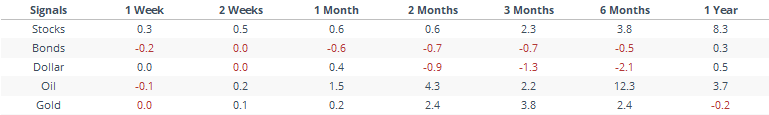
Stocks tended to be one of the better-performing assets after these "everything" rallies.
Bond Flows
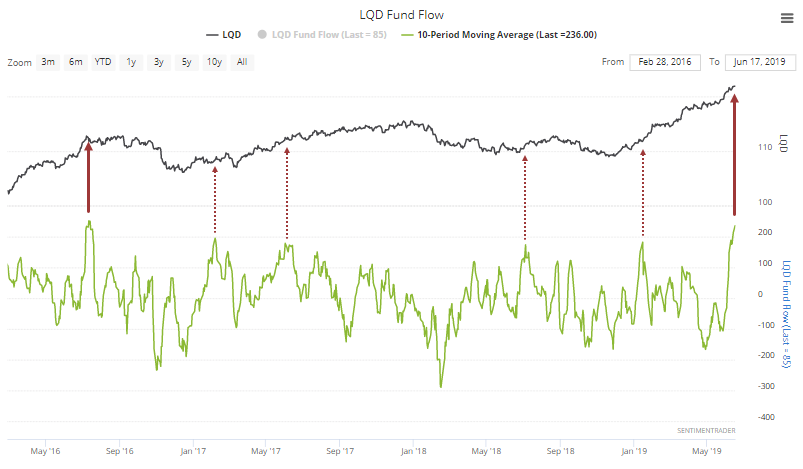
We've already touched on this a few times, but the money pouring into the investment-grade corporate bond fund LQD just won't stop. It has taken in an average of nearly $250 million per day for the past two weeks. The only other time in its history it enjoyed this much of an inflow was at its peak in the summer of 2016.
Lesser extremes were also less effective.
Volatility Divergence
Bond volatility continues to rocket higher, with the MOVE index hitting multiple 2-year highs in recent days. It has been self-contained in the bond market, though, as the VIX (for stocks) keeps dropping.
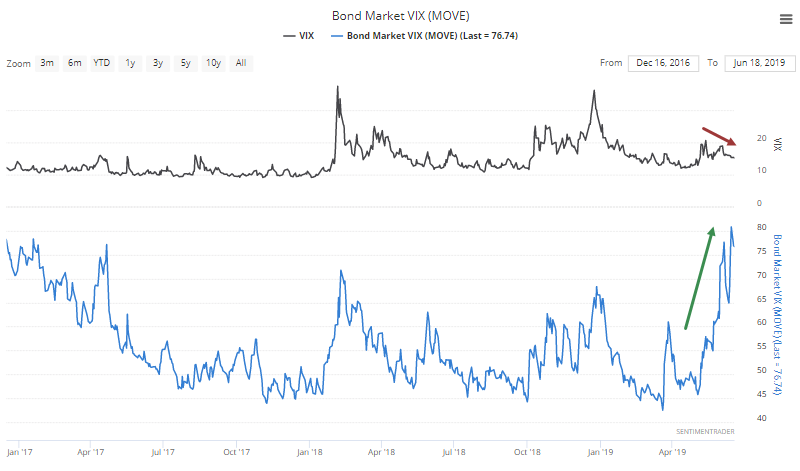
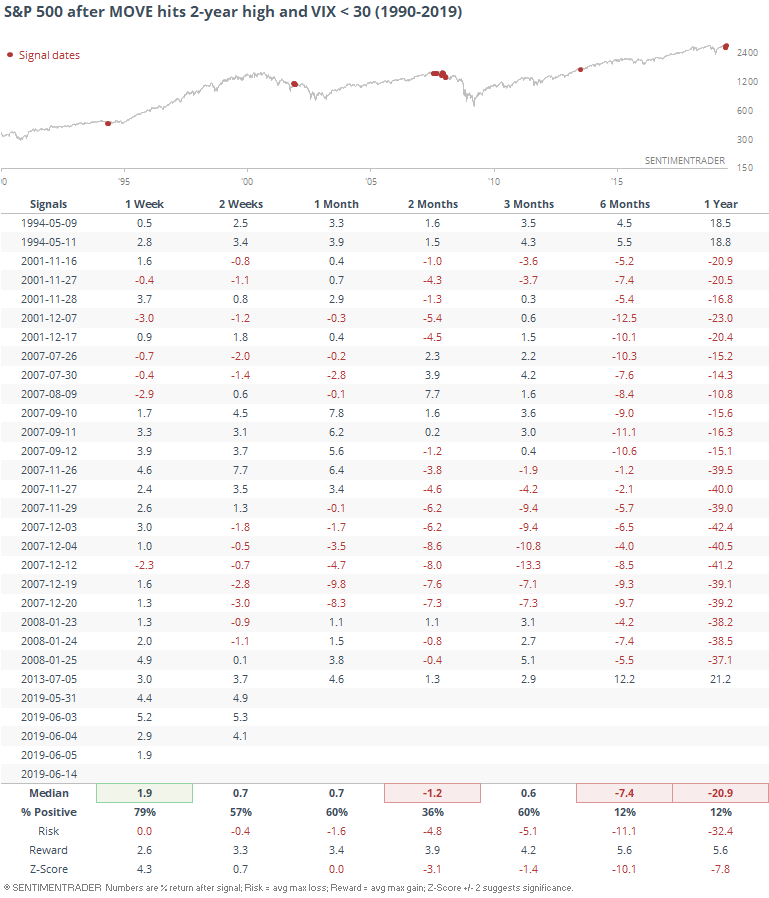
For a day when the MOVE hit a multi-year high, the recent VIX readings are the 2nd-lowest in history, behind only July 2013. That was no problem for stocks, as they powered higher going forward.
Other times the VIX was relatively subdued despite a multi-year high in the MOVE index were less sanguine. Most of these triggered in 2001 or 2007-08, so it's not a wonder the returns were questionable. Outside of those bear markets, the only precedents were that one in 2013 and another in 1994, which also preceded immediate and sustained gains for stocks.
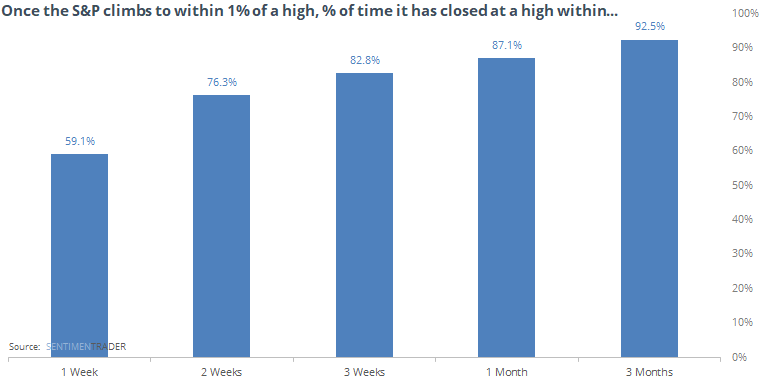
Almost There
For the first time in more than a month, the S&P 500 has climbed to within 1% of its prior peak. Historically, it has tended to achieve a new high (on a closing basis) within a week just under 60% of the time. It had a better than 3 in 4 chance to do so within two weeks.
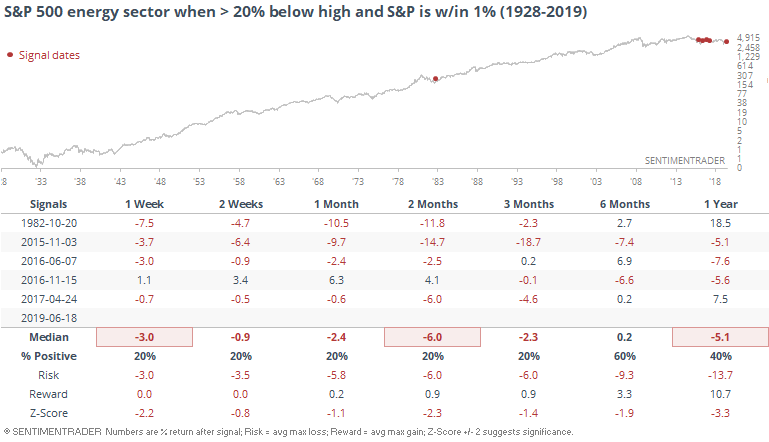
Not all new highs are created equal, with not all sectors being carried along for the ride. And this time around, energy has been sucking wind. The energy component of the S&P 500 is still in a bear market, at least if it's defined by being more than 20% off its peak.
There haven't been many times since 1928 when this happened, and for what it's worth, it didn't seem to have much of an impact on the broader S&P.
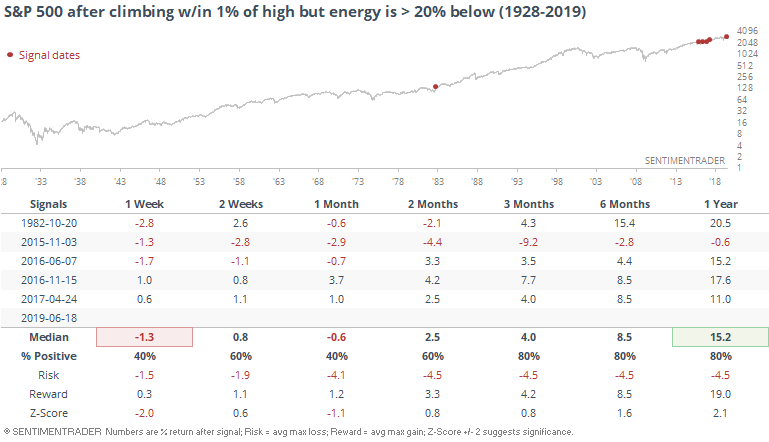
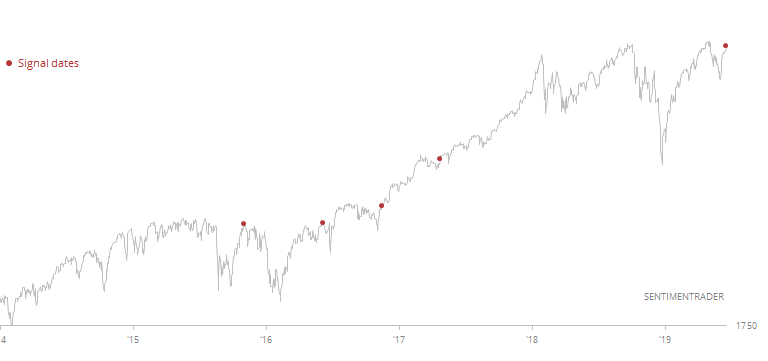
Here is a zoomed-in look at the 2015 - present window when almost all of those signals triggered.
It wasn't so good for those energy stocks, though.
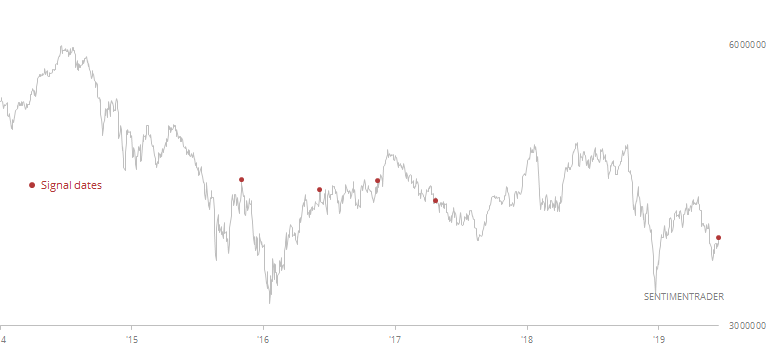
Here are the last five years.
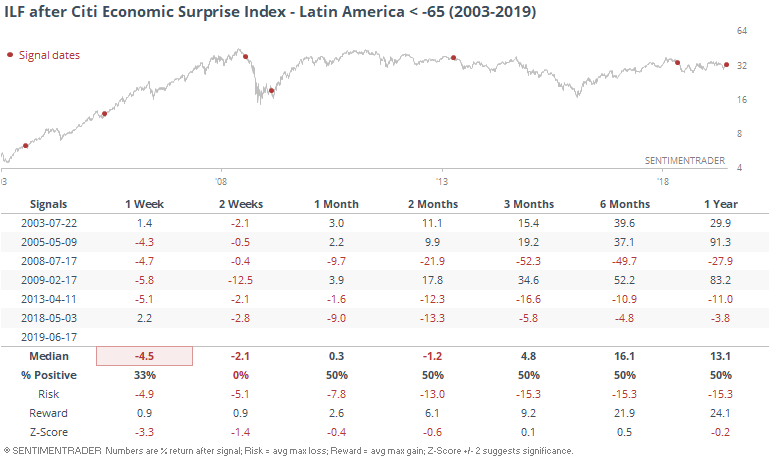
Negative Surprises Down South
The WSJ notes that among all economic surprises, the worst have been in Latin American countries. The Citi Economic Surprise Index for that region has plunged to -65, one of the worst levels in more than 15 years.
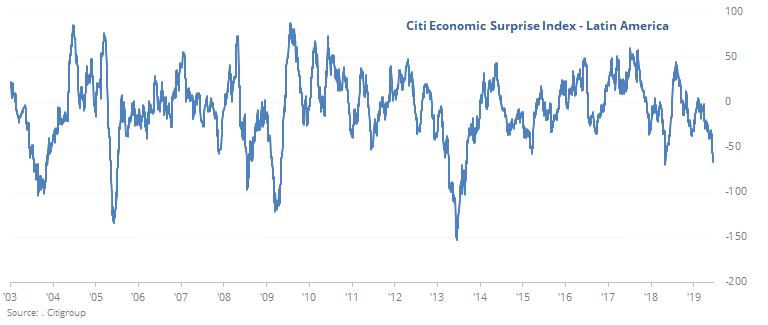
In terms of market performance, the ILF fund (iShares Latin American 40) has tended to decline in the short-term, but was mixed afterward.
Breadth Review
Despite the big move on Tuesday, there weren't (m)any new extremes among sectors or most overseas indexes. Breadth has jumped and improved considerably in many of them, but are still mostly contained within their typical ranges.
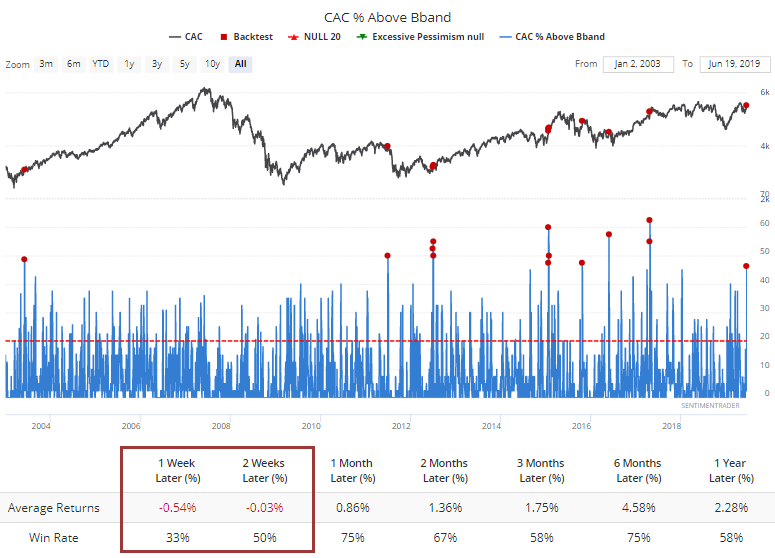
One burgeoning exception is French stocks, reacting to a reduction in protests and potential prospects for more market-friendly measures. The CAC 40 is seeing nearly every one of its members trading above their short-term moving averages now. That's the 2nd-most in nearly 3 years.
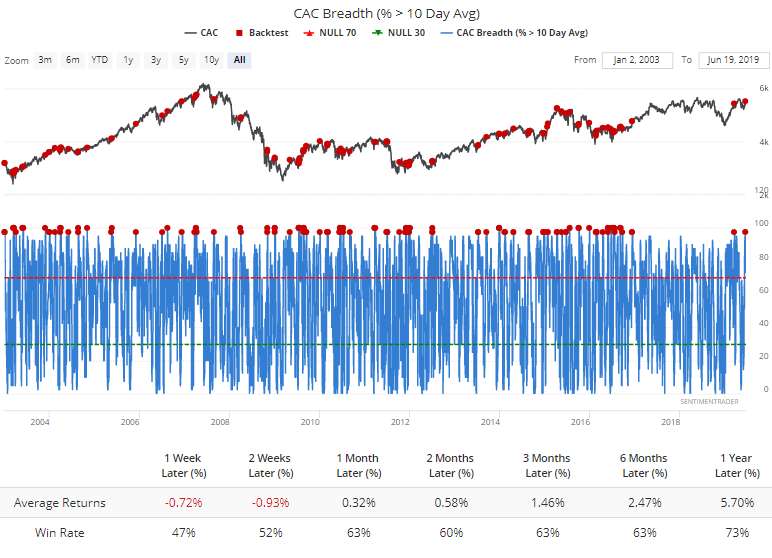
Other surges like this led to some shorter-term weakness, but not beyond two weeks.
More notably, more than 45% of stocks in the index jumped above their upper volatility bands. This has more consistently led to shorter-term weakness, but also more consistently to longer-term gains, highlighting times when there was a sudden and widespread increase in interest from buyers.