
Weak Dollar, Strong Commodities

Key Points:
- The U.S. dollar continues to weaken while commodity prices continue to strengthen
- Historically, in similar situations, commodities maintained upward momentum in the medium term
- For the U.S. dollar, after such extreme depreciation signals appeared in history, it has rarely been able to quickly stop falling and stabilize in the short term
The Divergence Between the U.S. Dollar and Commodities
Among all the current macro market anomalies, one of the most striking phenomena is that as the U.S. dollar continues to weaken, commodity prices are experiencing an strong surge.
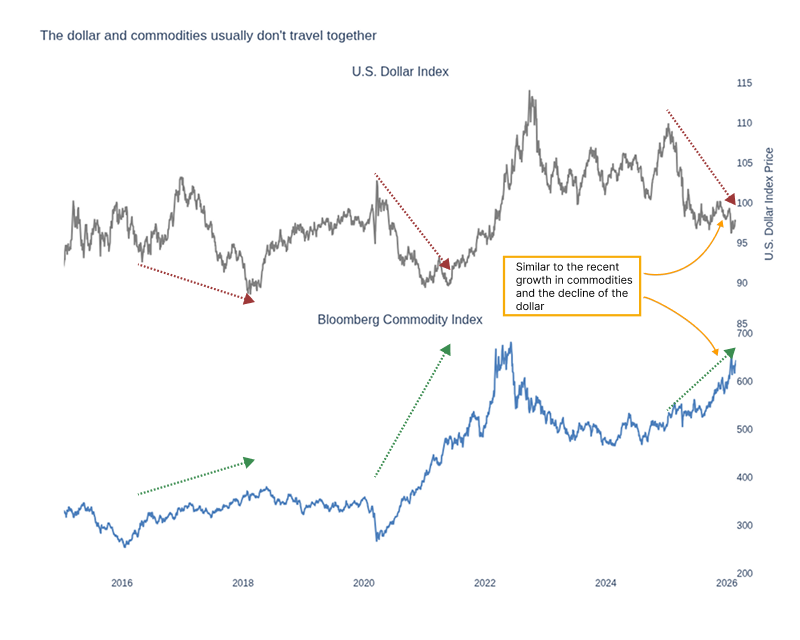
This is actually the most classic "seesaw" relationship between these two assets. Over the past few decades, a weakening U.S. dollar has usually meant rising commodity prices, and vice versa. However, such divergence momentum occurring in such a short period of time is still unusual in history, and it often heralds a major shift in the macroeconomic cycle.
Asset Performance Under Such Circumstances
Dating back to 1971, instances where the U.S. Dollar Index fell by at least 2% while the Bloomberg Commodity Spot Index (BCOMSP) surged by at least 10% within a 90-day rolling period are rare. After applying a 60-trading-day cooling-off period for signal de-duplication, there have been only 43 independent macro trigger points in total.
For the U.S. dollar, historical data reveals that after this signal is triggered, the currency often struggles to quickly arrest its decline and stabilize. Related Backtest Click Here.
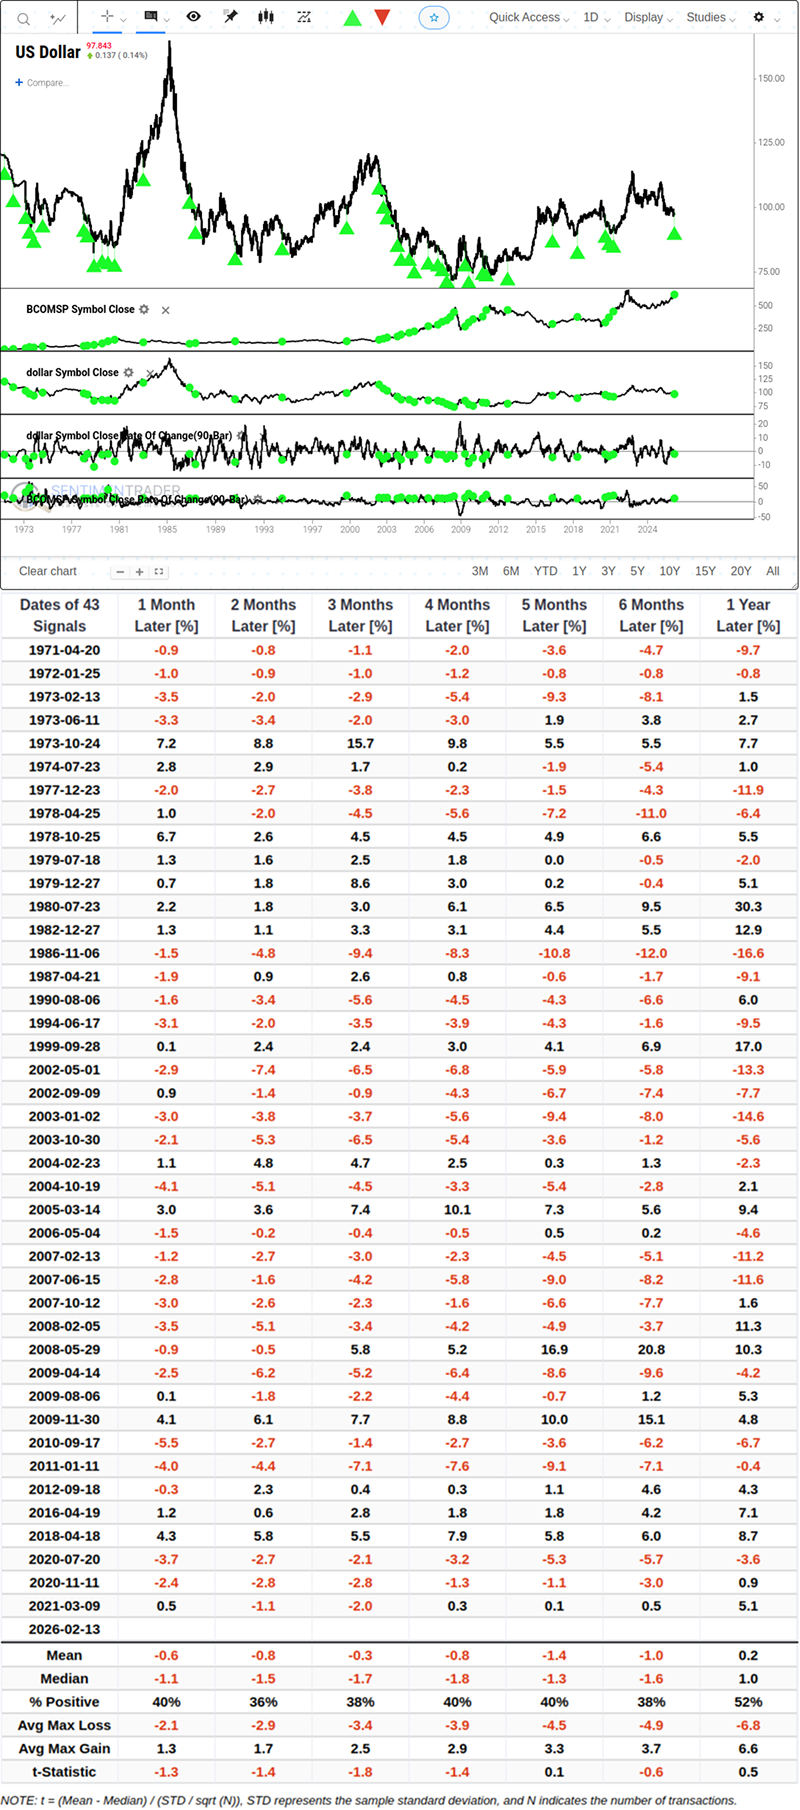
Throughout the subsequent 1 to 6 months, the dollar's performance tends to remain weak, with the win rate of gains hovering merely between 36% and 40%. This implies that the market requires an exceptionally long time to fully digest this downward trend.
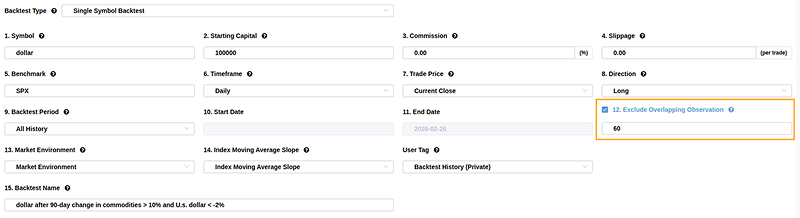
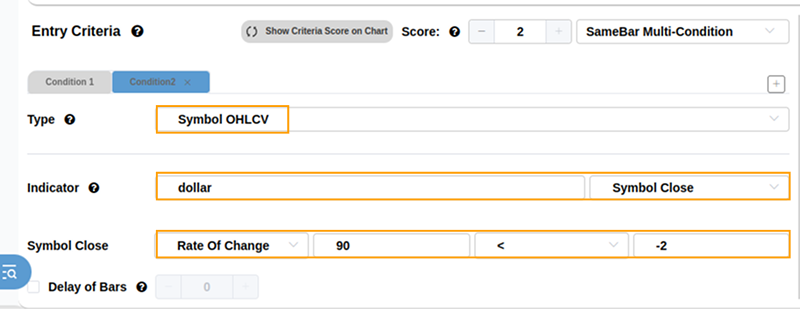
You can replicate signal retrieval under identical conditions in our backtesting engine using the following settings, including the cooldown period and multiple conditions triggering simultaneously as signals.
Follow this to set cooldown:
And follow this to set multi conditions:
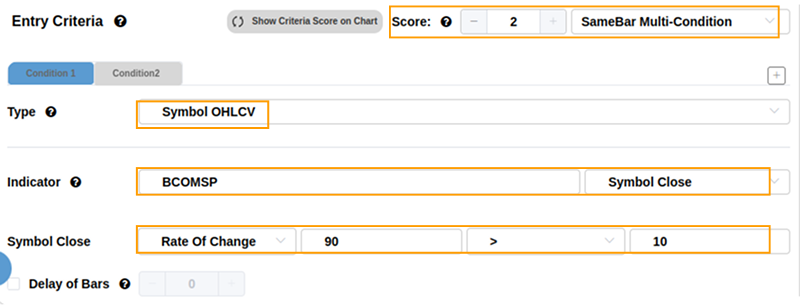
Conversely, for commodities, the situation is completely different. Once this momentum ignites, it typically embodies the principle of "the strong get stronger."
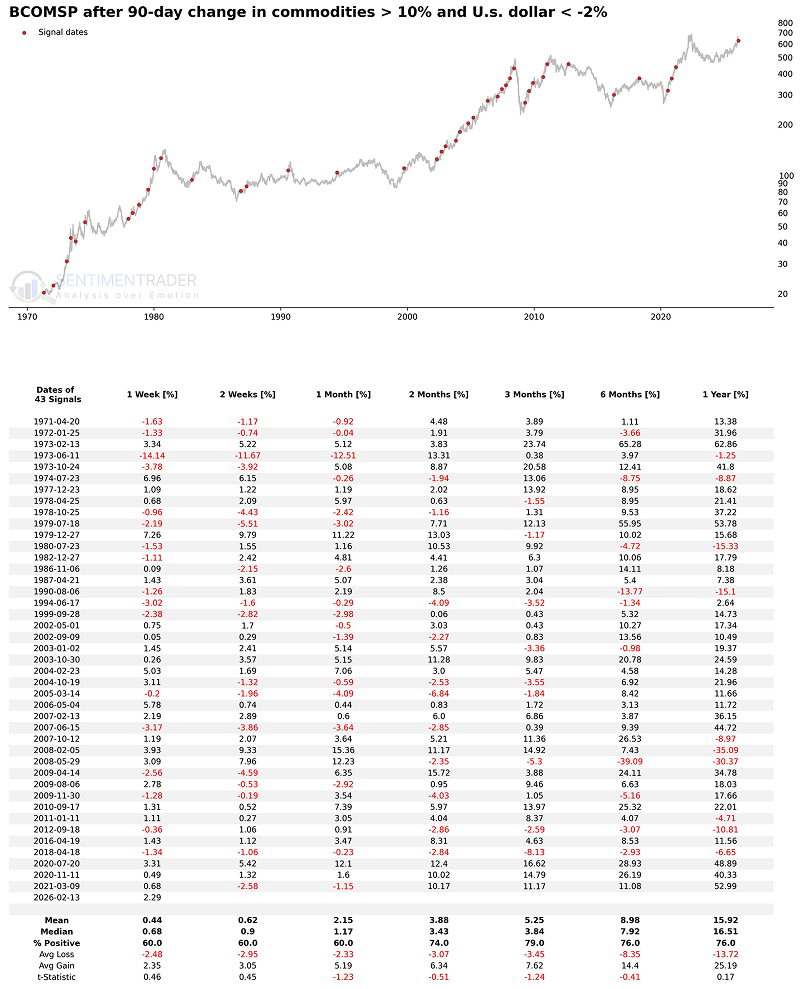
The data demonstrates that commodities usually do not undergo immediate mean reversion following this trigger. Instead, they display considerable upward continuity in the ensuing months. Over the next 3 months, the commodity index rose 79% of the time, generating an average return of 5.25%. Even when extending the horizon to 6 months, the win rate remained remarkably high at 76%, with average returns approaching 9%.
It is worth noting with caution that this combination of "weak dollar + strong commodities" poses a certain degree of spillover risk to the stock market.
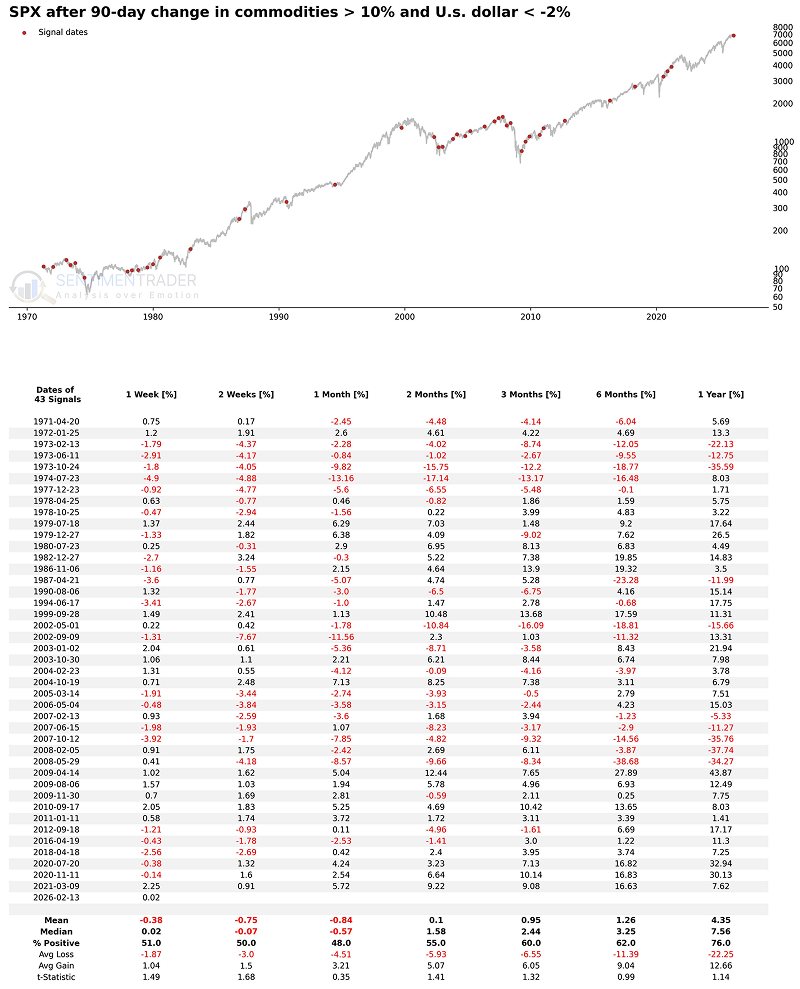
After the U.S. dollar and commodities show such extreme trends, the S&P 500 Index often encounters "inflation pain." Within 1 month after the signal is triggered, the probability of U.S. stock gains fell below half (only 48%), with an average return negative. Although in the following 3 to 6 months, U.S. stocks usually can usher in a phased repair, and from a 1-year macro perspective, the win rate of the broader market's gains remains as high as 76%. However, historical data shows that when there is an endogenous risk of the macro environment slipping into substantial stagflation, it often faces the risk of relatively large pullbacks.
What the Research Tells Us…
The next few weeks should give us a better understanding of the fate divergence of major asset classes. Usually, when commodities rise sharply regardless of everything like recently, investors' asset allocation in the coming weeks will largely reflect their concerns about "inflation stickiness." If U.S. Treasury yields soar in sync with commodities, and investors continue to sell the U.S. dollar and hoard hard assets, then the situation for U.S. equity bulls lacking earnings support may become extremely difficult in the coming months.
Past performance does not represent future results. All historical backtest data, statistical laws, and market deductions in this article are based on specific sample intervals and assumptions, and have inherent limitations. Changes in market environment, macro policies, industrial chain structure, technological changes and other factors may cause the past statistical laws to deviate significantly or even fail completely in the future.