
We are back in "Risk On" territory

Key points
- Favorable indicator signals should be thought of as "weight of the evidence" and not as automatic "buy signals"
- Still, when a variety of typically reliable indicators generate favorable signals within a short time, it often signifies a buying opportunity for stocks
- Our Risk Appetite Index and the relationship between high beta and high quality stocks recently flashed "risk on" signals
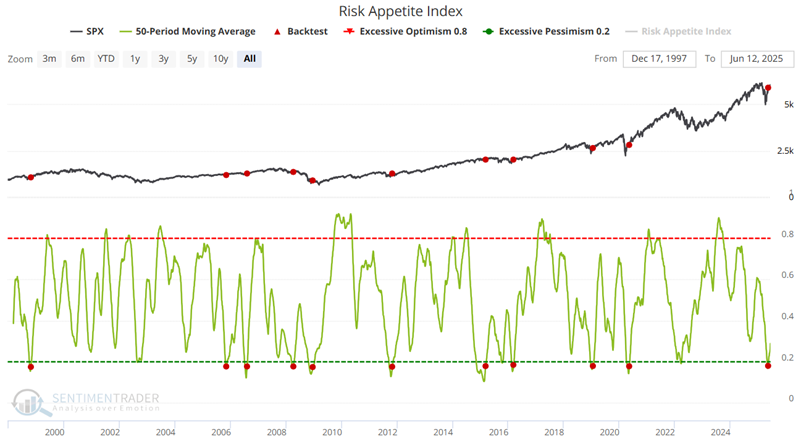
The Risk Appetite Index crossed a significant level
Human nature never changes, especially regarding making and losing money. When the market falls, investors become more fearful and lose their risk appetite. This creates an opportunity for individuals who know what to look for. While there are many potential applications, we will focus on one using our Risk Appetite Index indicator.
The chart below highlights each date when the 50-day average of the Risk Appetite Index crossed above 0.175. Of course, this requires the moving average to first drop below 0.175. A significant market sell-off typically plays out to push the 50-day average this low. However, instead of trying to "pick the bottom," we simply wait for the 50-day average to reverse higher and cross above 0.175. The most recent signal occurred on 2025-05-13.
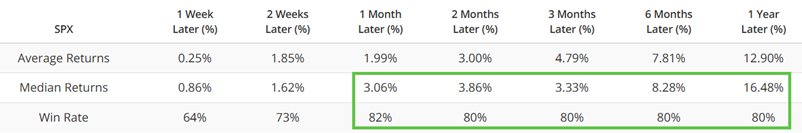
The table below summarizes subsequent S&P 500 performance following a signal.
The table below displays signal-by-signal results.
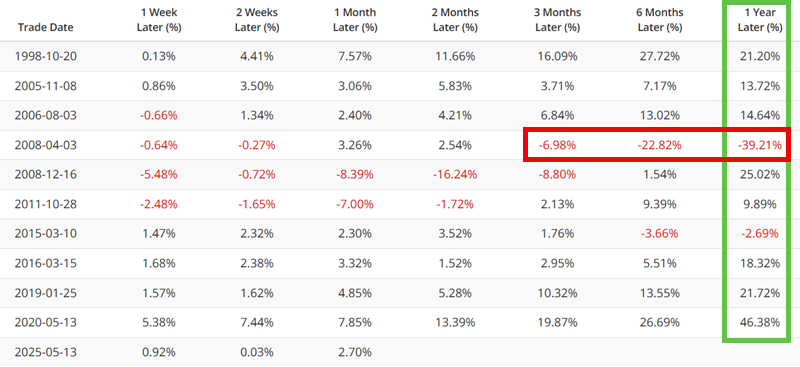
Like most indicator signals, this one is far from perfect. The massive decline following the April 2008 signal reminds us that a) this should be viewed as weight of the evidence rather than as an automatic trading signal generator, and b) investors must always have a plan for dealing with risk.
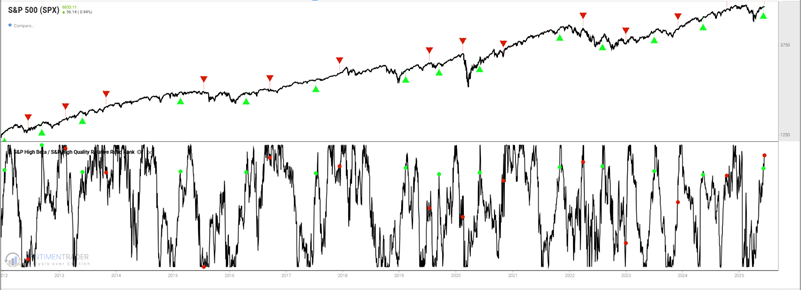
The relationship between high beta and high quality also indicates "risk on" behavior
The S&P High Beta / S&P High Quality Relative Ratio Rank indicator shows where the ratio is relative to its range over the past four months. When the relative ratio is high, investors are showing risk-on behavior. When the ratio drops to a low level, they exhibit risk-off behavior.
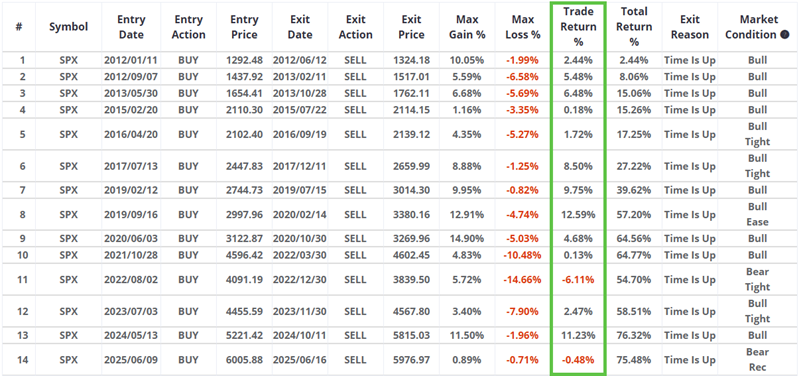
The chart below highlights those dates when the indicator dropped below five and then crossed above 75. The most recent signal occurred on 2025-06-09. For our test, we use a holding period of five months (105 trading days).
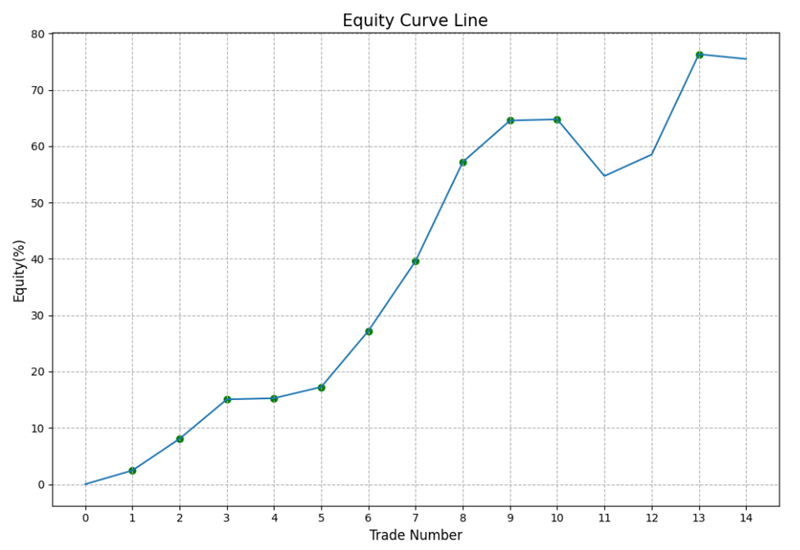
The chart below displays the hypothetical equity curve for the trades signaled in the chart above.
The table below displays signal-by-signal results for the S&P 500 index.
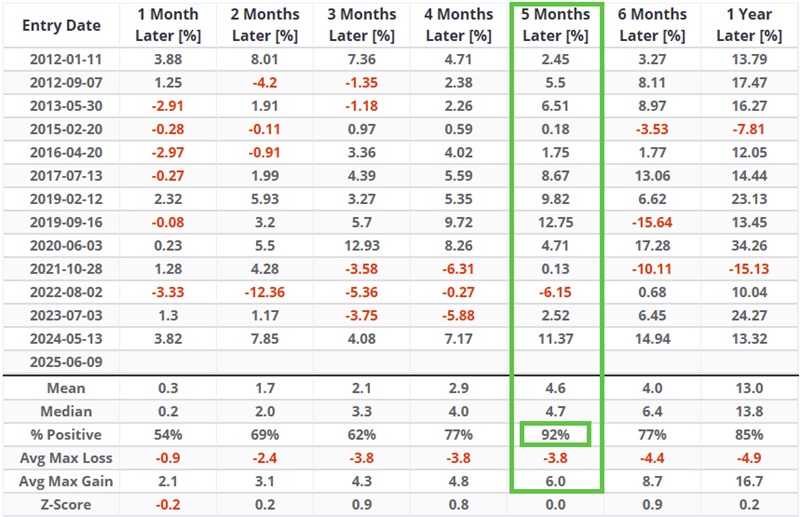
The table below summarizes S&P 500 performance for different timeframes following the dates highlighted above. Note the 92% Win Rate for positions held for five months.
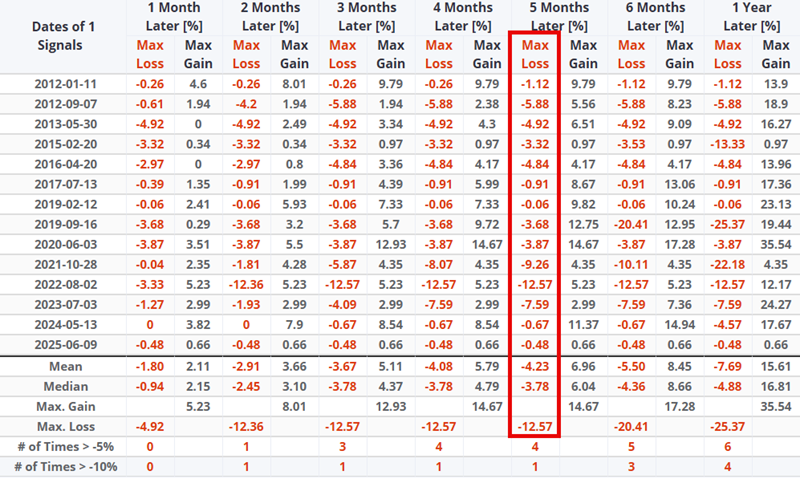
To give a sense of real-world trading expectations, the red box in the table below shows the maximum loss for the S&P 500 during the first five months after each signal. Note that the largest intra-trade decline was -12.57% in 2022, and the second largest was -9.26% in 2021.
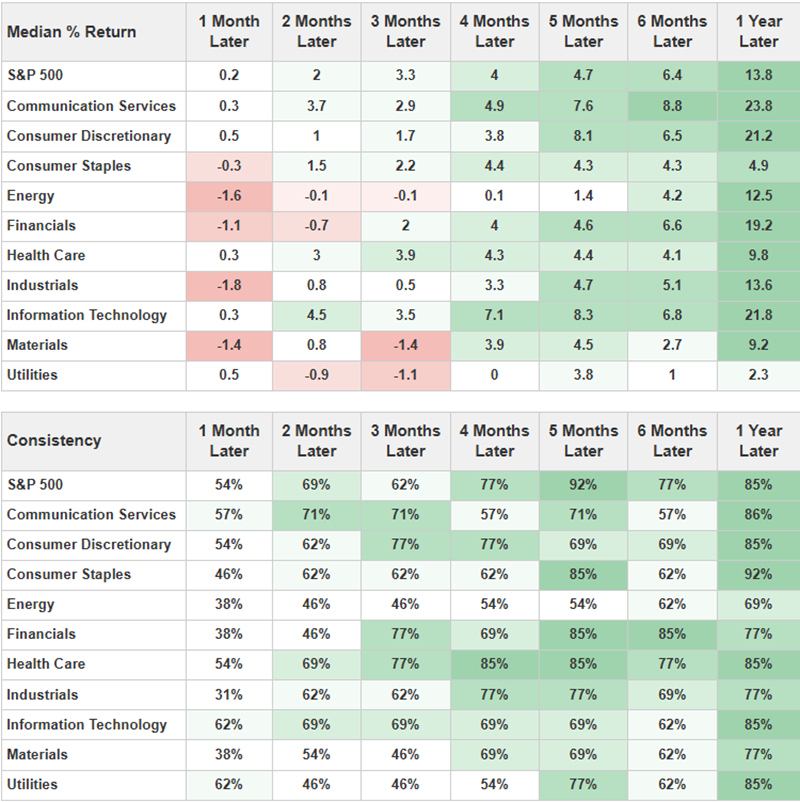
The table below displays results for the S&P 500 and the S&P 500 sectors.
What the research tells us…
Each of the indicator signals highlighted above has a solid long-term track record on a standalone basis. Combined, they offer a powerful argument that the outlook is favorable for stocks. That said, it is always important to remember that no favorable indicator - or combination of indicators -guarantees higher stock prices. Nevertheless, from a "weight of the evidence" perspective, the information above suggests giving the bullish case the benefit of the doubt unless and until price action provides us with a reason not to.