Products
SentimenTrader Trading Tools
‍
Backtest Engine
My Trading Toolkit
Correlation Analysis
Seasonality
Market Prediction
Indicators & Data API
‍
Proprietary Indicators & Charts
Market Data API
Strategies & Scanner
‍
50+ Trading Strategies
Smart Stock Scanner
Smart Option Scanner
Research Reports
‍
Research Solutions
Reports Library
Free Resources
Simple Backtest Calculator
Simple Seasonality Calculator
The Kelly Criterion Calculator
Sentiment Geo Map
Public Research Reports
Education
Sentiment Indicators
Technical Indicators
Pricing
Company
About
In the News
Testimonials
Client Success Stories
Contact
Log inLoginSign up
< BACK TO ALL REPORTS

Wavin' Wheat

Jay Kaeppel
2024-09-18
The wheat market tends to show considerable strength during the 4th quarter of the year. This tendency - combined with a nascent rally - suggests an opportunity for futures and ETF traders.

Key Points

  • Wheat tends to make several large swings within a calendar year
  • Very often, these swings adhere closely to several favorable and unfavorable seasonal periods
  • Wheat is now in the middle of one of the most favorable periods of the year

Wheat tends to show 4th quarter strength

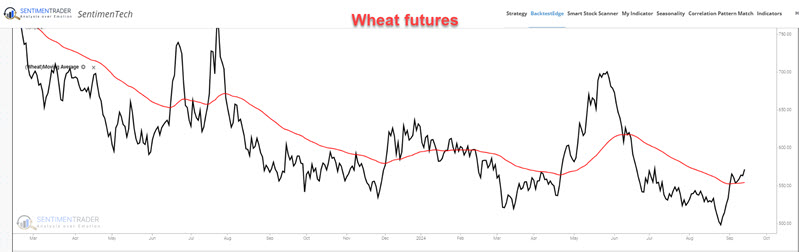
Wheat futures have bounced sharply after forming an August 2024 low. Price action has gotten back above the 70-day exponential moving average, suggesting the potential for a continued favorable trend. Is this just the beginning of a larger advance? We cannot predict. That said, the typical seasonal pattern for wheat suggests that this is a time when we should be looking for - and being prepared to act upon - favorable price action.

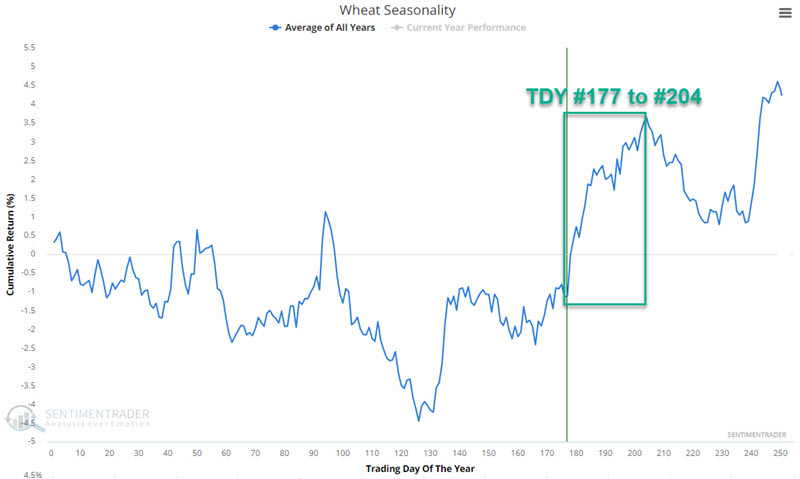
The chart below displays the annual seasonal trend for wheat futures. Note a period of seasonal strength that extends from Trading Day of the Year #177 through TDY #204. For 2024, this period extends from the close on 2024-09-13 through 2024-10-22.

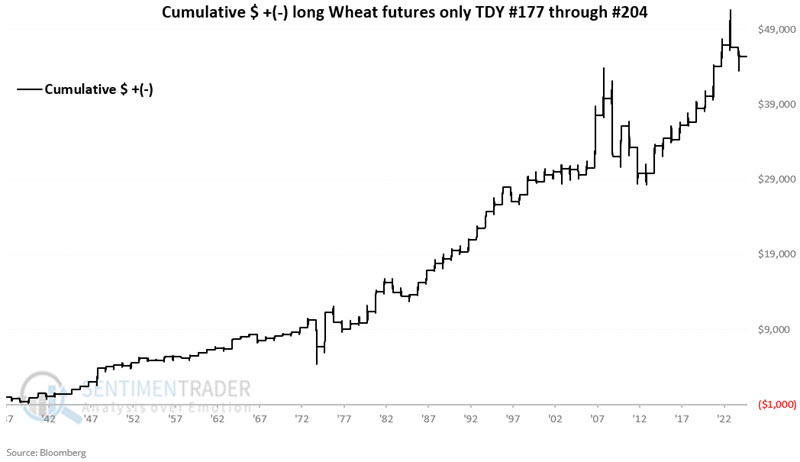
The chart below displays the hypothetical cumulative $ +(-) achieved by holding a long position in wheat futures only during the TDY #177 to TDY #204 period every year since 1937.

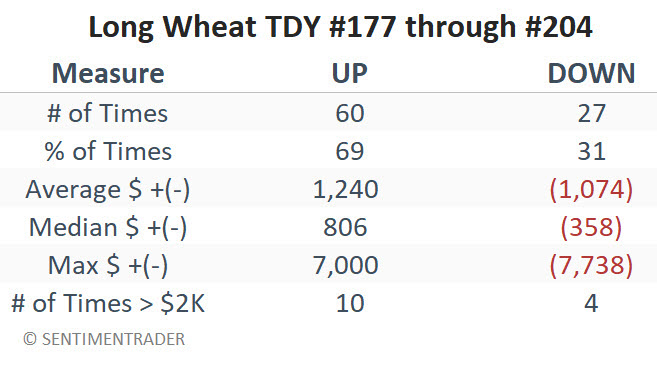
The table below summarizes wheat futures performance during this period.

An ETF alternative for non-futures traders

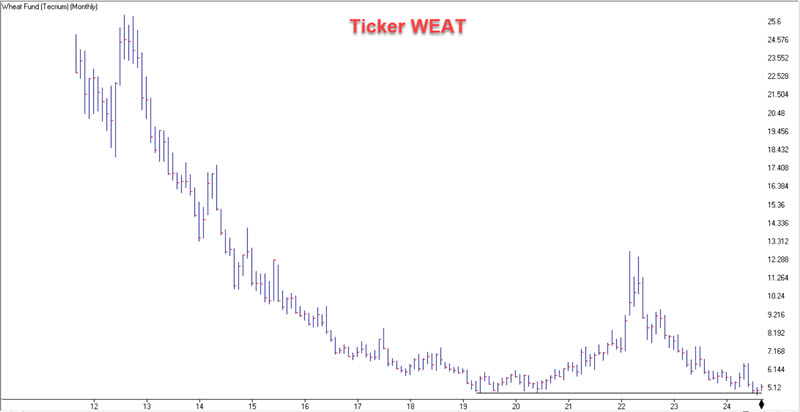
The Teucrium Wheat Fund (ticker WEAT) is an ETF that tracks wheat futures contracts. Traders can buy and sell shares of this ETF just as they would any other stock or ETF. Buying WEAT shares allows non-futures traders to participate in any advance in the price of wheat. The chart below (courtesy of AIQ TradingExpert) displays the monthly history for ticker WEAT. Note that there is a natural stop-loss point below the recent low of $4.71 a share.

What the research tells us…

Over 87 years, wheat has advanced in price 60 times, or 69% of the time, during the period we detailed above. This tells us that there is an edge if we look solely at probability. Wheat also has formed what many technical analysts might claim is a double bottom. While we cannot quantify chart patterns, the combination of a favorable seasonal trend with favorable price action and an obvious "uncle" point suggests an opportunity for traders to play the long side of wheat.

PRODUCTS
SentimenTrader
Trading Tools
Indicators & Data API
‍
Strategies & Scanner
‍
Research Reports
FREE
RESOUrCES
Simple Backtest
Calculator
Simple Seasonality
Calculator
The Kelly Criterion
Calculator
Sentiment Geo Map
‍
Public Research Reports
‍
Education
Sentiment Indicators
‍
Technical Indicators
‍
Pricing
Bundle pricing
‍
FAQ
‍
Announcements
‍
COMPANY
‍
About
‍
In the News
‍
Testimonials
‍
Client Success Stories
CONTACT
‍
General Inquiries
‍
Media Inquiries
‍
Financial Professionals Inquiries
‍
© 2026 Sundial Capital Research Inc. All rights reserved.
Setsail Marketing
TermsPrivacyAffiliate Program
Risk Disclosure: The information and tools provided are for research and analytical purposes only and are not intended as investment advice. Market analysis involves uncertainty, and outcomes may differ from expectations. Users should conduct their own due diligence and consider their individual circumstances before making any financial decisions. Past performance is not necessarily indicative of future results.

Hypothetical Performance Disclosure: Hypothetical performance results have many inherent limitations, some of which are described below. No representation is being made that any account will or is likely to achieve profits or losses similar to those shown; in fact, there are frequently sharp differences between hypothetical performance results and the actual results subsequently achieved by any particular trading program. One of the limitations of hypothetical performance results is that they are generally prepared with the benefit of hindsight. In addition, hypothetical trading does not involve financial risk, and no hypothetical trading record can completely account for the impact of financial risk of actual trading. for example, the ability to withstand losses or to adhere to a particular trading program in spite of trading losses are material points which can also adversely affect actual trading results. There are numerous other factors related to the markets in general or to the implementation of any specific trading program which cannot be fully accounted for in the preparation of hypothetical performance results and all which can adversely affect trading results.

Testimonial Disclosure: Testimonials appearing on this website may not be representative of other clients or customers and is not a guarantee of future performance or success.