
Watching the U.S. Dollar closely in Q1 2023

Key points
- The consensus opinion seems to be that the U.S. dollar topped out in late 2022
- Seasonality suggests that the dollar is not necessarily dead yet
- At least a dead-cay bounce remains a strong possibility in Q1
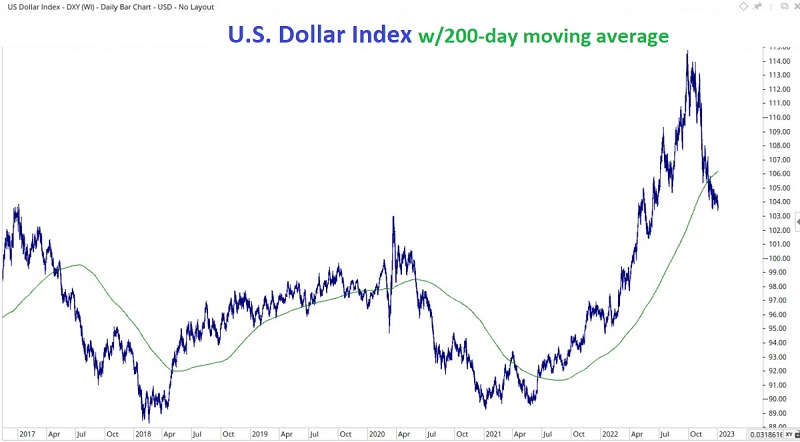
The dollar appears to have topped out
The continued strength of the U.S. dollar was one of the biggest stories in the financial markets in 2022. But that strength ran out of steam in late September, and the dollar has gotten battered ever since - finally plunging below its 200-day moving average in early December.
We are not necessarily surprised, as several indicators were suggesting potential year-ahead weakness for the dollar. Dean repeatedly highlighted the turning tide (see here, here, and here).
But in the financial markets, there is always a danger in "declaring victory" too early. While the overall outlook for the dollar remains unfavorable, the early part of the year tends to see strength.
Seasonality as a potential tailwind
The chart below displays the annual seasonal trend for the U.S. dollar. in 2022. The tendency for strength in the early part of the year is unmistakable. The seasonal trend is favorable through Trading Day of the Year (TDY) #58. Note that we track a futures contract via Bloomberg that includes all days on which trading takes place, including electronic trading on most holidays. By our calendar, the favorable seasonal period lasts through 2023-03-22.
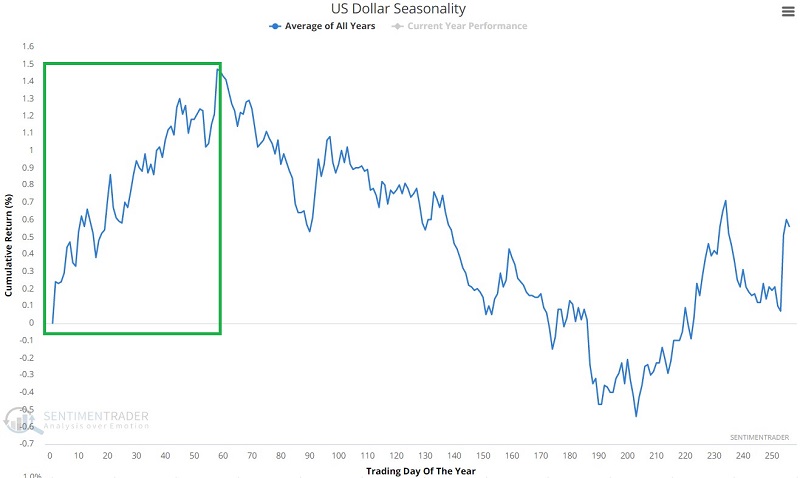
Remember that seasonal strength is by no means a sure thing. Let's take a closer look at history to highlight the possibilities.
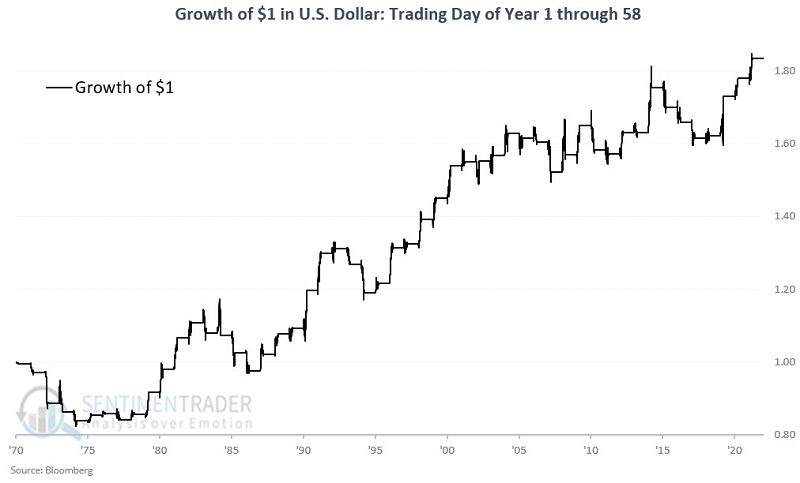
The chart below displays the growth of $1 invested in the dollar only from the close on December 31st through the close of Trading Day of Year (TDY) #58 the following year.
The table below displays a summary of performance.
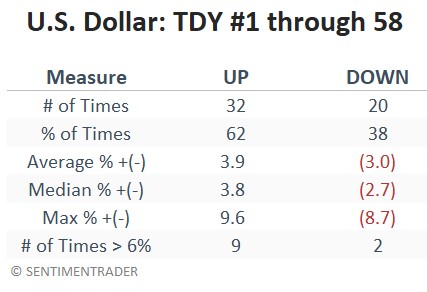
Note that the dollar has shown a gain 62% of the time. Much better than a coin flip but, obviously, no sure thing.
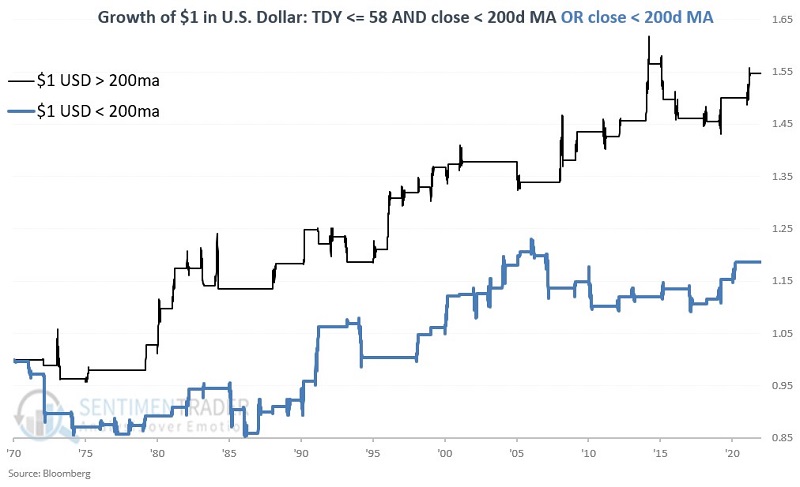
The chart below displays the growth of $1 in the U.S. dollar through TDY #58 - depending on whether the dollar is above or below its 200-day moving average. Note that while results were more robust when the dollar was above its 200-day average, results were still positive even if the dollar was below its 200-day average. So the seasonal Q1 upside bias is pervasive, regardless of price trend.
A concern as the year progresses
Just as a quick look ahead, if the dollar is trading below its 200-day moving average after TDY #58, the outlook darkens. The chart below displays the growth of $1 in the U.S. dollar only under the two following conditions:
- The Trading Day of the Year is AFTER TDY #58
- The U.S. Dollar is trading below its 200-day moving average
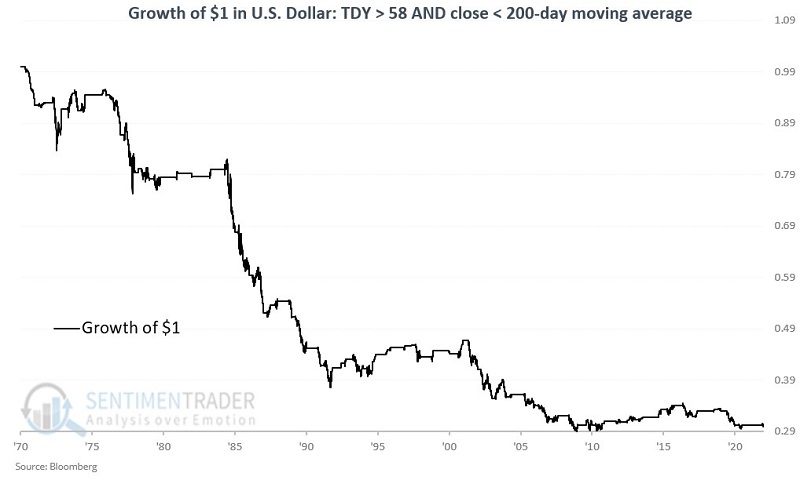
Note that the cumulative decline in value under this scenario since 1971 is -70.1%. There is an adage that states that "nothing good happens under the 200-day moving average." That certainly appears to be the case for the U.S. dollar, at least after the first quarter of the year.
What the research tells us…
In the minds of many traders, the recent uptrend in the U.S. dollar has been broken. There is good reason to believe that is the case and that the buck will weaken further in the year ahead. Nevertheless, during the first quarter of 2023, traders should be aware that the dollar could stage another attempt to move higher. Such an advance - should it happen - still holds importance for stocks, bonds, and commodities, which tend to move inversely to the U.S. dollar.