
Watching high yield bonds for stock market clues

Key points:
- The high-yield bond advance/decline line remains in a downtrend
- The number of high-yield bonds making new lows continues to outnumber those making new highs
- The outlook for the stock market will improve when either, or preferably both, of these indicators turn positive
What to look for from the High-yield advance/decline line
High-yield bonds are issued by companies with below-average credit ratings. The business prospects for these companies are often impacted by the same economic factors that affect the overall stock market.
They are also impacted by changes in interest rates - another factor that strongly influences stock market performance. As a result, the action of high-yield bonds can be a valuable harbinger of what's to come for stocks.
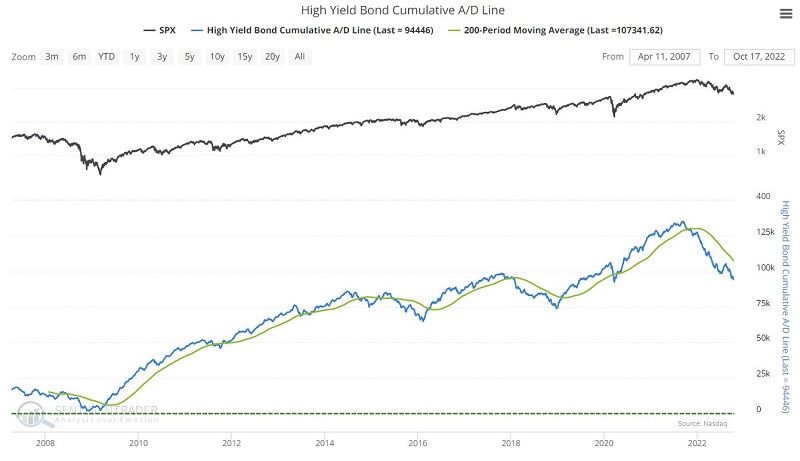
The chart below displays the High-Yield Bond Bond Cumulative A/D Line along with its 200-day moving average.
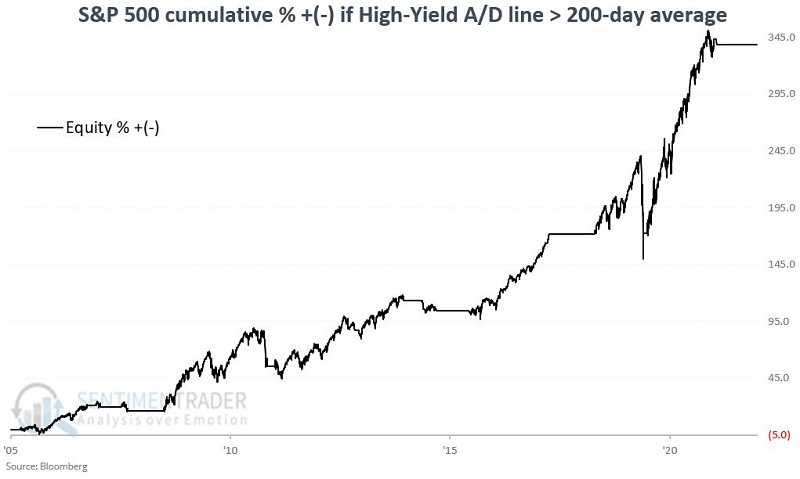
When the high-yield A/D line was above its 200-day average, the return in the S&P 500 has been impressive, returning +338.4%. Of more significant importance, note the lower-left to upper-right nature of the equity curve.
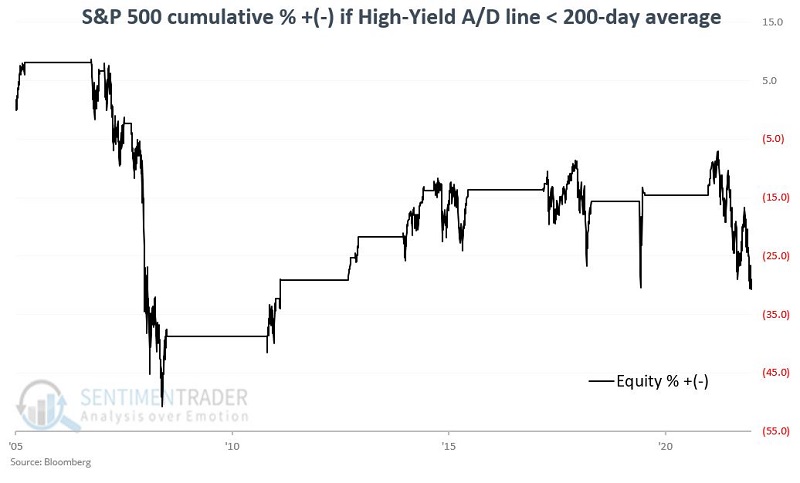
When the high-yield A/D line was below its 200-day average, the return in the S&P 500 has been miserable, returning -30.6%. During these periods, S&P returns are extremely volatile and unpredictable.
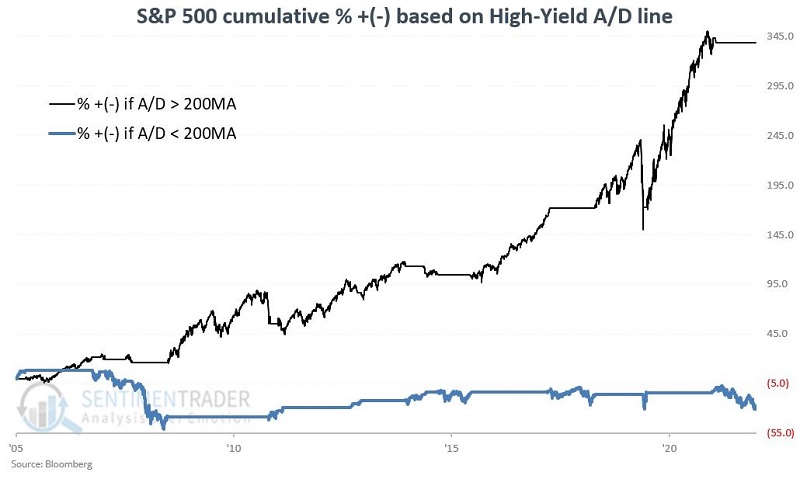
To put the results in perspective, the chart below combines the results from the previous two charts.
What to look for from the High-yield new highs/new lows
The number of high-yield bonds making new 52-week highs versus those making new 52-week lows is another useful breadth measure impacting stocks.
The chart below displays the High-Yield Bond NH - NL indicator.
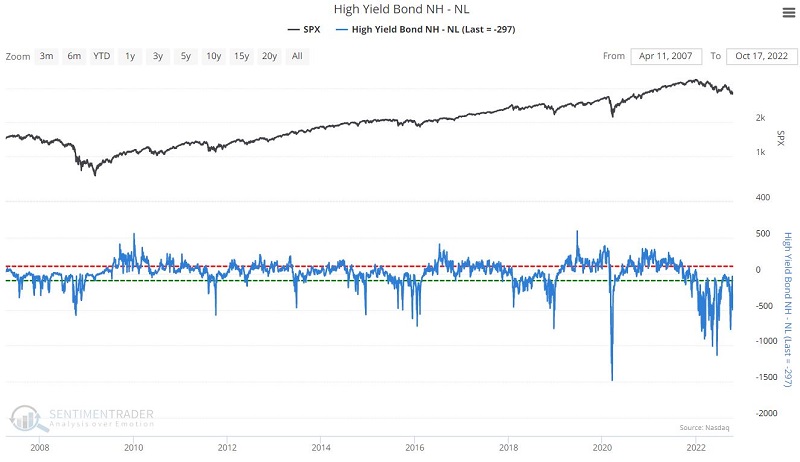
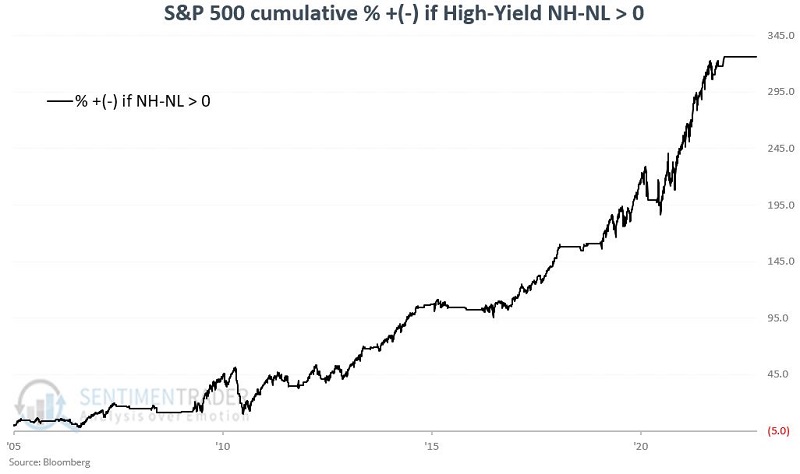
When the high-yield NH - NL indicator was above 0, the S&P 500 returned +326.0% since 2005.
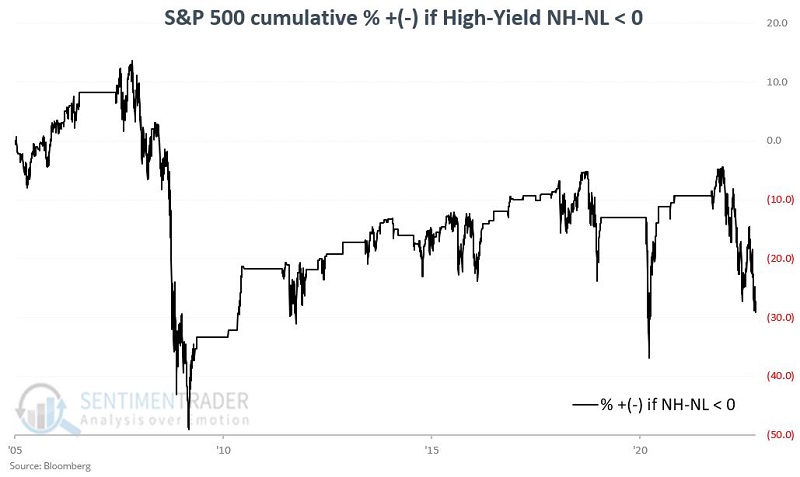
When the high-yield NH - NL indicator was below 0, the S&P 500 returned -28.9%.
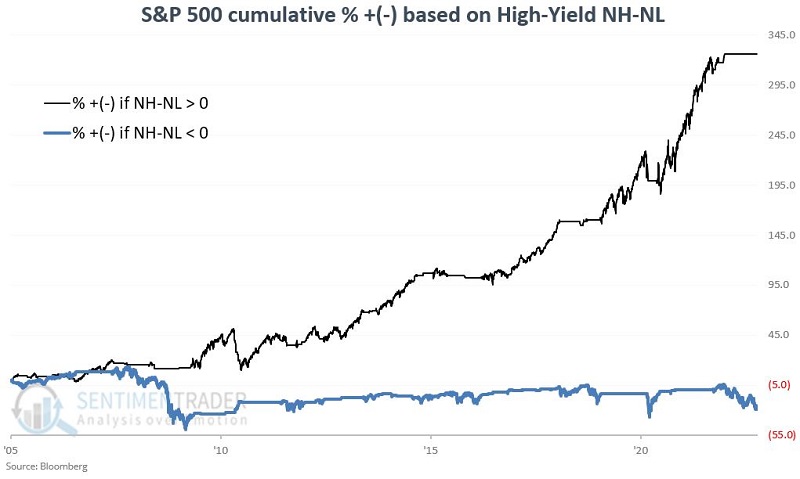
To put the results in perspective, the chart below combines the results from the previous two charts.
Combining the two indicators...
The chart below displays the cumulative percentage return for the S&P 500 if either the High-Yield Bond Bond Cumulative A/D Line is above its 200-day moving average OR the High-Yield Bond NH-NL indicator is above 0 (in black) and if both of them are below average (in blue).
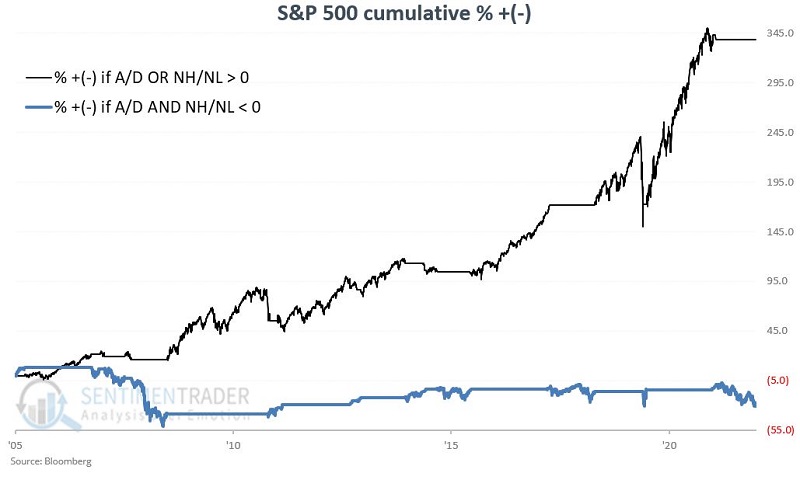
Since 2005, the S&P 500 has registered the following:
- A gain of +380.3% if EITHER indicator is bullish
- A loss of (-36.7%) if BOTH indicators are bearish
These results confirm that high-yield bond performance is a valuable confirmation indicator for stock investors.
One other indicator has already given a rare signal
Another way to analyze high-yield advance/decline data is to look at the High-Yield McClellan Oscillator. The chart below highlights those rare occasions when the High-Yield McClellan Oscillator crossed above -88 for the first time in a month, and the table summarizes performance.
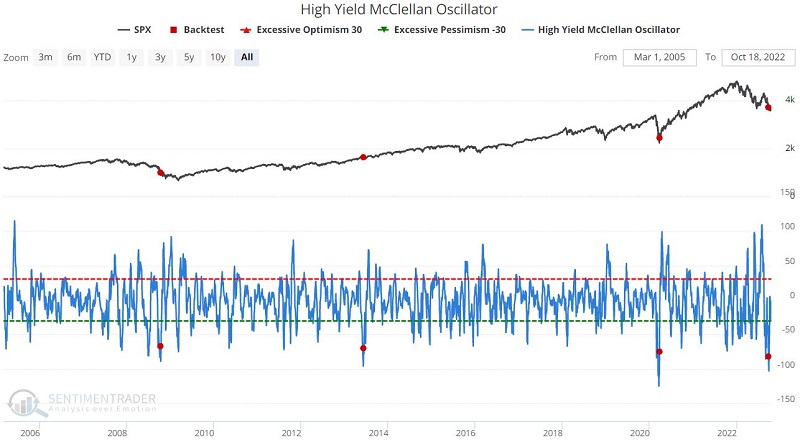
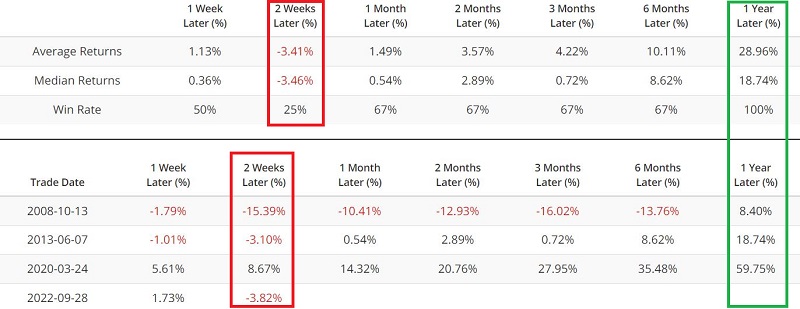
The sample size is minuscule. Still, we are talking about rare, extreme readings. Continued stock market weakness immediately following a signal is not uncommon, but twelve-month returns have been quite robust.
What the research tells us…
The recent oversold reversal by the High Yield McClellan Oscillator argues for higher stock prices in the year ahead. The confidence level in this relatively obscure signal will improve significantly when the High-Yield A/D line crosses back above its 200-day moving average and/or when the High-Yield NH-NL indicator crosses back above 0.