Products
SentimenTrader Trading Tools
‍
Backtest Engine
My Trading Toolkit
Correlation Analysis
Seasonality
Market Prediction
Indicators & Data API
‍
Proprietary Indicators & Charts
Market Data API
Strategies & Scanner
‍
50+ Trading Strategies
Smart Stock Scanner
Smart Option Scanner
Research Reports
‍
Research Solutions
Reports Library
Free Resources
Simple Backtest Calculator
Simple Seasonality Calculator
The Kelly Criterion Calculator
Sentiment Geo Map
Public Research Reports
Education
Sentiment Indicators
Technical Indicators
Pricing
Company
About
In the News
Testimonials
Client Success Stories
Contact
Log inLoginSign up
< BACK TO ALL REPORTS

Warnings spike as complacency ends

Jason Goepfert
2020-02-25
Technical warning signs have piled up over the past month. The Nasdaq 100 has relieved its overbought condition for the first time in 3 months.

Warnings spike

Monday’s selling pressure was enough to push many stocks to 52-week lows. Coming within a week of a day when 52-week highs dominated, this triggered another set of warnings.

If you can get past the silly names, and focus on what they’re saying, it’s worth noting since they’re designed to highlight periods when there is heavy turmoil underlying the mask of the indexes. While the origin of the signals include data-mining, they've been "in the wild" for decades and have been just as effective.

Hindenburg Omen and Titanic Syndrome signals

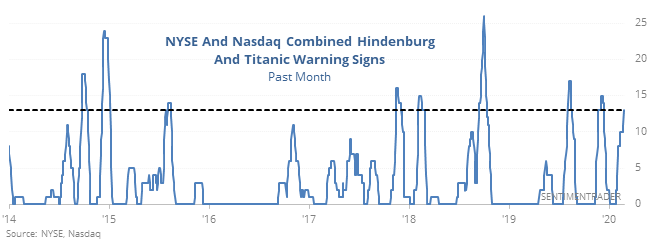
That doesn't mean they're perfect - they failed to precede any weakness in early 2017 and late 2019. But they have a long history of preceding dangerous market conditions, with poor risk relative to reward up to 6 months later.
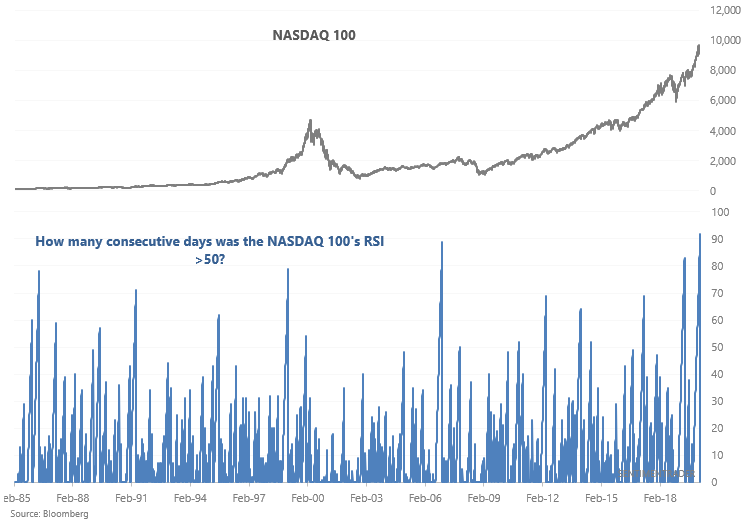

Tech's relief

Tech - a more volatile sector than the broader stock market - has ended its uptrend, at least by one definition.

Some traders use the market's RSI and whether the RSI is above or below 50 to determine trend. The NASDAQ 100's RSI is no longer above 50 after the longest streak ever above 50:

Nasdaq 100 relative strength index

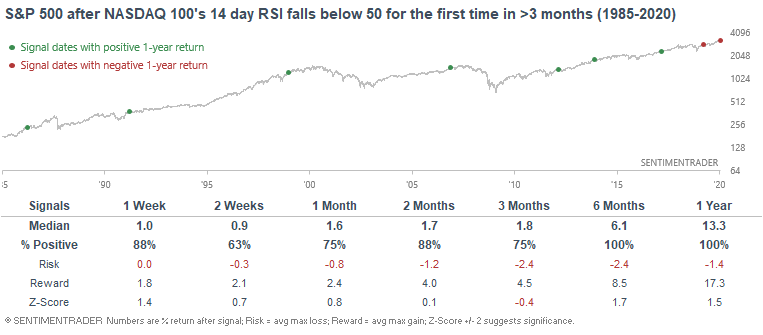
When similar streaks of bullish momentum ended, the NASDAQ 100 usually chopped sideways or fell over the next 3 months. But after that, strong momentum usually beget more gains, and it was especially positive for the broader market, defined by the S&P 500.

S&P after Nasdaq 100 no longer overbought

This is an abridged version of our recent reports and notes. For immediate access with no obligation, sign up for a 30-day free trial now.

We also looked at:

  • What happens after the largest 1-day changes in the VIX
  • The VIX Term Structure has inverted
  • The NYSE ended a streak of 6 months without a 90% down volume day
  • The S&P ended a streak of more than 90 days above its 50-day average
  • Small traders have continued to buy speculative call options
  • Last week saw a big spike in buying climaxes
  • S&P 500 stocks have seen a big jump in sell signals
  • The gold/silver ratio is spiking
PRODUCTS
SentimenTrader
Trading Tools
Indicators & Data API
‍
Strategies & Scanner
‍
Research Reports
FREE
RESOUrCES
Simple Backtest
Calculator
Simple Seasonality
Calculator
The Kelly Criterion
Calculator
Sentiment Geo Map
‍
Public Research Reports
‍
Education
Sentiment Indicators
‍
Technical Indicators
‍
Pricing
Bundle pricing
‍
FAQ
‍
Announcements
‍
COMPANY
‍
About
‍
In the News
‍
Testimonials
‍
Client Success Stories
CONTACT
‍
General Inquiries
‍
Media Inquiries
‍
Financial Professionals Inquiries
‍
© 2026 Sundial Capital Research Inc. All rights reserved.
Setsail Marketing
TermsPrivacyAffiliate Program
Risk Disclosure: The information and tools provided are for research and analytical purposes only and are not intended as investment advice. Market analysis involves uncertainty, and outcomes may differ from expectations. Users should conduct their own due diligence and consider their individual circumstances before making any financial decisions. Past performance is not necessarily indicative of future results.

Hypothetical Performance Disclosure: Hypothetical performance results have many inherent limitations, some of which are described below. No representation is being made that any account will or is likely to achieve profits or losses similar to those shown; in fact, there are frequently sharp differences between hypothetical performance results and the actual results subsequently achieved by any particular trading program. One of the limitations of hypothetical performance results is that they are generally prepared with the benefit of hindsight. In addition, hypothetical trading does not involve financial risk, and no hypothetical trading record can completely account for the impact of financial risk of actual trading. for example, the ability to withstand losses or to adhere to a particular trading program in spite of trading losses are material points which can also adversely affect actual trading results. There are numerous other factors related to the markets in general or to the implementation of any specific trading program which cannot be fully accounted for in the preparation of hypothetical performance results and all which can adversely affect trading results.

Testimonial Disclosure: Testimonials appearing on this website may not be representative of other clients or customers and is not a guarantee of future performance or success.