
Warning signs that show potential trouble out on the horizon

Key points
- The trend of most stock market indexes remains favorable
- But it is essential to keep one's eye on the horizon for signs of potential impending trouble
- Several breadth and sentiment indicators are currently flashing yellow - however, historically, these warnings tend to be early
The good news at the moment is that all major indexes - the S&P 500, Dow 30, Nasdaq 100, Russell 2000 - and several key market bellwethers - the tickers SMH (semiconductors), IYT (Transportation), XLU (Utilities), and VTI (Total U.S. Stock Market) - all remain above their respective 200-day moving average. This is the literal definition of a bull market. Any effort to paint an unfavorable picture at the moment involves "fighting the trend." This is not a path to long-term success. That said, no advance - no matter how strong - lasts forever. Warning signs tend to appear before a market top and subsequent decline. So, it is sometimes helpful to "survey the horizon" for signs of potential trouble brewing.
The Nasdaq Titanic Syndrome is flashing yellow
I highlighted the status of this indicator less than a month ago here. However, since I am highlighting potential warning signs, I have decided to mention them again in conjunction with the others covered in this piece.
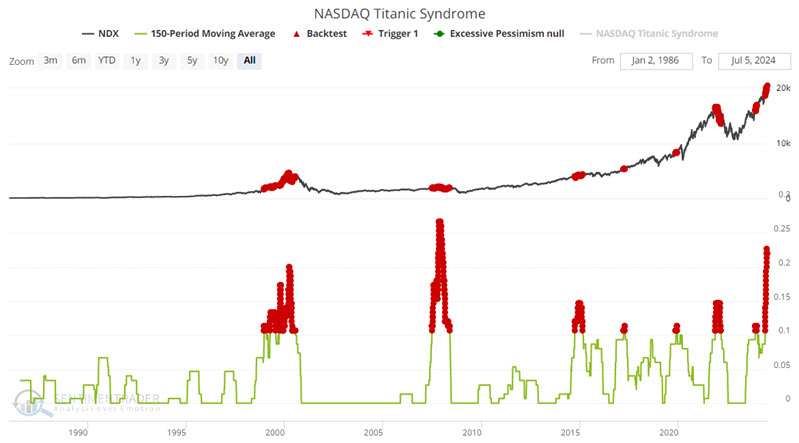
Bill Omaha created the Titanic Syndrome in the 1960s. It highlights a technical market condition when stocks have recently been at a high, and then there is a sudden jump in new 52-week lows versus highs on the Nasdaq. For our purposes, we use the following conditions: 1) The Nasdaq 100 closed at a 52-week high at some point in the past seven sessions, and 2) New 52-week lows outnumber 52-week highs on the Nasdaq. It is a warning sign that typically precedes trouble over the next 12 months. However, market performance leading up to trouble often varies widely from incident to incident.
In the tests below, we use a 150-day moving average of the Nasdaq Titanic Syndrome indicator as an alert to potentially troubling conditions in the longer term. Specifically, we are looking for days when the 150-day moving average is above 0.10. Let's be explicitly clear about what that alert says and does not say:
- This alert does not say "sell everything" or even "sell now," for that matter
- This alert does say, "There is likely to be some trouble sometime in the next twelve months, and that trouble could include a significant market decline, so be prepared to act if price action shows signs of breaking down"
The chart below highlights with a red dot each day when the 150-day moving average for the Nasdaq Titanic Syndrome indicator was 0.10 or higher.
The table below summarizes the subsequent Nasdaq 100 performance.
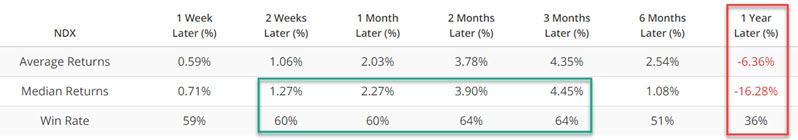
The table above shows a tendency for the Nasdaq to continue higher for several months. However, average median one-year returns have been negative. This alerts investors of the potential need to play some defense when the current trend ultimately cools off and reverses.
See the previous article for a closer look at specific Nasdaq 100 performance on an episode-by-episode basis.
Small speculators are betting heavily on the bullish side
This indicator shows the net position of small (nonreportable) traders in S&P 500, Nasdaq 100, and DJIA index futures, full contract, and e-mini, adjusted for position size and index value, shown in billions of dollars.
The current status of this indicator speaks for itself. Small speculators (typically the group that is most wrong at turning points) are betting more heavily than ever on a continued bull market. Interestingly, they have tended to be right in the past - but only for a while. And then things typically turned decidedly south.
The chart below displays when the indicator value was above 29.
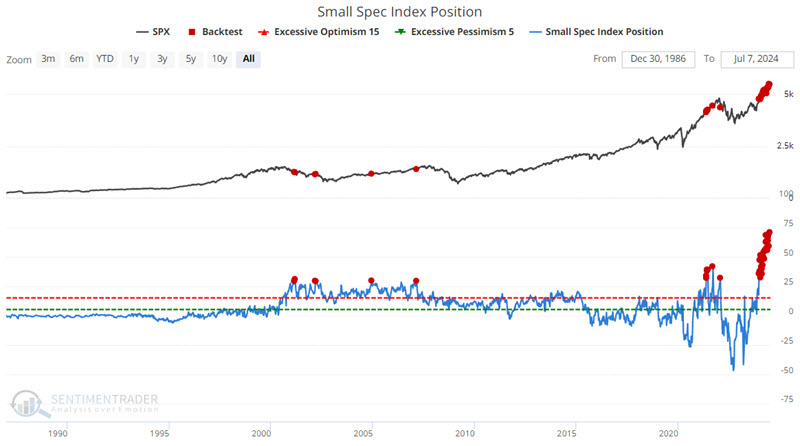
The latest cluster of heavy small spec buying is unprecedented. Intuitively, it is easy to assume that this must be highly bearish for stocks in the future. But remember that no one indicator serves as a crystal ball. The warning sign that this indicator appears to be presently flashing is just one more piece of evidence on the unfavorable side of the weight of the evidence ledger.
The table summarizes the subsequent S&P 500 performance.
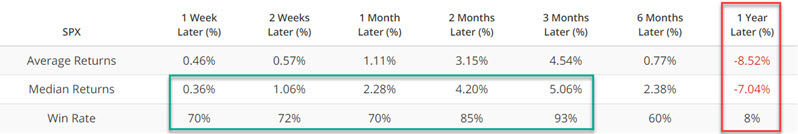
These results are pretty interesting. Three months following a signal, median returns and Win Rates are solid. The two- and three-month periods show Win Rates of 85% and 93%, respectively (note that the average Win Rates for 2- and 3-month periods for all dates are 67% and 70%, respectively). So, the current status is definitely not a "sell everything" signal. But then 1 Year returns have been decidedly unfavorable, with just an 8% Win Rate and a median return of -7.04% (note that during the test period, the average of all dates is a Win Rate of 80% and a median return of 12.17%). So, these are highly subpar results.
Nasdaq Hindenburg Omen also issued a warning sign
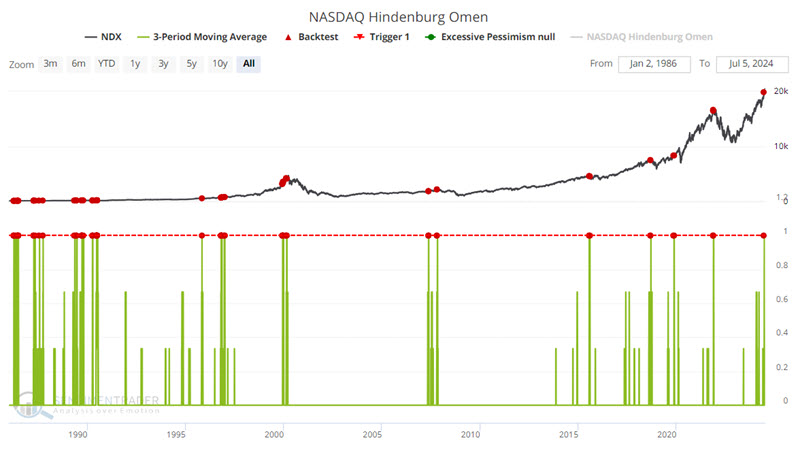
The Hindenburg Omen is a technical warning sign created by James Miekka in the 1990s, based on work from Norman Fosback in the 1970s. It monitors conditions that analysts have considered throughout history to signify potential market weakness.
For this particular signal, we use three criteria, which likely differ from other sources: 1) The Nasdaq 100 is above its 50-day moving average, 2) Both new 52-week lows and 52-week highs on the Nasdaq are greater than 2.8% of all advancing and declining issues, and 3) The Nasdaq McClellan Oscillator is negative. When the signal triggers, it highlights a "split" market, which is unhealthy. Multiple signals in a cluster are a worrying sign. Traditionally, the signal is canceled after 30 days or if the Oscillator turns positive again, though we've seen that it can lead to market trouble several months in advance.
The chart below highlights those dates when the 3-period average for the Nasdaq Hindenburg Omen is equal to 1.
The table below summarizes subsequent Nasdaq 100 Index performance.
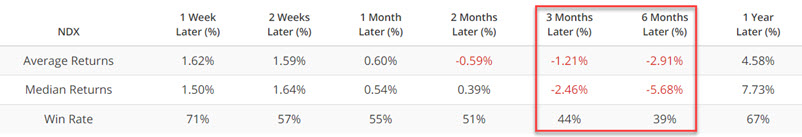
These results differ somewhat from those for the indicators above. Overall results could best be categorized as "subpar" rather than "outright bearish." That said, three and six-month returns show negative average and median results with Win Rates under 50%. On a standalone basis, one might more easily dismiss the recent warning signs from this indicator. However, combined with those above, it appears to be part of a definite (potentially unfavorable) pattern.
What the research tells us…
None of the recent indicator signals highlighted above constitutes a "world-beating" signal on their own. They each have demonstrated a decent record of highlighting subsequent subpar market results, but they each have generated some "wrong" signals along the way. Nevertheless, when taken together, they point to the potential for some significant trouble for stocks in the year ahead.
As long as all major indexes-specifically, the S&P 500, Dow 30, Nasdaq 100, Russell 2000, and the tickers SMH (semiconductors), IYT (Transportation), XLU (Utilities), and VTI (Total U.S. Stock Market)-remain above their respective 200-day moving averages, there is little reason for imminent concern. However, if some of these start to slip below their long-term moving average, it may be time for investors to consider "playing some defense" (hedging, raising some cash, etc.).