
Warning signs for gold miners

Key points
- One line of argument now says that gold is bullish, that gold stocks are undervalued, and that gold stocks could have tremendous upside
- Longer-term this could be accurate
- However, in the near term, many warning signs are flashing for gold stocks
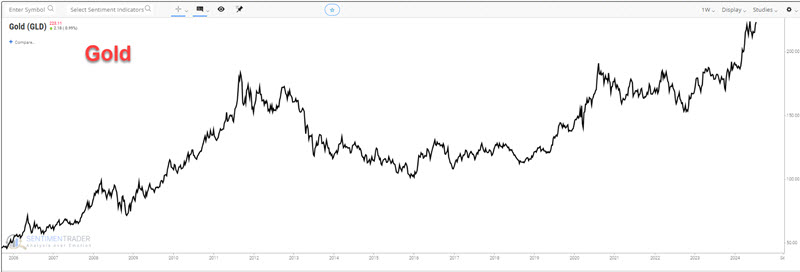
Gold is trending higher; are miners to follow suit?
The chart below shows that gold bullion has broken out to new all-time highs and still appears to be in a powerful uptrend.
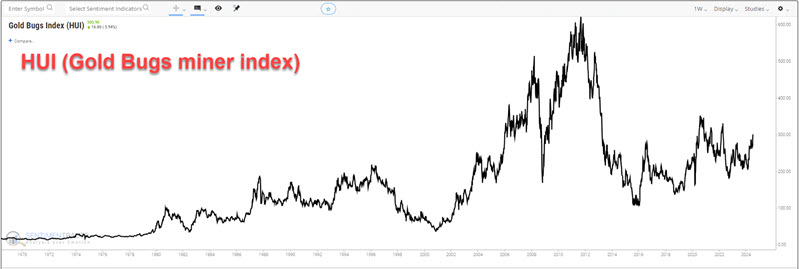
Conversely, gold mining stocks- represented by the Gold Bugs Index (ticker HUI) - are far below their all-time highs.
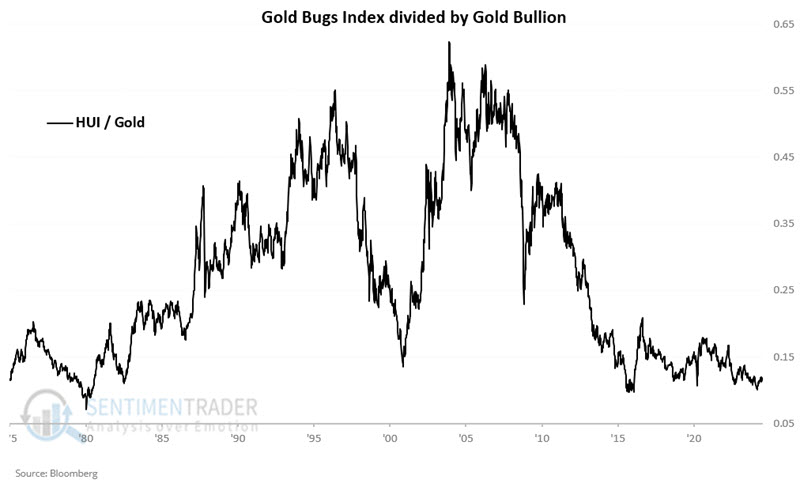
The chart below displays ticker HUI divided by the price of gold, suggesting that gold stocks are historically "undervalued" relative to gold bullion.
Many pundits have argued that investors should look for opportunities in gold stocks. The basic (and reasonable argument) is that if gold remains strong, gold stocks will eventually follow suit and "play catch-up." It is a compelling argument.
Unfortunately, several warning signs are flashing for gold stocks. If we are indeed in a new "bullish era" for precious metals, gold stocks could ignore everything that follows and still manage to power higher. But our job is not to "predict" what will happen next, only to report the "facts on the ground."
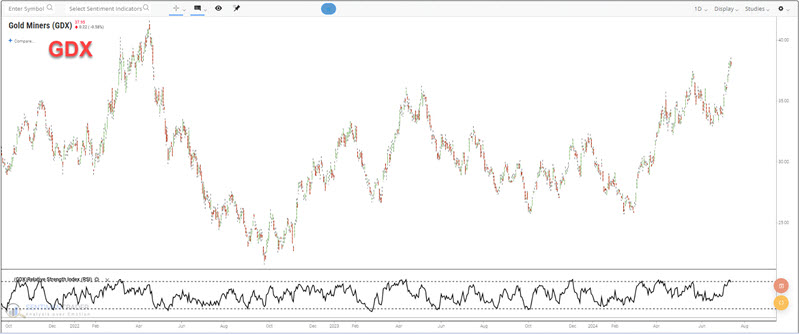
Gold stocks are already overbought
The chart below shows that the VanEck Gold Miners ETF (GDX) is already overbought. This type of action has often been followed by pullbacks ranging from major to minor.
The chart below highlights those dates when the GDX Breadth (% > 200 Day Avg) was above 94%, and the table summarizes subsequent GDX performance.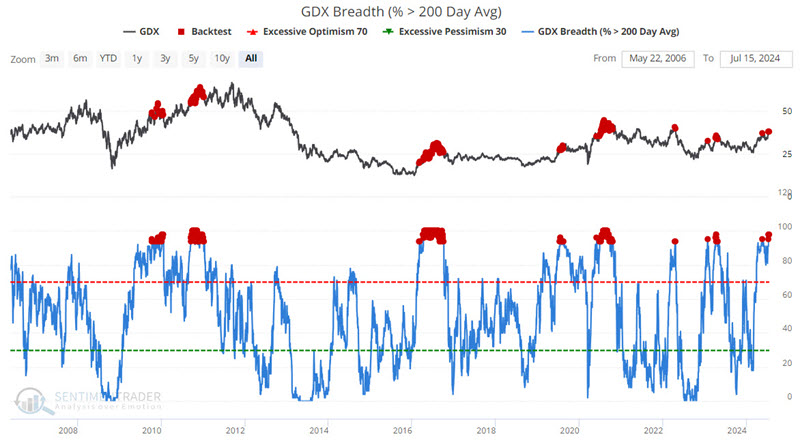
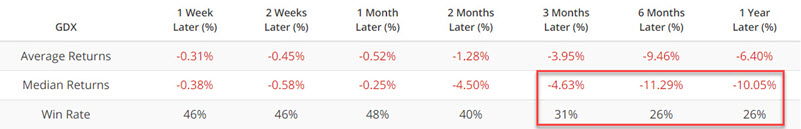
Note the abysmal Win Rates three to twelve months out.
Percentage of miners in a bear market reaches a warning level
The chart below highlights (using HUI as the underlying index) all dates when % of GDX component stocks in a bear market (i.e., 20% or more off their 52-week high) crossed below 5%.
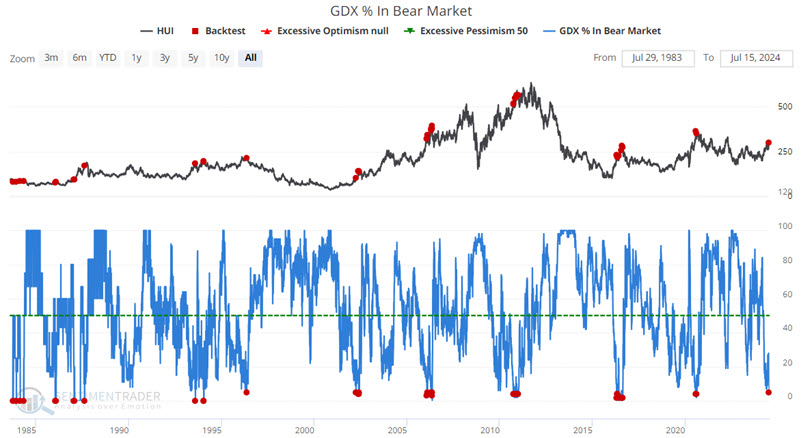
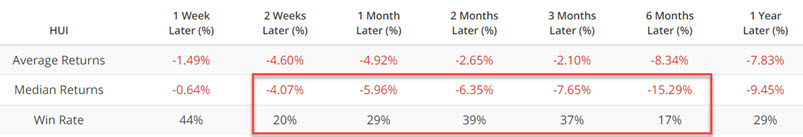
These signals have tended to witness highly subpar Win Rates two weeks to twelve months out, as shown below.
Seasonality is entering an unfavorable period
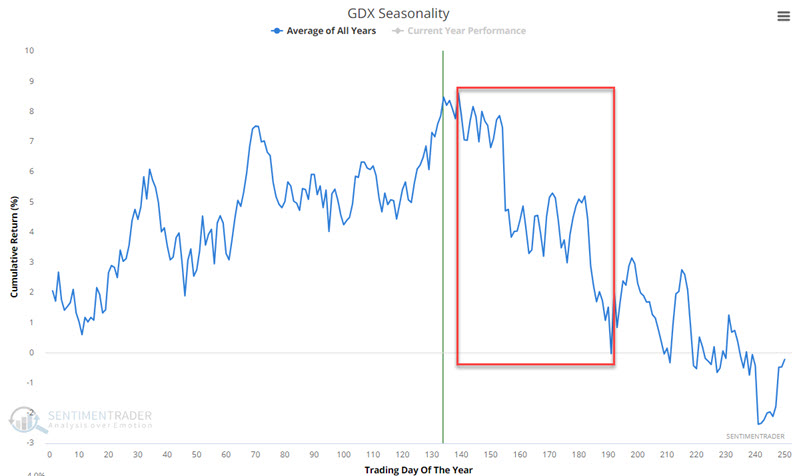
The chart below displays the annual seasonal trend for ticker GDX. As always, seasonality charts are an average of past results and NOT a roadmap for what will happen next. With that caveat in mind, GDX is soon entering an unfavorable period that extends from Trading Day of Year (TDY) #139 through #191.
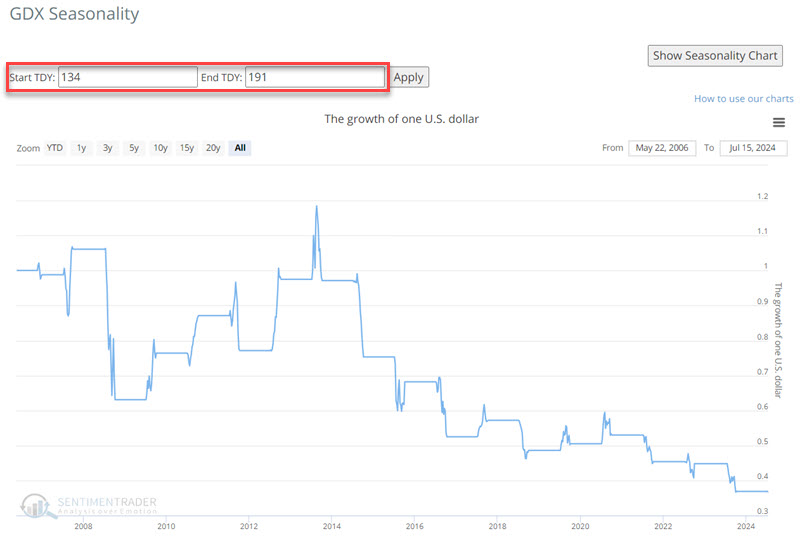
The chart below displays the hypothetical growth of $1 invested in GDX only during this period since GDX started trading.
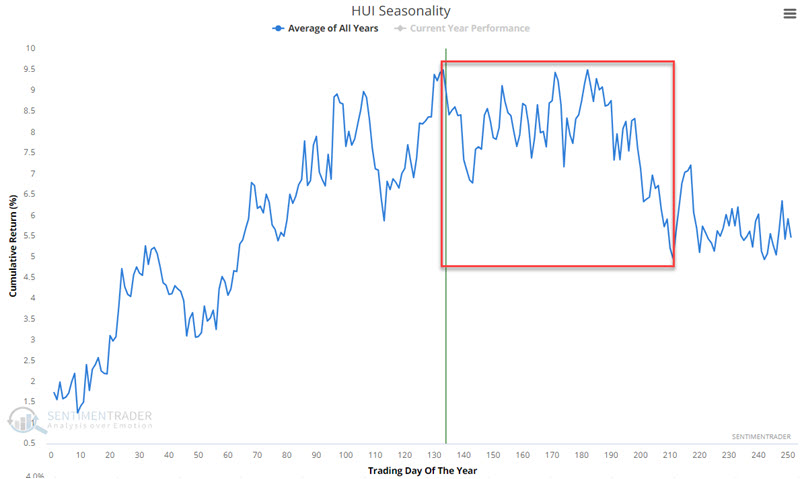
Ticker HUI has a longer history and displays a similar but slightly different annual seasonal pattern. For HUI, the unfavorable period extends from TDY #133 through TDY #211, as seen below.
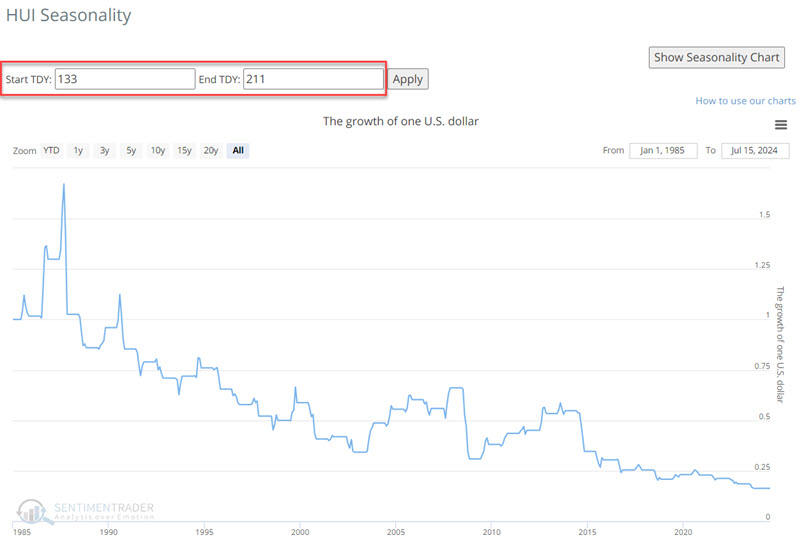
The chart below displays the hypothetical growth of $1 invested in HUI only during this period over the past 40 years.
The key things to note above are:
- The fact that results can vary widely from year to year
- The unmistakable long-term downside bias
What the research tells us…
Gold is the primary driving force for gold stocks. And gold is presently in a powerful uptrend. Historically, gold miners have performed well - typically outperforming gold bullion itself - during gold bull markets. Likewise, gold miners relative to gold bullion are beaten down to near all-time lows. All these factors provide powerful ammunition for anyone wanting to make a bullish case for gold stocks. And we acknowledge that things could play out exactly this way.
Nevertheless, an objective look at the current state of the breadth and seasonal factors highlighted above suggests that investors might do well to consider opportunities elsewhere for the time being.