
Wall Street is upgrading an already expensive earnings season

As we head into Q1 earnings reporting season, expectations are high and stocks are expensive. Wall Street, and the investors that rely on their analysis, are gearing up for blockbuster performances.
At the start of the last 282 earnings seasons, dating back to 1950, the average Shiller PE ratio for the S&P 500 was 19.3. This season, its valuation is nearly twice that, above 37.0.
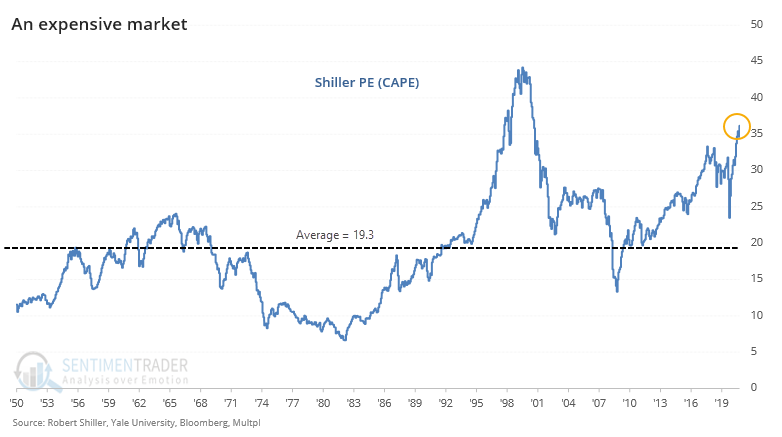
There are slightly different ways to calculate this valuation measure, and it certainly has its detractors. Using a definition from Multpl, the measure is calculated by:
- Looking at the yearly earning of the S&P 500 for each of the past ten years
- Adjusting these earnings for inflation, using the CPI
- Averaging these values (ie: add them up and divide by ten)
- Taking the current price of the S&P 500 and divide by #3
The histogram below shows the distribution of valuation ratios on days when earnings season began for any quarter since 1950.
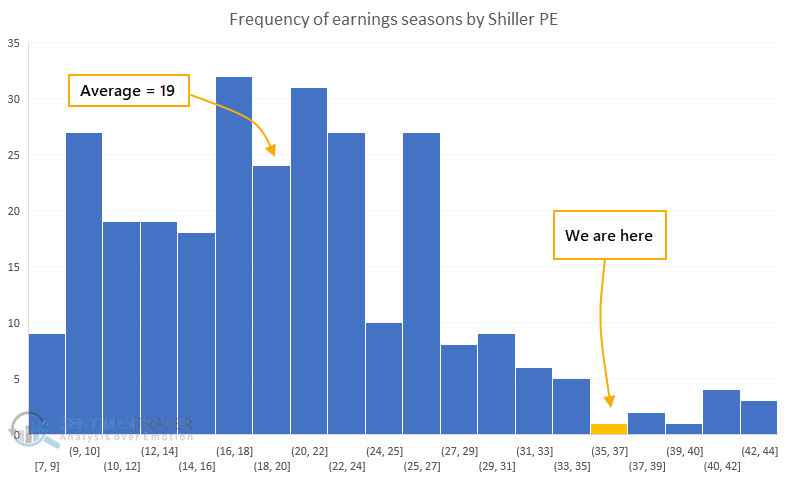
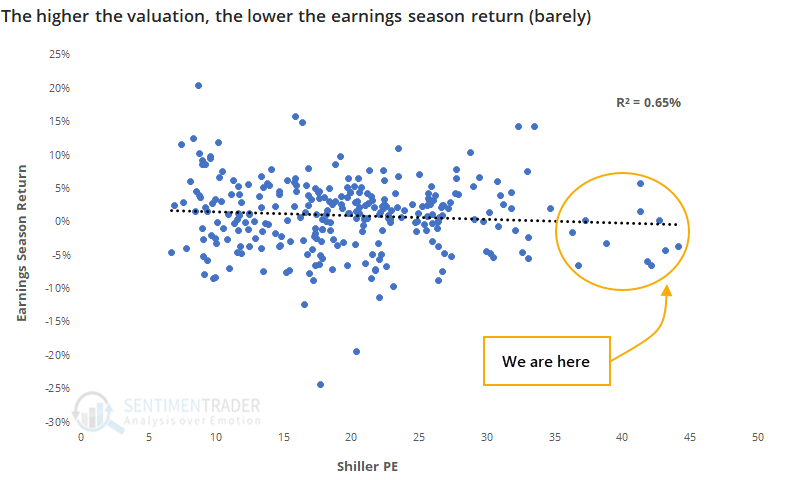
It's not a shocker that stocks are expensive, just as we head into the period that investors will be most focused on the denominator of that equation. But using valuation for short-term guidance like a single earnings season is iffy, and indeed there has been only a slight negative correlation.
The scatter plot below shows returns in the S&P 500 during every earnings season since 1950 versus the Shiller PE ratio on the first day of earnings season. Reporting season roughly begins about 5 days following the end of a quarter and lasts around 28 days. There is no official beginning or end.
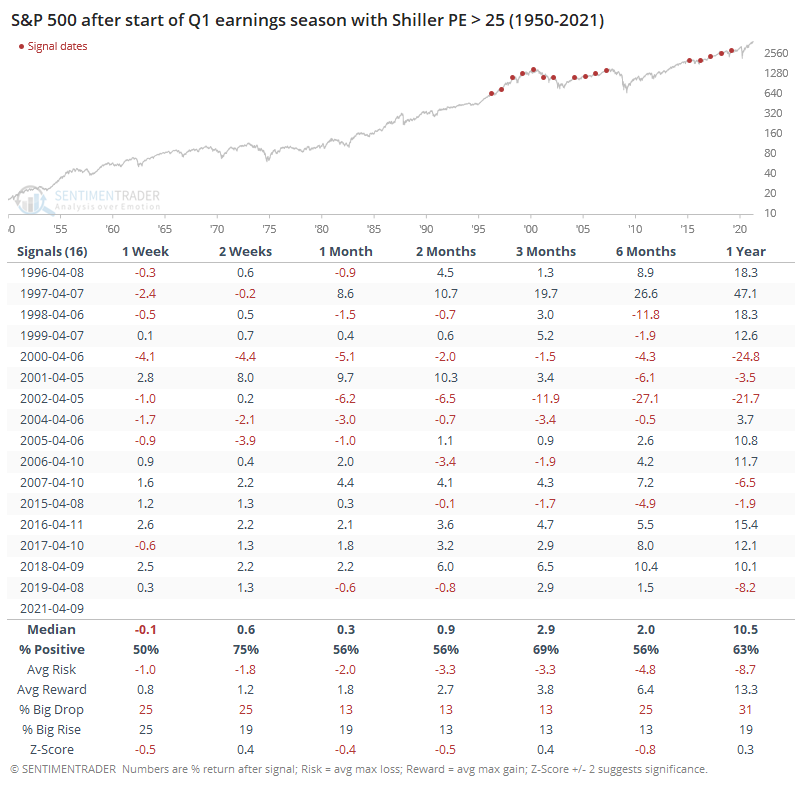
There have been 16 Q1 earnings seasons when the Shiller PE was 25 or higher, and the S&P gained during those earnings seasons 8 times, with a median return of 0.2% - not great, but still positive.
By contrast, there were 20 Q1 earnings seasons when the ratio was 15 or below. Those led to 16 positive returns, with a median of 2.7%, which is much better.
All of the most expensive Q1 earnings seasons have come in the past 25 years. Again, the table shows that forward returns weren't terrible, they just weren't great, with more risk than reward up to 2 months later.
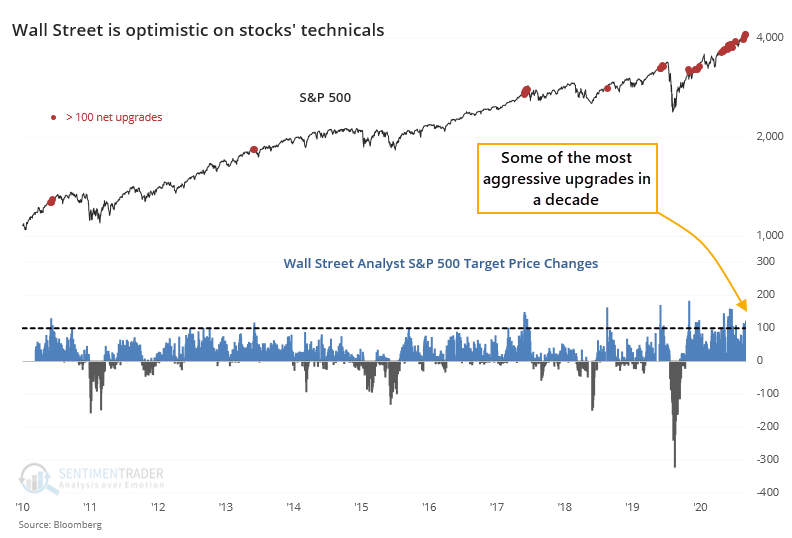
Wall Street has been warming up to the upcoming reports with a bevy of bottom-up upgrades. Analysts have consistently upgraded the net price targets on more than 100 stocks in the S&P 500 in recent days.
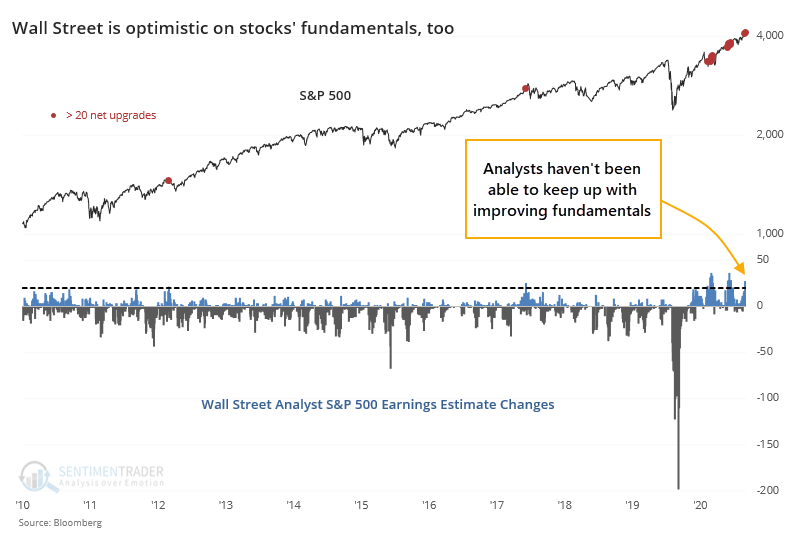
They're typically a lot more careful with fundamental upgrades, but there, too, they haven't been able to keep up.
So, we're entering the coming month of earnings reports with extremely high valuations already, and anticipation that those values will get even more stretched as companies report their results. The only real comparison to this is Q3 of 2017, when stocks were highly valued (but not as high as they are currently) and Wall Street was extremely optimistic (but not as optimistic as it is now). Stocks continued higher during Q4 then gave back all those gains and then some.
This is just more evidence of the tension we're facing right now; a mostly pristine market environment with almost no internal risk signals triggering, versus stretched sentiment and lopsided positioning. It would be rare to see an immediate, large, and protracted decline from these conditions, just as it would be rare to see a large, sustained advance.