Products
SentimenTrader Trading Tools
‍
Backtest Engine
My Trading Toolkit
Correlation Analysis
Seasonality
Indicators & Data API
‍
Proprietary Indicators & Charts
Market Data API
Strategies & Scanner
‍
50+ Trading Strategies
Smart Stock Scanner
Research Reports
‍
Research Solutions
Reports Library
Free Resources
Simple Backtest Calculator
Simple Seasonality Calculator
The Kelly Criterion Calculator
Sentiment Geo Map
Public Research Reports
Pricing
Company
About
In the News
Testimonials
Client Success Stories
Contact
Log inLoginSign up
< BACK TO ALL REPORTS

Wall Street Is The Most Confused In 20 Years

Jason Goepfert
2019-09-05
null

This is an abridged version of our recent reports and notes. For immediate access with no obligation, sign up for a 30-day free trial now.

The Street is behind and confused

Wall Street analysts have underestimated the growth in S&P 500 company earnings growth for a year, one of the longest stretches in nearly 30 years.

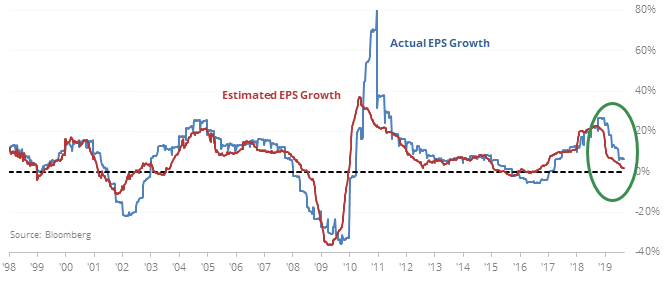
It’s not a great surprise that the better-than-expected stretches in actual results ended up leading to better-than-average returns, though it wasn’t a raging buy signal.

It's not just analysts - strategists on the Street are the most confused they’ve been in at least 20 years, with highly variable year-end price targets for the index.

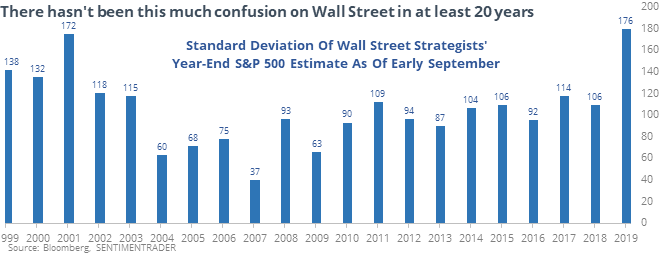
There isn't a clear correlation between strategists' year-end targets and actual returns, but there was a modest bias toward higher returns when strategists were confused.

No direction

Over the past month, the S&P 500 hasn’t gone anywhere. The Positive and Negative Directional Movement for the index are both near 50, showing that there has been no strong or sustained moves either way.

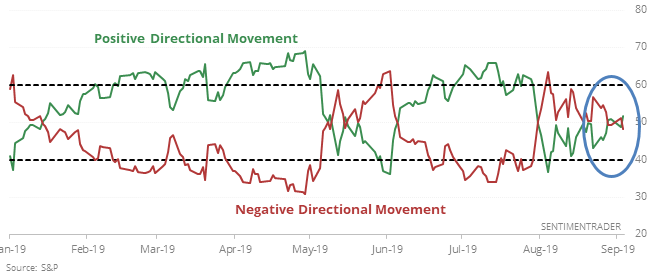
Now the index is on the upper end of that range, which should be a good sign, though evidence is mixed. Returns were decent in the shorter-term, but probably a little disappointing for bulls counting on a breakout. The S&P did usually break out of its range to the upside, but gains tended to be somewhat limited and failed to sustain themselves several times.

Power surge

Utility stocks had a great day on Tuesday, showing a bit of exhaustion on Wednesday. Hard to blame them – nearly 60% of the sector’s stocks hit a 52-week high, one of the largest readings in 20 years. Our Backtest Engine shows that XLU had a positive return two months later only 33% of the time after similar surges. If we substitute SPY for XLU in the backtest, then we can see the S&P was higher 95% of the time two months later.
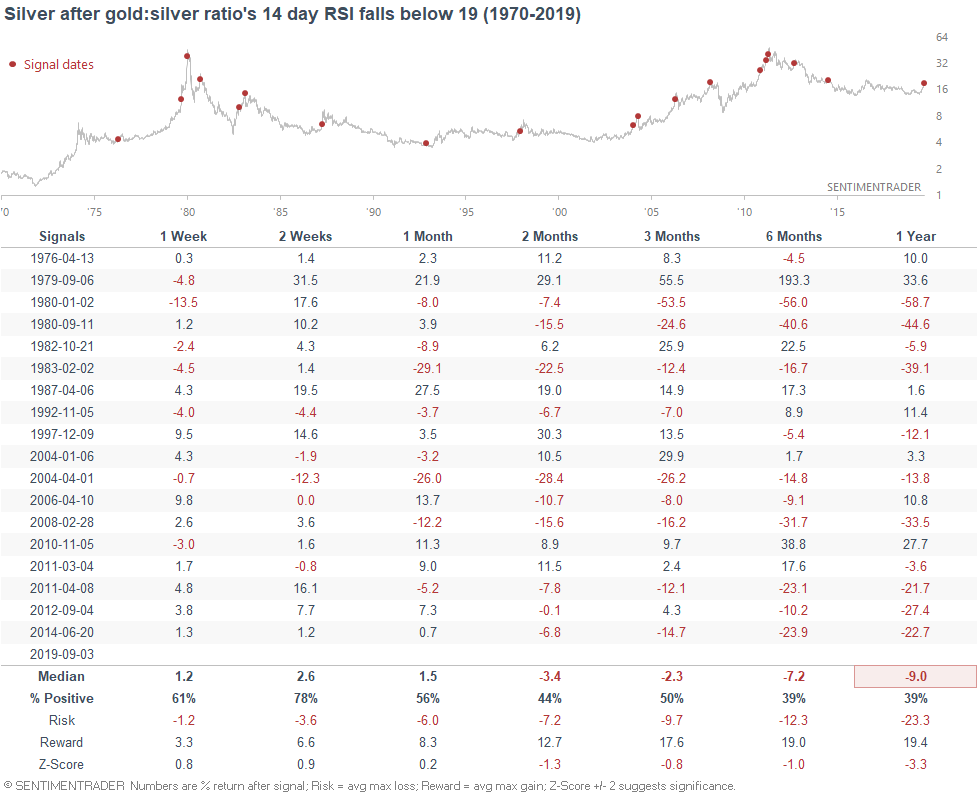
Silver’s run

The ratio between gold and silver hit oversold territory for the first time in 5 years. This has consistently led to a negative return in silver from 2 months and beyond, especially over 6-12 months.

PRODUCTS
SentimenTrader
Trading Tools
Indicators & Data API
‍
Strategies & Scanner
‍
Research Reports
FREE
RESOUrCES
Simple Backtest
Calculator
Simple Seasonality
Calculator
The Kelly Criterion
Calculator
Sentiment Geo Map
‍
Public Research Reports
‍
Pricing
Bundle pricing
‍
Announcements
‍
FAQ
COMPANY
‍
About
‍
In the News
‍
Testimonials
‍
Client Success Stories
CONTACT
‍
General Inquiries
‍
Media Inquiries
‍
Financial Professionals Inquiries
‍
© 2025 Sundial Capital Research Inc. All rights reserved.
Setsail Marketing
TermsPrivacyAffiliate Program
Risk Disclosure: Futures and forex trading contains substantial risk and is not for every investor. An investor could potentially lose all or more than the initial investment. Risk capital is money that can be lost without jeopardizing ones’ financial security or life style. Only risk capital should be used for trading and only those with sufficient risk capital should consider trading. Past performance is not necessarily indicative of future results.

Hypothetical Performance Disclosure: Hypothetical performance results have many inherent limitations, some of which are described below. No representation is being made that any account will or is likely to achieve profits or losses similar to those shown; in fact, there are frequently sharp differences between hypothetical performance results and the actual results subsequently achieved by any particular trading program. One of the limitations of hypothetical performance results is that they are generally prepared with the benefit of hindsight. In addition, hypothetical trading does not involve financial risk, and no hypothetical trading record can completely account for the impact of financial risk of actual trading. for example, the ability to withstand losses or to adhere to a particular trading program in spite of trading losses are material points which can also adversely affect actual trading results. There are numerous other factors related to the markets in general or to the implementation of any specific trading program which cannot be fully accounted for in the preparation of hypothetical performance results and all which can adversely affect trading results.

Testimonial Disclosure: Testimonials appearing on this website may not be representative of other clients or customers and is not a guarantee of future performance or success.